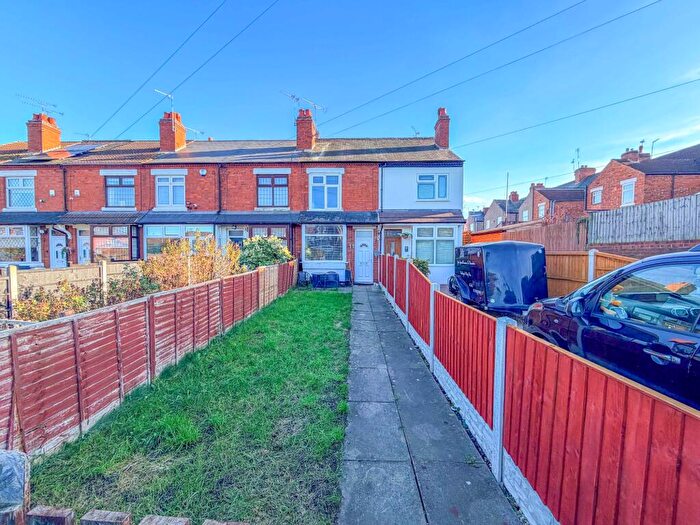
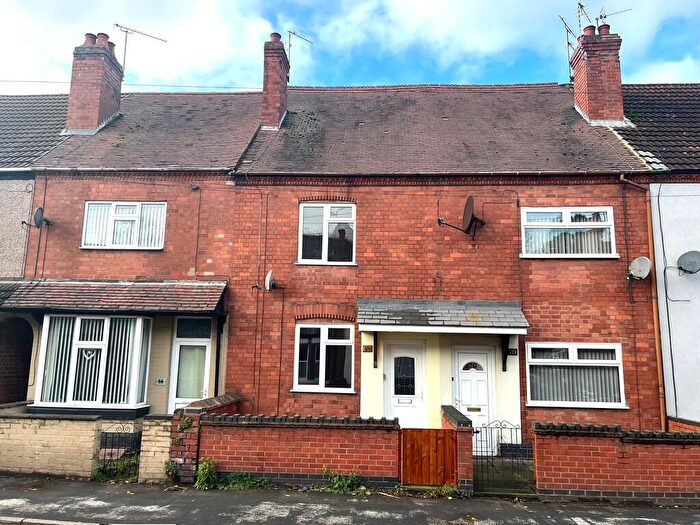
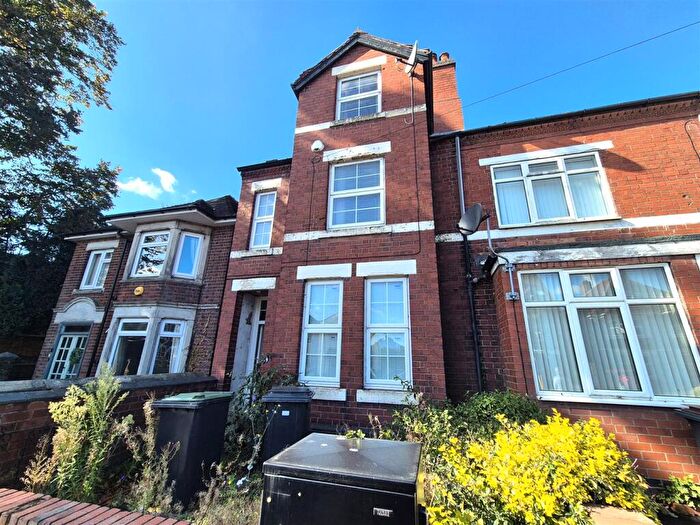
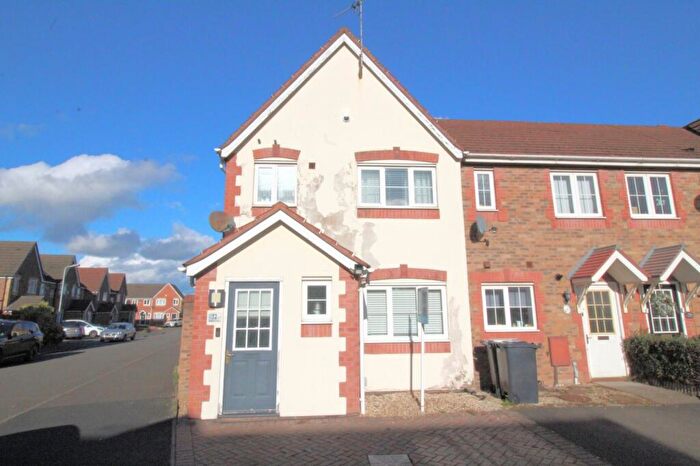
Houses for sale & to rent in Poplar, Bedworth
House Prices in Poplar
Properties in Poplar have an average house price of £173,276.00 and had 142 Property Transactions within the last 3 years¹.
Poplar is an area in Bedworth, Warwickshire with 1,824 households², where the most expensive property was sold for £392,500.00.
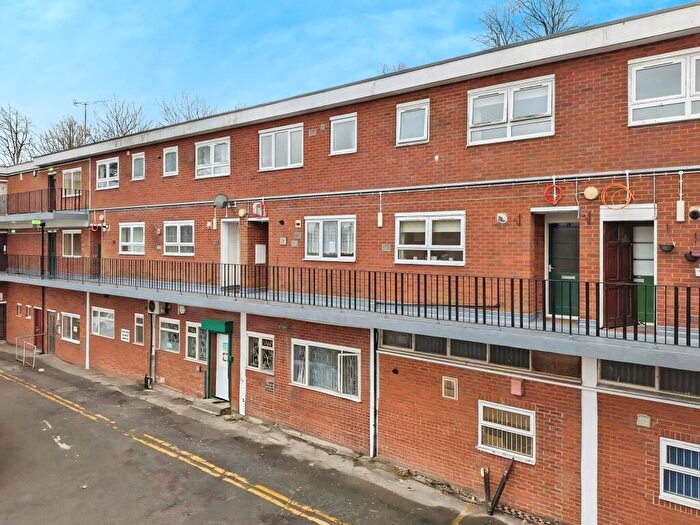
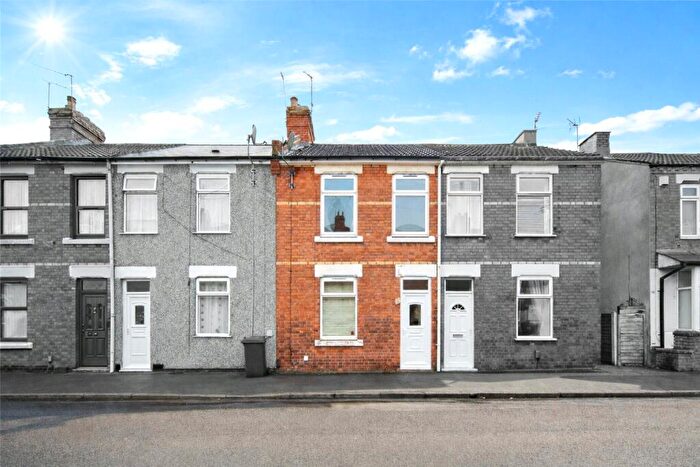
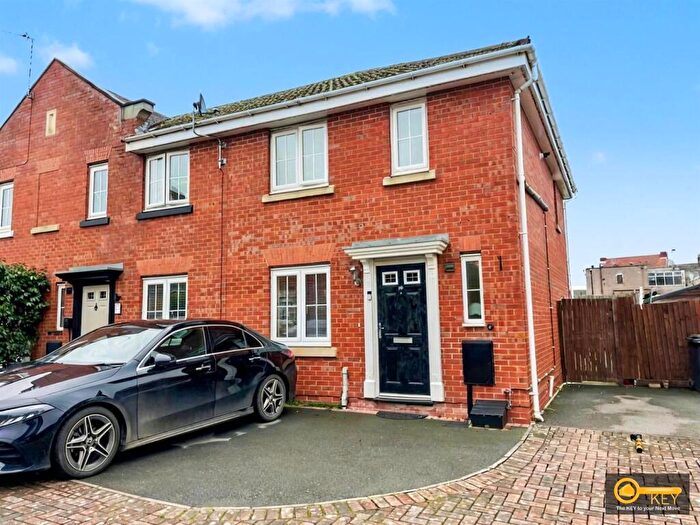
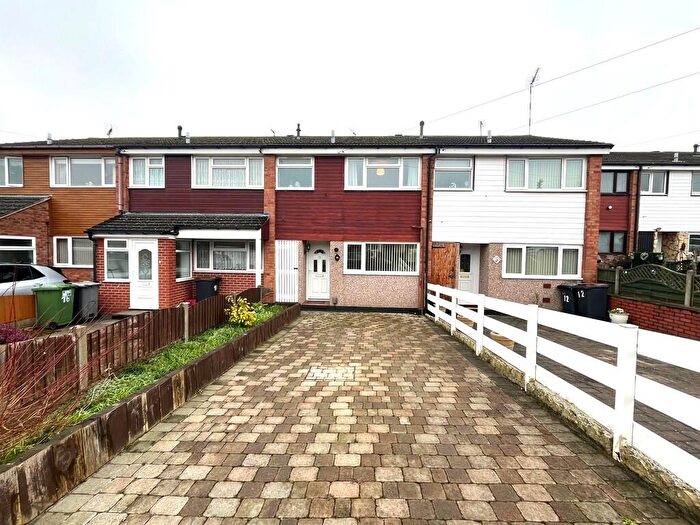
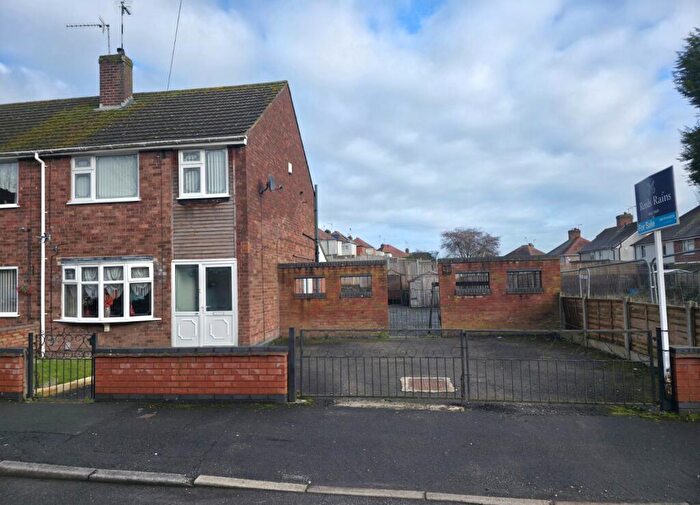
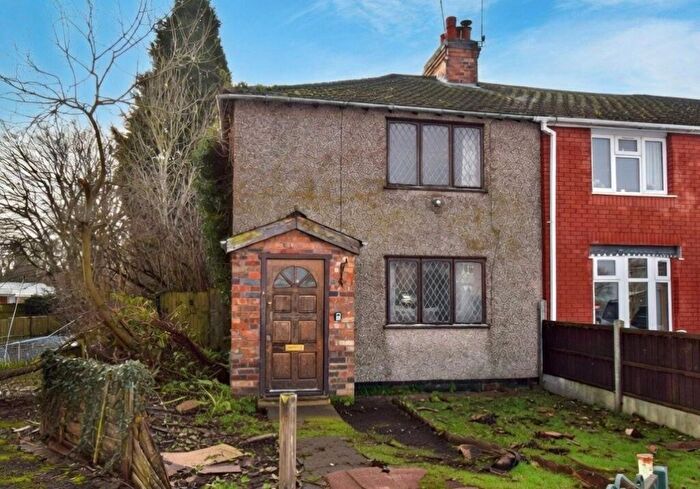
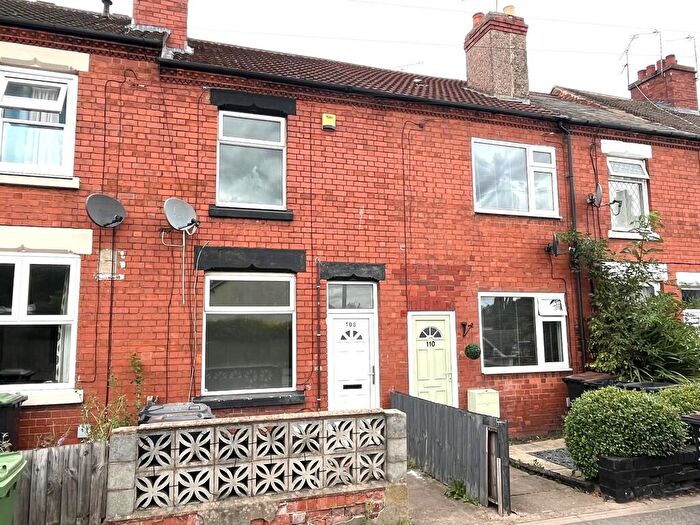
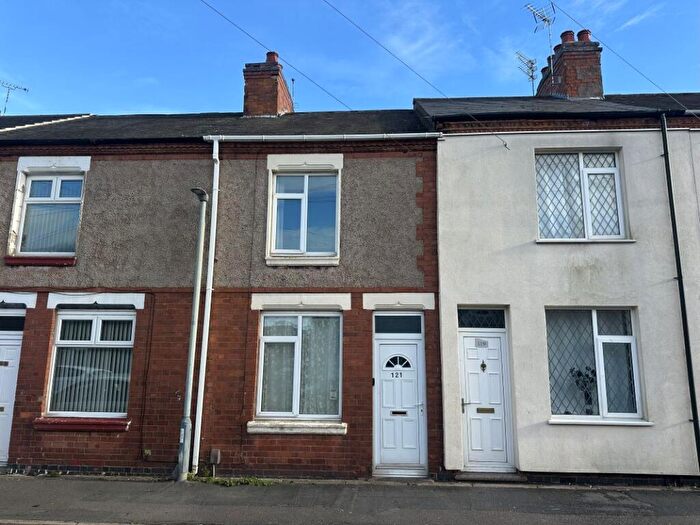
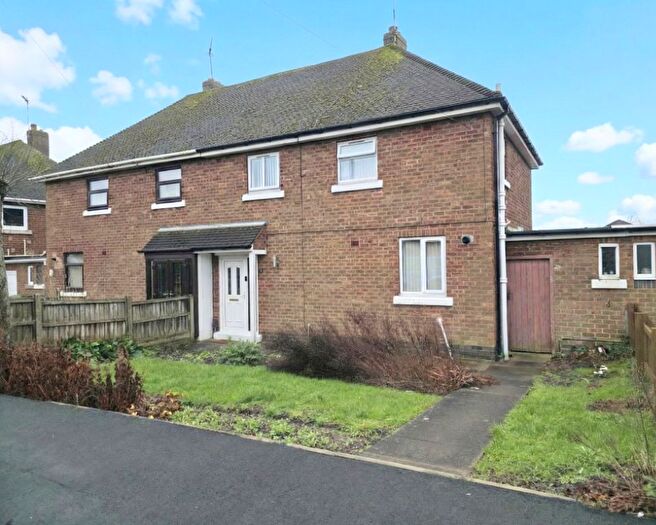
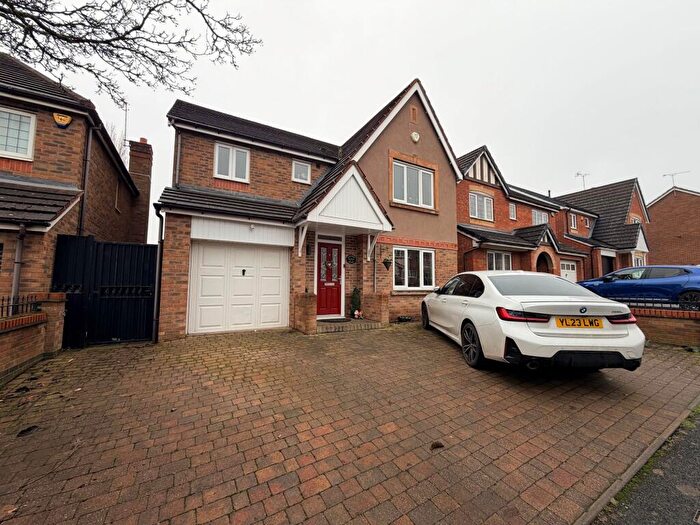
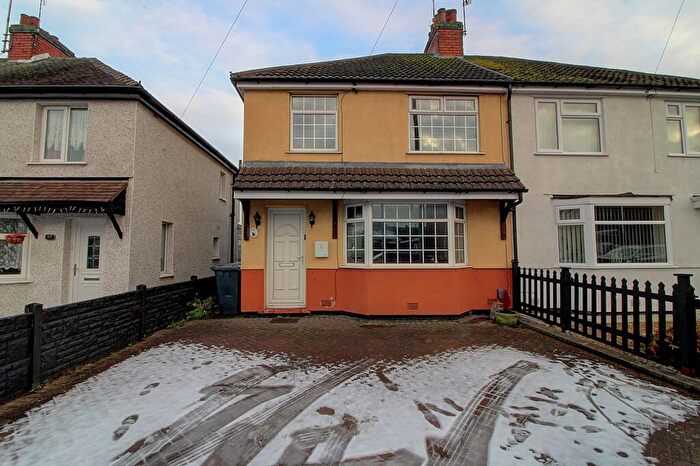
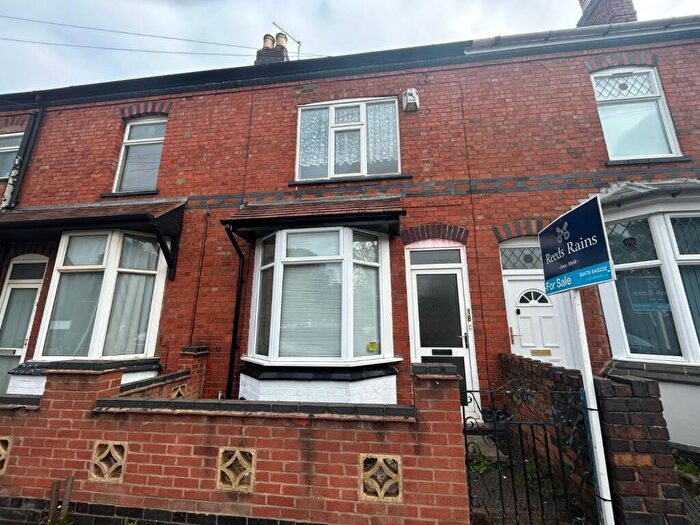
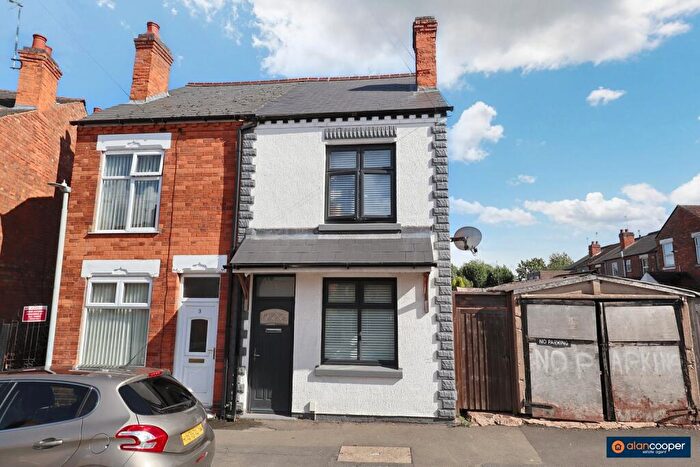
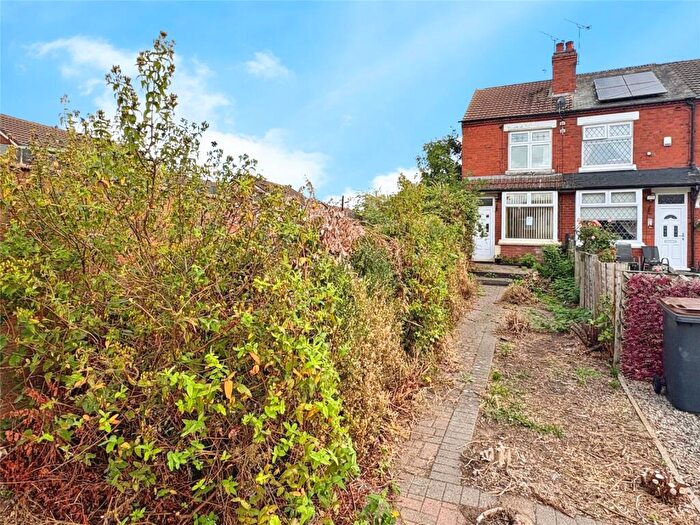
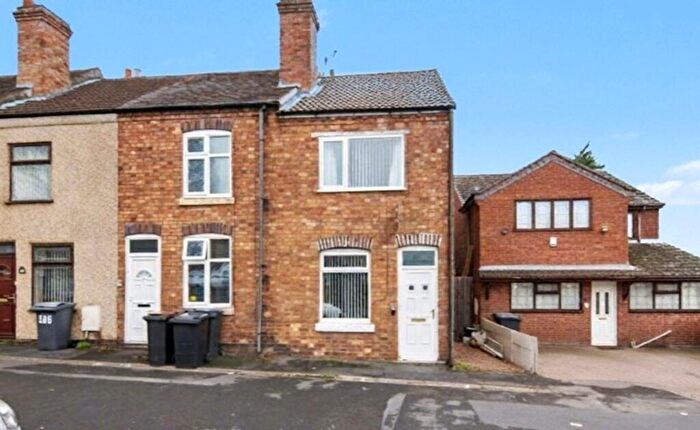
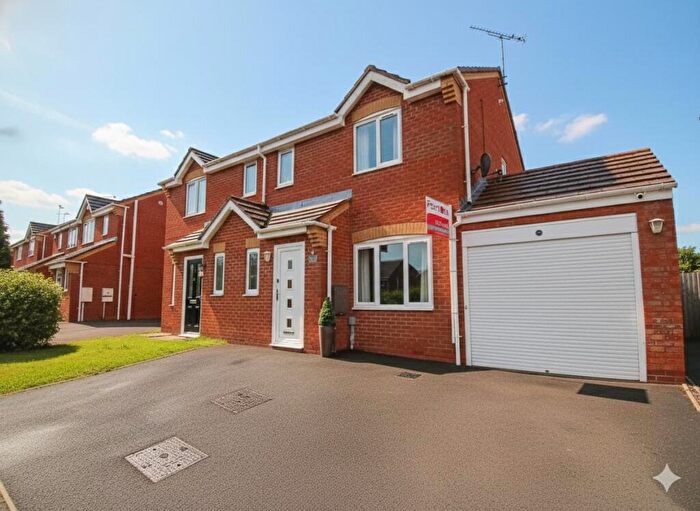
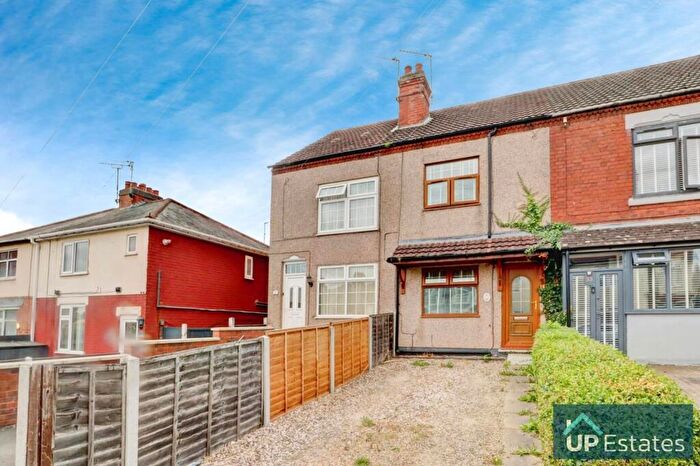
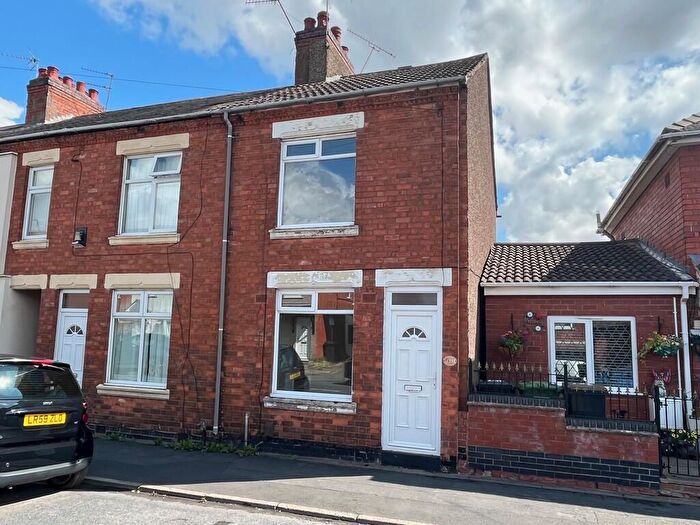
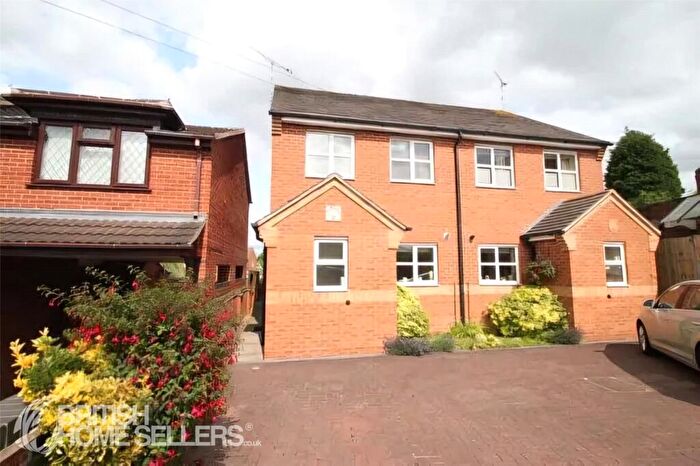
Properties for sale in Poplar
Roads and Postcodes in Poplar
Navigate through our locations to find the location of your next house in Poplar, Bedworth for sale or to rent.
| Streets | Postcodes |
|---|---|
| Acacia Crescent | CV12 9BY CV12 9BZ CV12 9DB |
| Bedworth Hill | CV12 9HH |
| Brick Kiln Way | CV12 9DP |
| Bulkington Road | CV12 9DG CV12 9DH CV12 9DR CV12 9DT CV12 9EB CV12 9ED CV12 9EE CV12 9DD CV12 9EA |
| Burns Walk | CV12 9HL |
| Byron Avenue | CV12 9EX |
| Chapel Street | CV12 8PZ |
| Coalpit Fields Road | CV12 9HN CV12 9HQ CV12 9HS CV12 9HW |
| Columbia Gardens | CV12 9EF |
| Corn Meadows | CV12 9AS |
| Coventry Road | CV12 8NN CV12 8NW |
| Drayton Road | CV12 9EY CV12 9EZ |
| Earl Street | CV12 9DJ |
| East Avenue | CV12 9EH |
| Edward Road | CV12 8PR CV12 8PS |
| George Eliot Avenue | CV12 9ET CV12 9EU |
| Gilbert Close | CV12 8NJ |
| Hatters Court | CV12 9AU |
| Hazel Grove | CV12 9DA |
| Hazelcroft Way | CV12 9AX |
| King Street | CV12 8JE CV12 8JF CV12 8JQ |
| Kings Gardens | CV12 8JG |
| Lady Warwick Avenue | CV12 9HR |
| Milton Close | CV12 9HA |
| Mitchell Road | CV12 9HP |
| New Street | CV12 9DL |
| North Avenue | CV12 9EQ |
| Pebblebrook Way | CV12 9HF |
| Poplar Avenue | CV12 9EN CV12 9EW CV12 9ER |
| Queen Street | CV12 8JJ |
| Railway Terrace | CV12 9DQ |
| Rye Piece Ringway | CV12 8JH CV12 8JT |
| Sadler Gardens | CV12 9HG |
| Shakespeare Avenue | CV12 9ES |
| Shelley Close | CV12 9HE |
| Tewkesbury Drive | CV12 9ST |
| The Priors | CV12 9NZ |
| Tintern Way | CV12 9SS |
| Walter Scott Road | CV12 9HD |
| West Avenue | CV12 9EG |
| William Street | CV12 9DS |
| Wootton Street | CV12 9DU CV12 9DX CV12 9DY CV12 9DZ |
| Wordsworth Road | CV12 9HB |
| York Avenue | CV12 9EJ CV12 9EL CV12 9EP |
Transport near Poplar
- FAQ
- Price Paid By Year
- Property Type Price
Frequently asked questions about Poplar
What is the average price for a property for sale in Poplar?
The average price for a property for sale in Poplar is £173,276. This amount is 23% lower than the average price in Bedworth. There are 604 property listings for sale in Poplar.
What streets have the most expensive properties for sale in Poplar?
The streets with the most expensive properties for sale in Poplar are The Priors at an average of £392,500, Tewkesbury Drive at an average of £316,666 and Columbia Gardens at an average of £292,333.
What streets have the most affordable properties for sale in Poplar?
The streets with the most affordable properties for sale in Poplar are Wordsworth Road at an average of £105,000, New Street at an average of £123,661 and Queen Street at an average of £136,250.
Which train stations are available in or near Poplar?
Some of the train stations available in or near Poplar are Bedworth, Bermuda Park and Coventry Arena.
Property Price Paid in Poplar by Year
The average sold property price by year was:
| Year | Average Sold Price | Price Change |
Sold Properties
|
|---|---|---|---|
| 2025 | £179,592 | 8% |
38 Properties |
| 2024 | £164,906 | -8% |
55 Properties |
| 2023 | £177,774 | -10% |
49 Properties |
| 2022 | £195,112 | 17% |
68 Properties |
| 2021 | £162,409 | 3% |
76 Properties |
| 2020 | £158,193 | 1% |
55 Properties |
| 2019 | £156,684 | 2% |
76 Properties |
| 2018 | £153,610 | 17% |
75 Properties |
| 2017 | £127,559 | -3% |
53 Properties |
| 2016 | £131,664 | 9% |
80 Properties |
| 2015 | £119,901 | 12% |
62 Properties |
| 2014 | £104,948 | 5% |
83 Properties |
| 2013 | £99,250 | -18% |
36 Properties |
| 2012 | £116,778 | 6% |
26 Properties |
| 2011 | £110,245 | 3% |
25 Properties |
| 2010 | £106,669 | 18% |
38 Properties |
| 2009 | £87,769 | -48% |
31 Properties |
| 2008 | £129,761 | 3% |
55 Properties |
| 2007 | £125,464 | 11% |
101 Properties |
| 2006 | £111,441 | 1% |
110 Properties |
| 2005 | £110,279 | 4% |
130 Properties |
| 2004 | £105,478 | 18% |
92 Properties |
| 2003 | £86,205 | 12% |
144 Properties |
| 2002 | £75,571 | 10% |
147 Properties |
| 2001 | £67,941 | 22% |
146 Properties |
| 2000 | £52,846 | 18% |
90 Properties |
| 1999 | £43,521 | 16% |
77 Properties |
| 1998 | £36,702 | -2% |
60 Properties |
| 1997 | £37,253 | -6% |
61 Properties |
| 1996 | £39,348 | 6% |
41 Properties |
| 1995 | £37,048 | - |
58 Properties |
Property Price per Property Type in Poplar
Here you can find historic sold price data in order to help with your property search.
The average Property Paid Price for specific property types in the last three years are:
| Property Type | Average Sold Price | Sold Properties |
|---|---|---|
| Semi Detached House | £193,731.00 | 50 Semi Detached Houses |
| Detached House | £266,055.00 | 9 Detached Houses |
| Terraced House | £156,711.00 | 72 Terraced Houses |
| Flat | £112,818.00 | 11 Flats |

