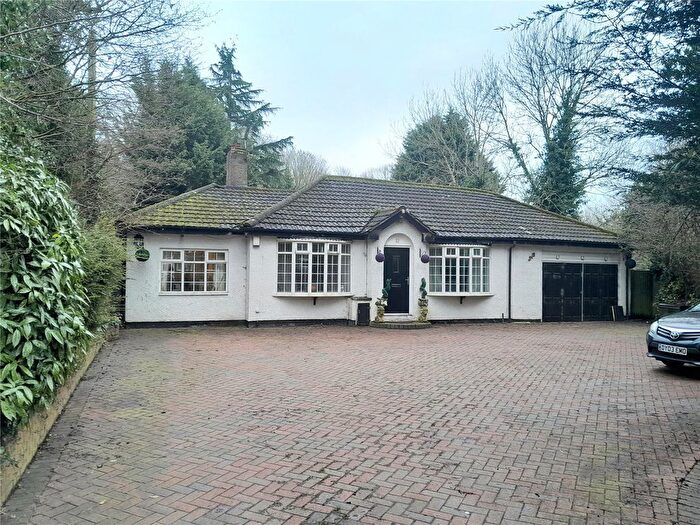
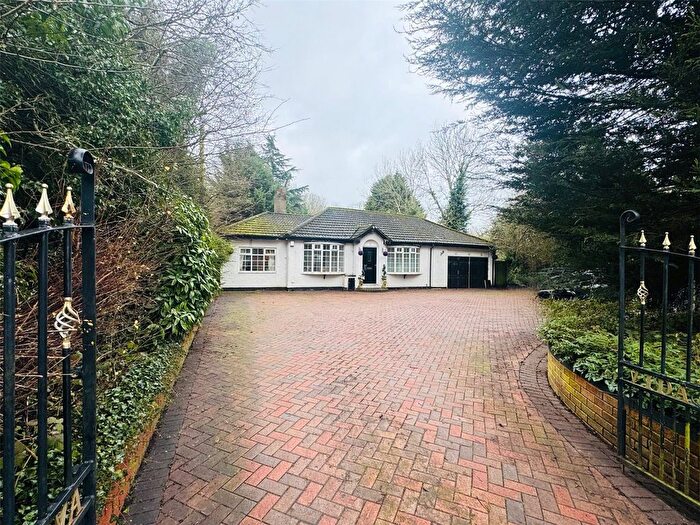
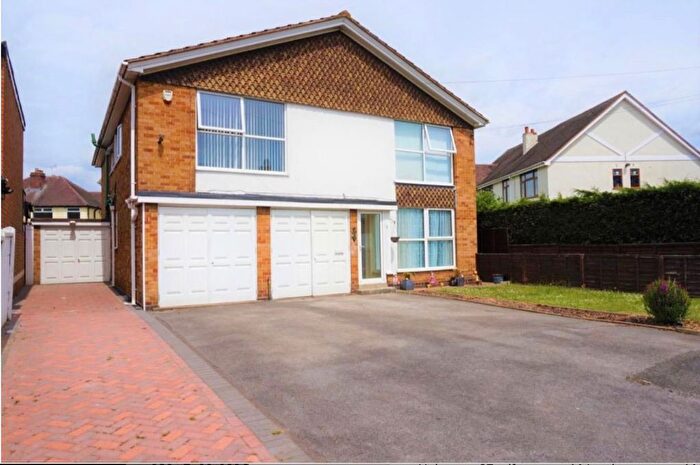
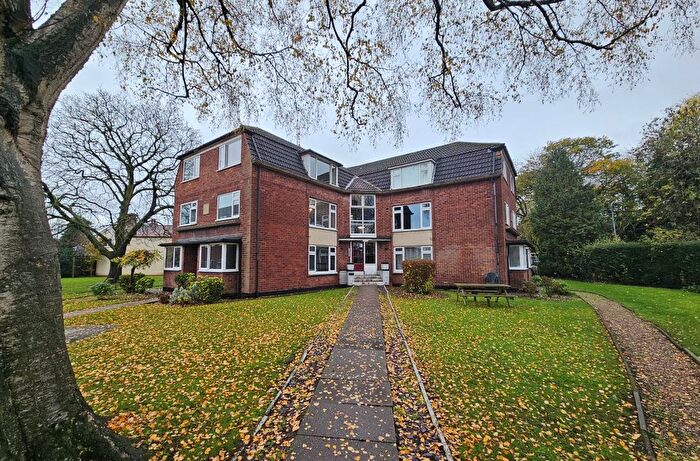
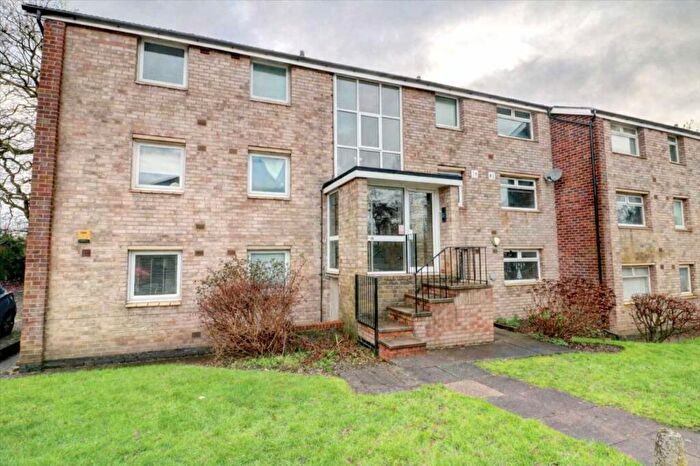
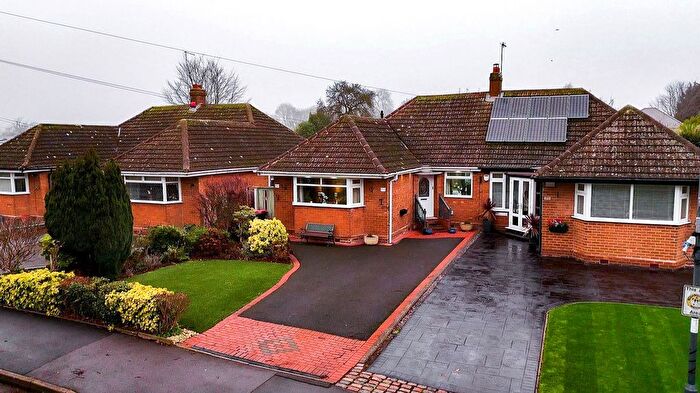
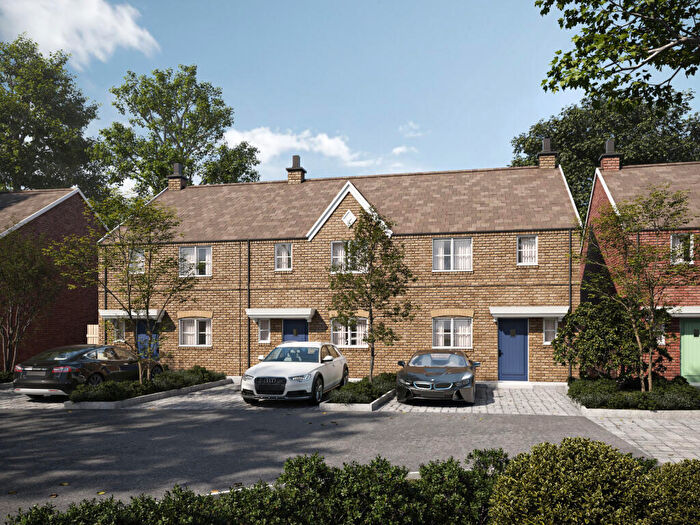
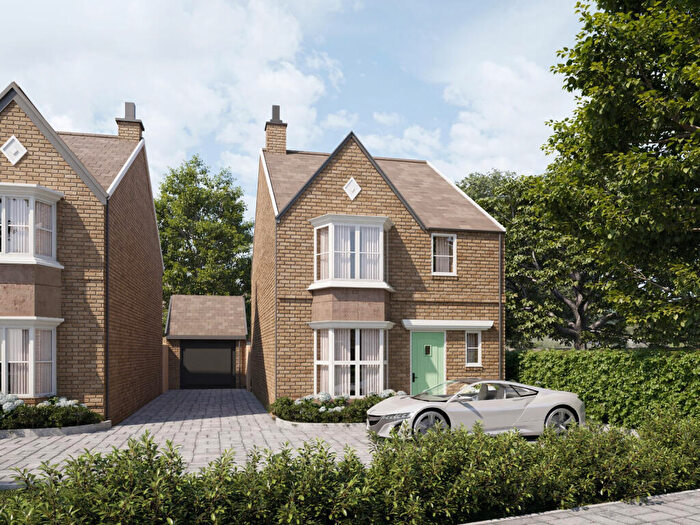
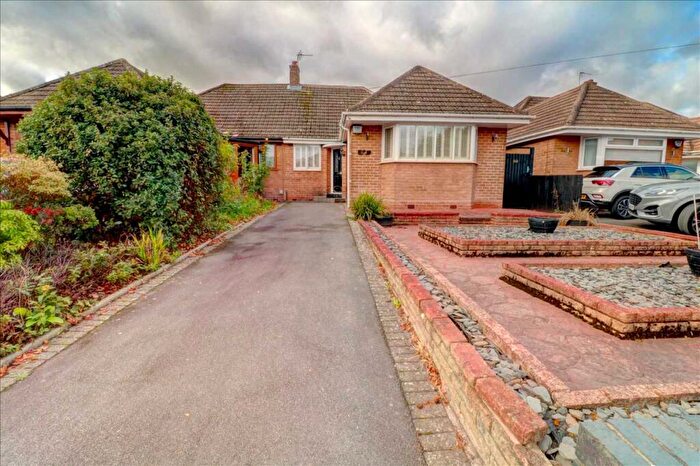
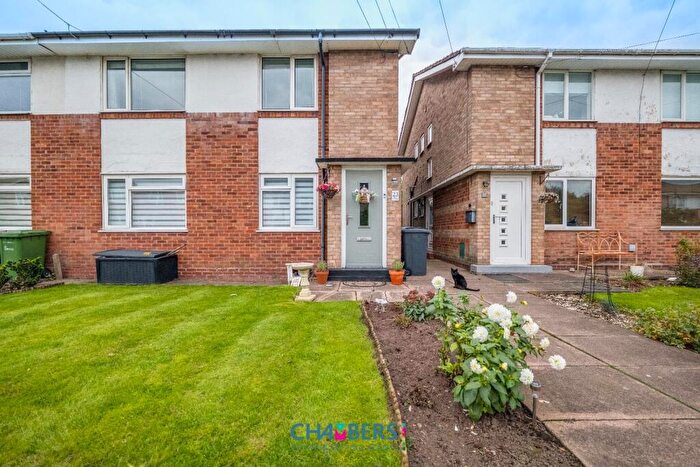
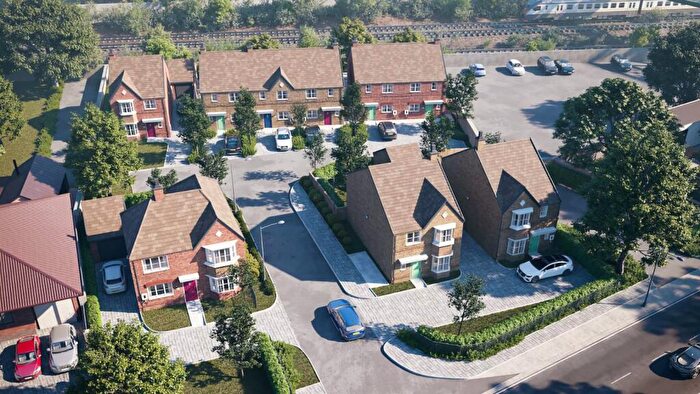
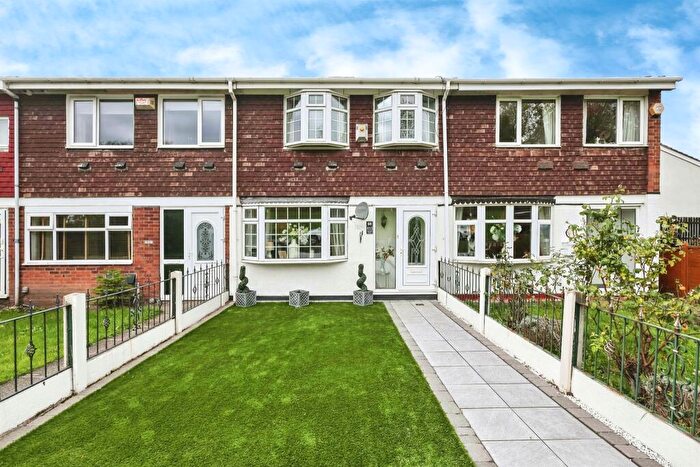
Houses for sale & to rent in Water Orton, Birmingham
House Prices in Water Orton
Properties in Water Orton have an average house price of £292,261.00 and had 125 Property Transactions within the last 3 years¹.
Water Orton is an area in Birmingham, Warwickshire with 1,430 households², where the most expensive property was sold for £735,000.00.
Properties for sale in Water Orton
Previously listed properties in Water Orton
Roads and Postcodes in Water Orton
Navigate through our locations to find the location of your next house in Water Orton, Birmingham for sale or to rent.
| Streets | Postcodes |
|---|---|
| Addison Place | B46 1SU |
| Albion Cottages | B46 1SS |
| Albion Terrace | B46 1ST |
| Attleboro Lane | B46 1SB B46 1SD |
| Beavons Close | B46 1PL |
| Birmingham Road | B46 1SP B46 1SR B46 1TA B46 1TE B46 1TG B46 1TH B46 1TL |
| Christopher Way | B46 1DQ |
| Church Avenue | B46 1QT |
| Coleshill Road | B46 1QD B46 1QE B46 1QF B46 1QX B46 1RA B46 1RD B46 1SH |
| Cottrells Mews | B46 1QB |
| Digby Crescent | B46 1NP |
| Edward Road | B46 1PG |
| George Road | B46 1PE B46 1PF |
| Hargrave Close | B46 1QR |
| Hollyhurst | B46 1PS |
| Howarth Court | B46 1RF |
| Jack O Watton Industrial Estate | B46 1NU |
| Jaques Close | B46 1TJ |
| Long Leys Court | B46 1SL |
| Long Leys Croft | B46 1SJ |
| Ludgate Close | B46 1RP |
| Manor House Lane | B46 1NL |
| Manor House Way | B46 1NE |
| Marsh Lane | B46 1NN B46 1NT B46 1NW B46 1NS |
| Maud Road | B46 1PD |
| Mercer Avenue | B46 1NG B46 1NQ |
| Mickle Meadow | B46 1SN |
| Minworth Road | B46 1NH |
| Mytton Road | B46 1TN |
| New Road | B46 1QG B46 1QP B46 1QU |
| Old Church Road | B46 1NF B46 1NJ |
| Openfield Croft | B46 1RE |
| Orton Close | B46 1SX B46 1SY |
| Overton Drive | B46 1QL |
| Park Grove | B46 1PN |
| Plank Lane | B46 1SG B46 1TB B46 1TD |
| Salisbury Drive | B46 1QH B46 1QJ B46 1QN |
| Smiths Way | B46 1TW |
| St Blaise Avenue | B46 1RT |
| St Pauls Court | B46 1SQ |
| St Peters Close | B46 1RG |
| Station Drive | B46 1QS |
| Stonecross | B46 1NA |
| The Sidings | B46 1QW |
| Turnpike Drive | B46 1PP |
| Vesey Close | B46 1RB |
| Vicarage Lane | B46 1RU B46 1RX B46 1RY |
| Wakefield Grove | B46 1NR |
| Watton Lane | B46 1PB B46 1PH B46 1PJ |
| Weland Close | B46 1RH |
| Weland Court | B46 1RZ |
| Woodlands Avenue | B46 1SA |
Transport near Water Orton
-
Water Orton Station
-
Coleshill Parkway Station
-
Lea Hall Station
-
Marston Green Station
-
Stechford Station
-
Chester Road Station
-
Erdington Station
-
Wylde Green Station
-
Birmingham International Station
-
Gravelly Hill Station
- FAQ
- Price Paid By Year
- Property Type Price
Frequently asked questions about Water Orton
What is the average price for a property for sale in Water Orton?
The average price for a property for sale in Water Orton is £292,261. This amount is 3% lower than the average price in Birmingham. There are 403 property listings for sale in Water Orton.
What streets have the most expensive properties for sale in Water Orton?
The streets with the most expensive properties for sale in Water Orton are Addison Place at an average of £625,000, Vicarage Lane at an average of £517,000 and Smiths Way at an average of £481,790.
What streets have the most affordable properties for sale in Water Orton?
The streets with the most affordable properties for sale in Water Orton are Orton Close at an average of £147,227, Manor House Lane at an average of £160,833 and Long Leys Croft at an average of £170,000.
Which train stations are available in or near Water Orton?
Some of the train stations available in or near Water Orton are Water Orton, Coleshill Parkway and Lea Hall.
Property Price Paid in Water Orton by Year
The average sold property price by year was:
| Year | Average Sold Price | Price Change |
Sold Properties
|
|---|---|---|---|
| 2025 | £301,210 | 9% |
41 Properties |
| 2024 | £274,998 | -10% |
44 Properties |
| 2023 | £302,077 | 4% |
40 Properties |
| 2022 | £288,799 | 4% |
54 Properties |
| 2021 | £276,017 | 2% |
66 Properties |
| 2020 | £269,480 | 19% |
55 Properties |
| 2019 | £218,325 | -8% |
54 Properties |
| 2018 | £236,436 | 3% |
55 Properties |
| 2017 | £229,315 | 4% |
69 Properties |
| 2016 | £219,597 | 11% |
98 Properties |
| 2015 | £195,360 | -1% |
69 Properties |
| 2014 | £196,919 | 6% |
73 Properties |
| 2013 | £184,906 | -0,4% |
49 Properties |
| 2012 | £185,634 | 2% |
41 Properties |
| 2011 | £181,023 | -5% |
38 Properties |
| 2010 | £190,870 | 9% |
35 Properties |
| 2009 | £173,839 | -21% |
23 Properties |
| 2008 | £210,393 | 3% |
22 Properties |
| 2007 | £204,108 | 9% |
79 Properties |
| 2006 | £184,743 | 4% |
93 Properties |
| 2005 | £178,058 | 8% |
62 Properties |
| 2004 | £163,117 | 9% |
97 Properties |
| 2003 | £148,601 | 20% |
59 Properties |
| 2002 | £119,185 | 13% |
93 Properties |
| 2001 | £103,834 | 12% |
78 Properties |
| 2000 | £91,456 | 12% |
75 Properties |
| 1999 | £80,234 | 12% |
65 Properties |
| 1998 | £70,403 | -4% |
59 Properties |
| 1997 | £73,237 | 9% |
64 Properties |
| 1996 | £66,869 | 13% |
74 Properties |
| 1995 | £58,386 | - |
51 Properties |
Property Price per Property Type in Water Orton
Here you can find historic sold price data in order to help with your property search.
The average Property Paid Price for specific property types in the last three years are:
| Property Type | Average Sold Price | Sold Properties |
|---|---|---|
| Semi Detached House | £310,343.00 | 45 Semi Detached Houses |
| Detached House | £497,701.00 | 21 Detached Houses |
| Terraced House | £264,066.00 | 30 Terraced Houses |
| Flat | £144,603.00 | 29 Flats |

