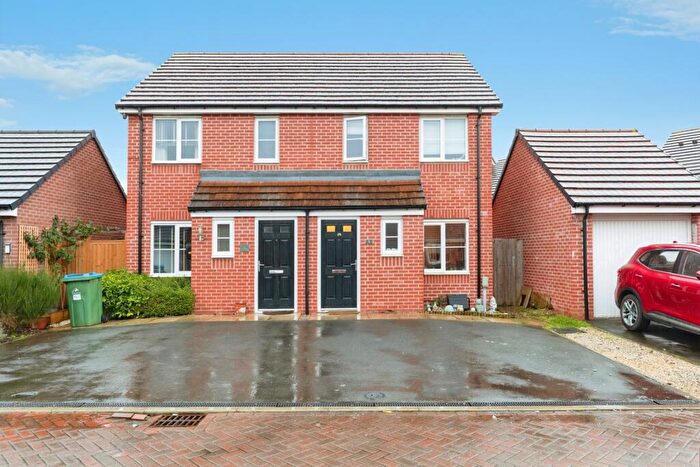
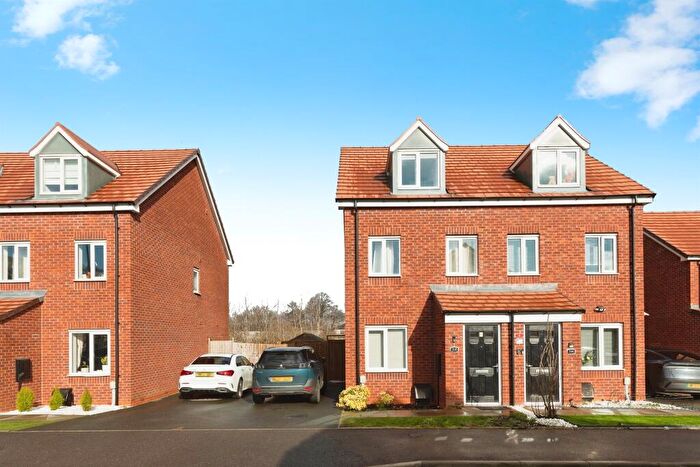
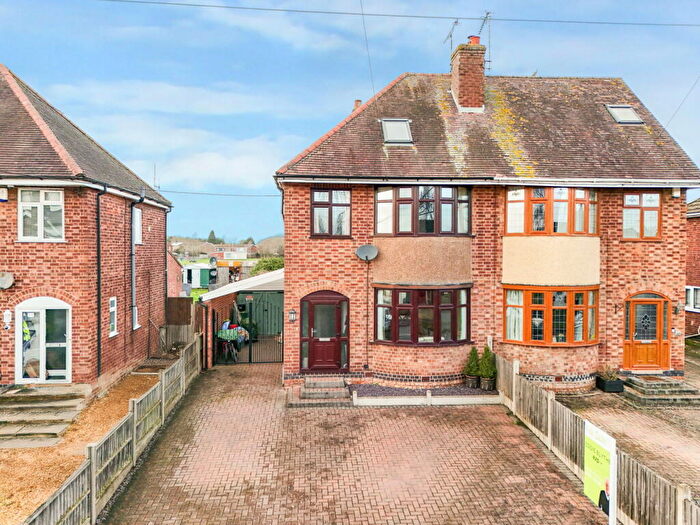
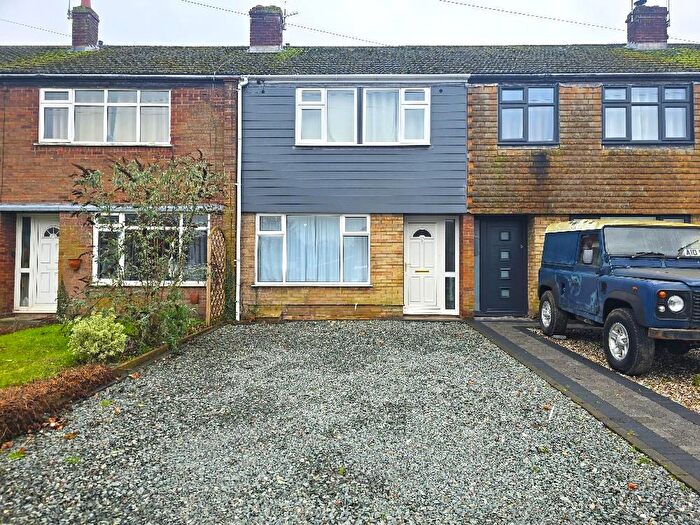
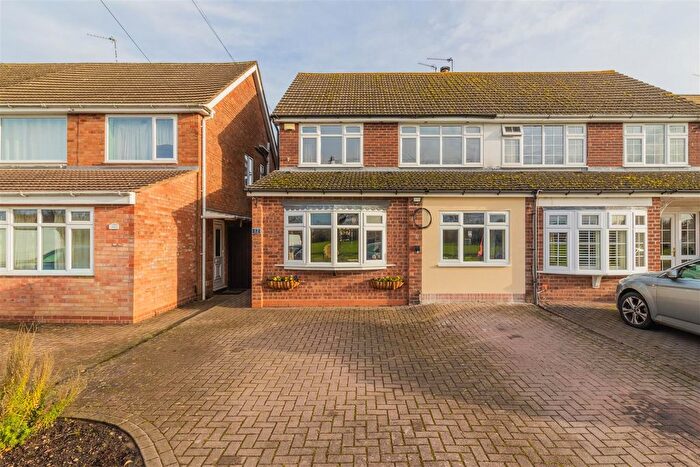
Houses for sale & to rent in Dunsmore, Coventry
House Prices in Dunsmore
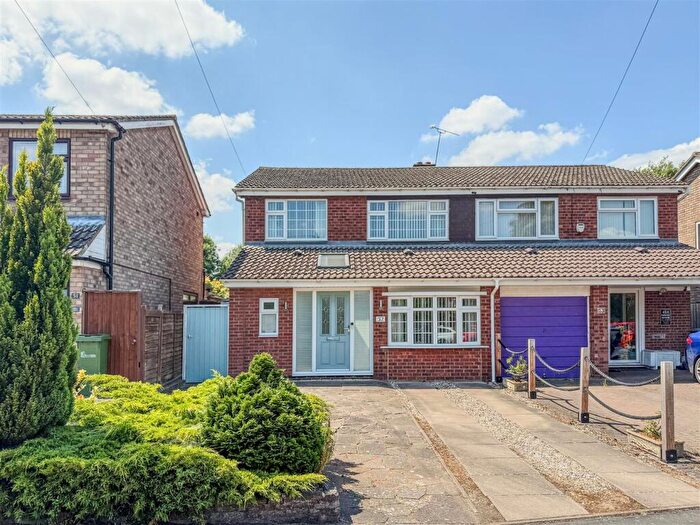
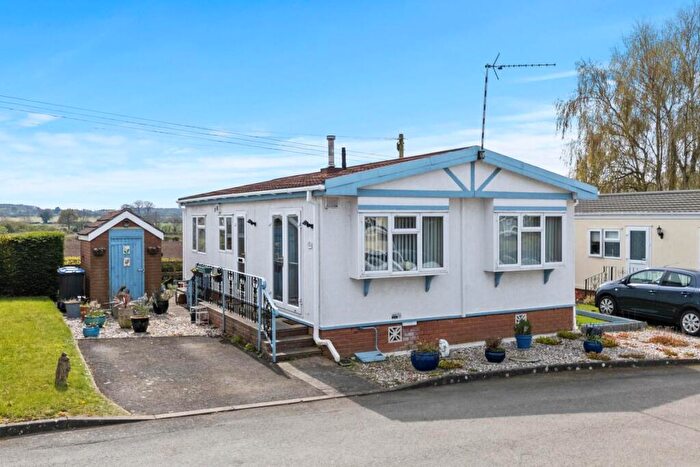
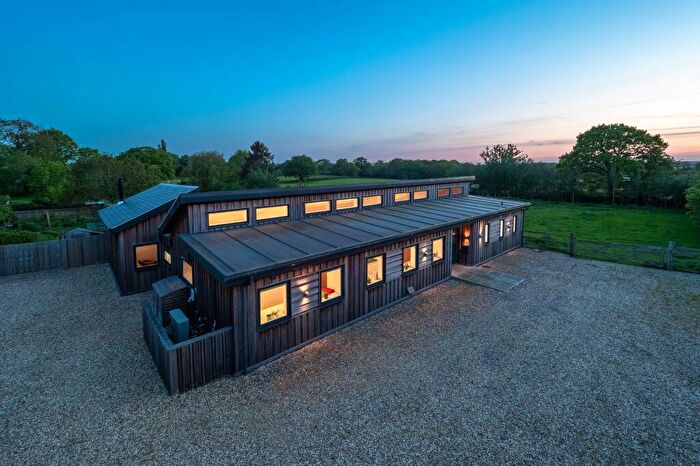
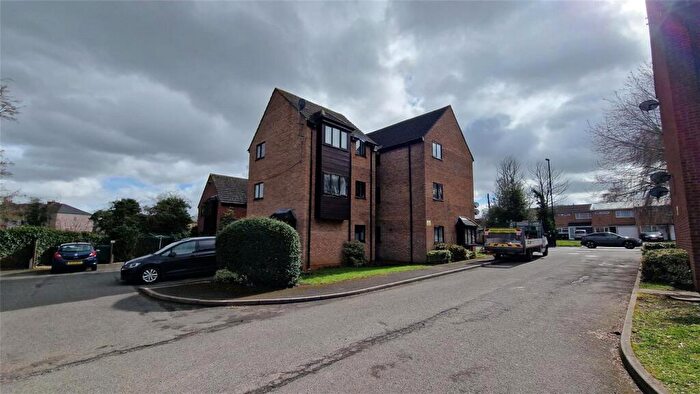
Properties in Dunsmore have an average house price of £324,190.00 and had 61 Property Transactions within the last 3 years¹.
Dunsmore is an area in Coventry, Warwickshire with 729 households², where the most expensive property was sold for £590,000.00.
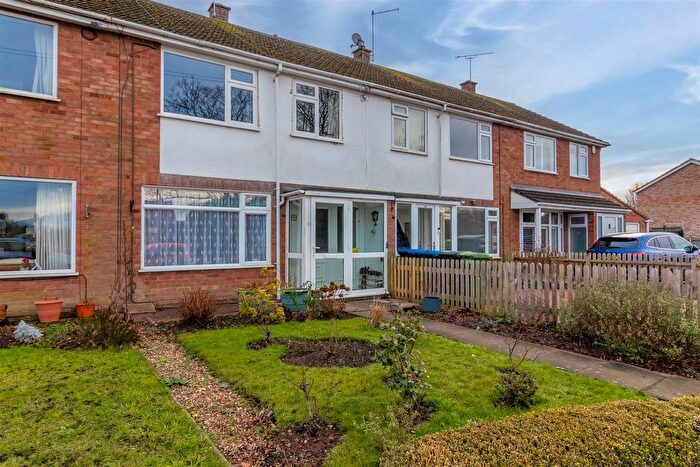
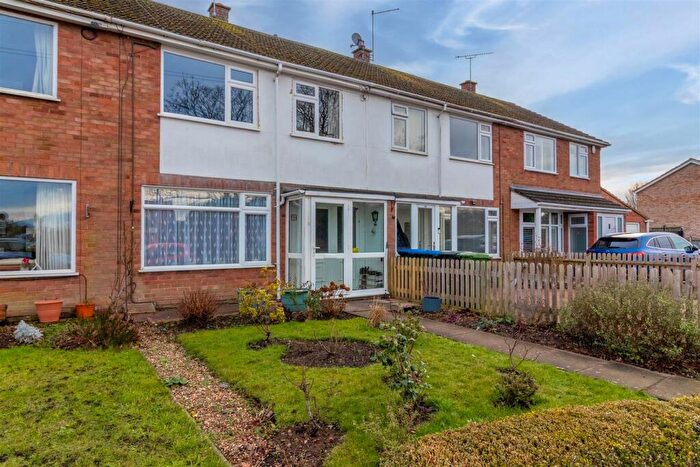
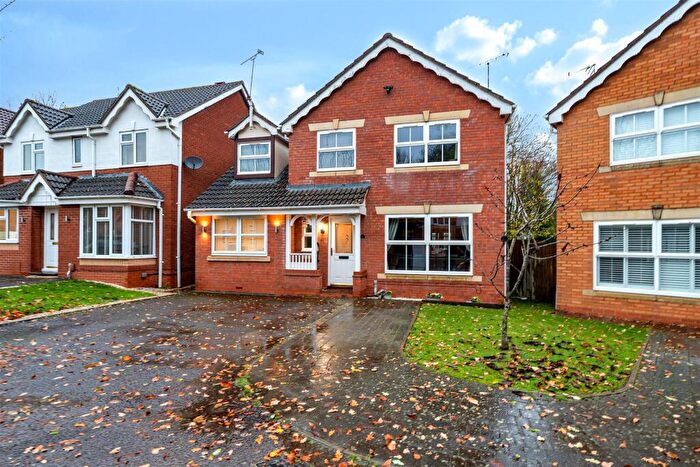
Properties for sale in Dunsmore
Previously listed properties in Dunsmore
Roads and Postcodes in Dunsmore
Navigate through our locations to find the location of your next house in Dunsmore, Coventry for sale or to rent.
| Streets | Postcodes |
|---|---|
| Bagshaw Close | CV8 3EX |
| Cedar Avenue | CV8 3QB |
| Chapel Lane | CV8 3EU |
| Church Close | CV8 3NH |
| Church Road | CV8 3ET |
| Church View | CV8 3NJ |
| Coal Yard Road | CV8 3QF |
| Coppice Close | CV8 3FS |
| Fetherston Crescent | CV8 3EZ |
| Freeboard Lane | CV8 3EQ |
| Handleys Close | CV8 3FG |
| High Street | CV8 3EY CV8 3FH CV8 3FJ |
| Hillman Way | CV8 3ED |
| Holly Drive | CV8 3QA |
| Imperial Road | CV8 3LF |
| Lea Walk | CV8 3QD |
| Leamington Road | CV8 3EL CV8 3FL CV8 3FN CV8 3EN |
| London Road | CV8 3DW CV8 3ER CV8 3EW CV8 3DX CV8 3DY |
| Manns Close | CV8 3FP |
| Oxford Road | CV8 3EA CV8 3EJ CV8 3EP CV8 3EG CV8 3EB |
| Poplar Grove | CV8 3QE |
| Samaritan Way | CV8 3EE |
| Sodens Avenue | CV8 3FE CV8 3FF |
| St Leonards Walk | CV8 3FD |
| Trinity Close | CV8 3FA |
| Warren Close | CV8 3JZ |
| Warren Field | CV8 3FB |
| Wolston Lane | CV8 3ES CV8 3LG |
| Woodside Park | CV8 3JY |
Transport near Dunsmore
-
Coventry Station
-
Canley Station
-
Coventry Arena Station
-
Leamington Spa Station
-
Tile Hill Station
-
Rugby Station
-
Bedworth Station
-
Warwick Station
-
Berkswell Station
-
Warwick Parkway Station
- FAQ
- Price Paid By Year
- Property Type Price
Frequently asked questions about Dunsmore
What is the average price for a property for sale in Dunsmore?
The average price for a property for sale in Dunsmore is £324,190. This amount is 13% higher than the average price in Coventry. There are 292 property listings for sale in Dunsmore.
What streets have the most expensive properties for sale in Dunsmore?
The streets with the most expensive properties for sale in Dunsmore are Poplar Grove at an average of £405,000, Manns Close at an average of £402,500 and London Road at an average of £400,833.
What streets have the most affordable properties for sale in Dunsmore?
The streets with the most affordable properties for sale in Dunsmore are Warren Close at an average of £132,400, Handleys Close at an average of £202,250 and St Leonards Walk at an average of £246,666.
Which train stations are available in or near Dunsmore?
Some of the train stations available in or near Dunsmore are Coventry, Canley and Coventry Arena.
Property Price Paid in Dunsmore by Year
The average sold property price by year was:
| Year | Average Sold Price | Price Change |
Sold Properties
|
|---|---|---|---|
| 2025 | £367,155 | 19% |
13 Properties |
| 2024 | £298,005 | -9% |
23 Properties |
| 2023 | £325,940 | -6% |
25 Properties |
| 2022 | £345,031 | 1% |
27 Properties |
| 2021 | £340,243 | 16% |
41 Properties |
| 2020 | £286,090 | 1% |
27 Properties |
| 2019 | £282,780 | -29% |
23 Properties |
| 2018 | £364,888 | 22% |
17 Properties |
| 2017 | £285,875 | -2% |
36 Properties |
| 2016 | £290,537 | 23% |
32 Properties |
| 2015 | £223,819 | -11% |
21 Properties |
| 2014 | £248,117 | 12% |
17 Properties |
| 2013 | £218,579 | 19% |
34 Properties |
| 2012 | £175,968 | -24% |
16 Properties |
| 2011 | £217,661 | -1% |
27 Properties |
| 2010 | £219,243 | 17% |
23 Properties |
| 2009 | £182,473 | 4% |
19 Properties |
| 2008 | £175,216 | -28% |
9 Properties |
| 2007 | £224,603 | 15% |
38 Properties |
| 2006 | £190,462 | -1% |
43 Properties |
| 2005 | £193,236 | 6% |
31 Properties |
| 2004 | £181,395 | 9% |
37 Properties |
| 2003 | £165,152 | 16% |
44 Properties |
| 2002 | £138,183 | -11% |
27 Properties |
| 2001 | £153,925 | 5% |
67 Properties |
| 2000 | £146,112 | 26% |
99 Properties |
| 1999 | £107,942 | 17% |
48 Properties |
| 1998 | £89,471 | 19% |
23 Properties |
| 1997 | £72,578 | 10% |
12 Properties |
| 1996 | £65,641 | 24% |
17 Properties |
| 1995 | £49,604 | - |
11 Properties |
Property Price per Property Type in Dunsmore
Here you can find historic sold price data in order to help with your property search.
The average Property Paid Price for specific property types in the last three years are:
| Property Type | Average Sold Price | Sold Properties |
|---|---|---|
| Semi Detached House | £321,555.00 | 23 Semi Detached Houses |
| Detached House | £393,168.00 | 17 Detached Houses |
| Terraced House | £279,625.00 | 20 Terraced Houses |
| Flat | £103,500.00 | 1 Flat |

