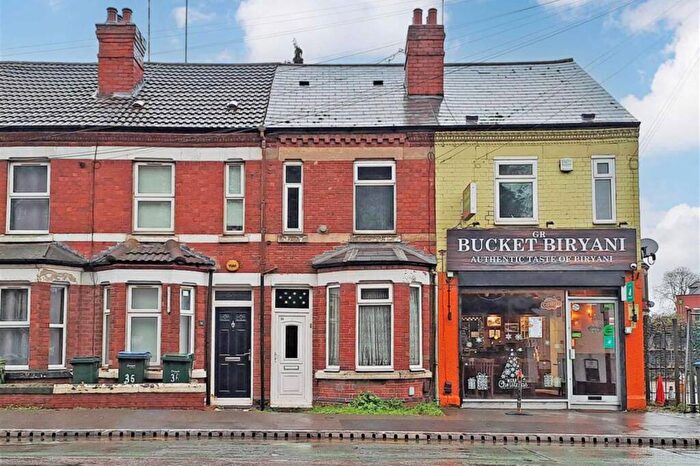
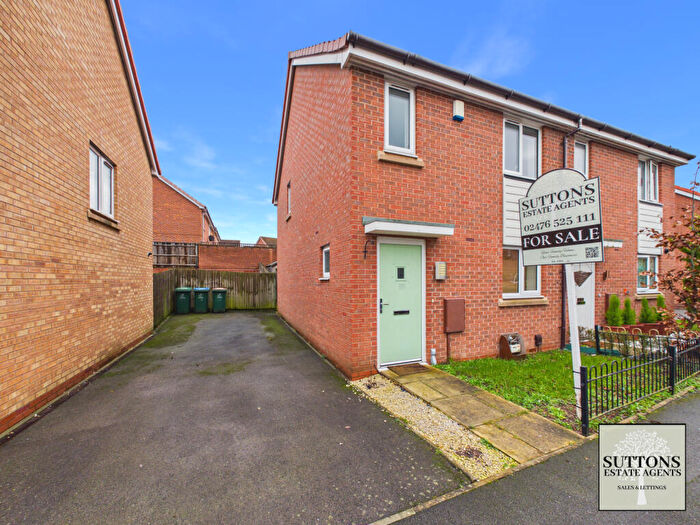
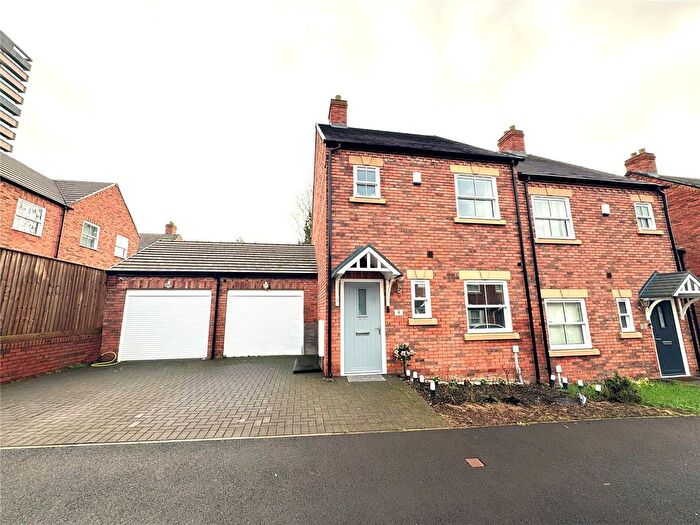
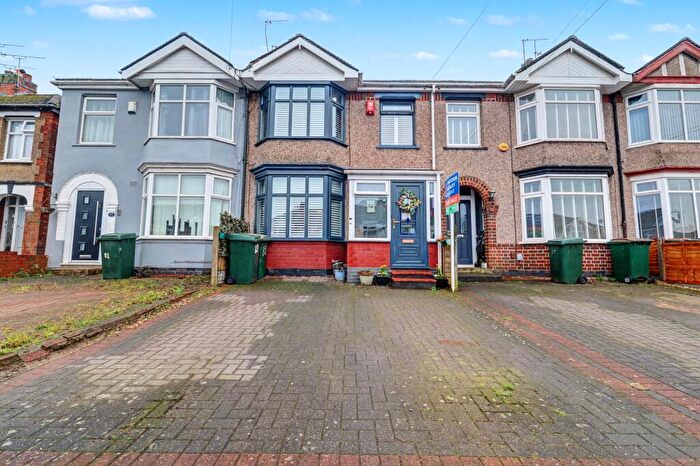
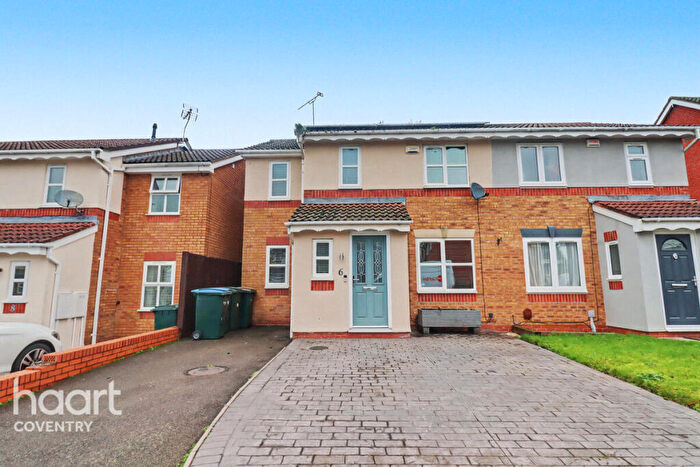
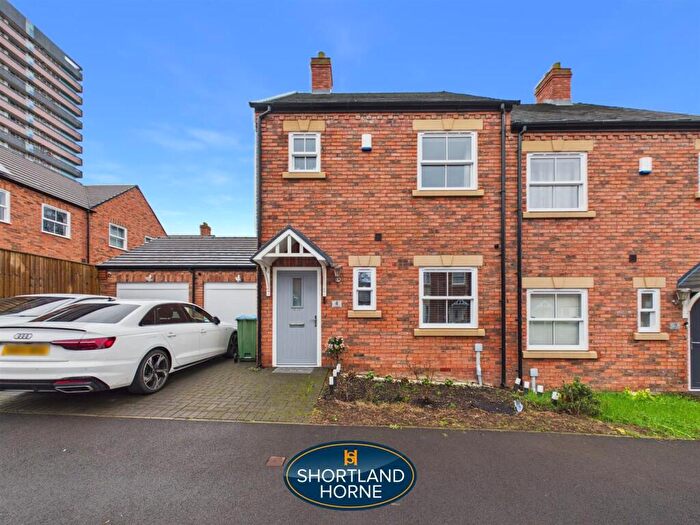
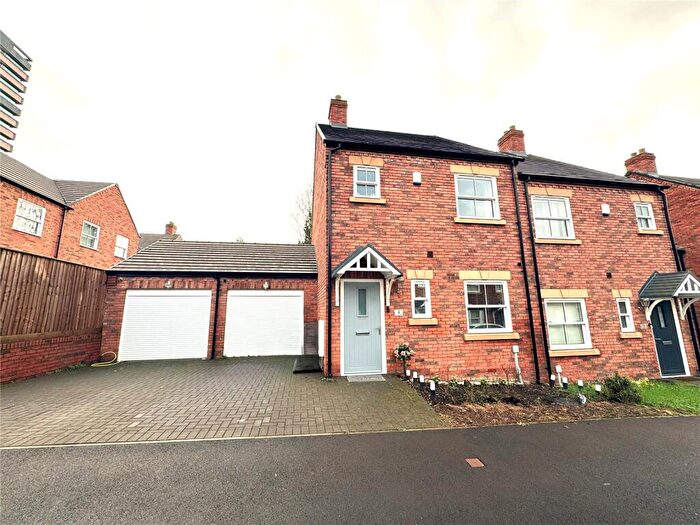
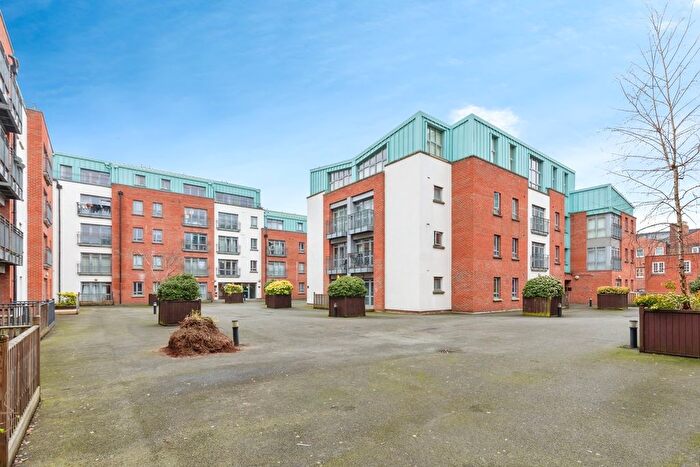
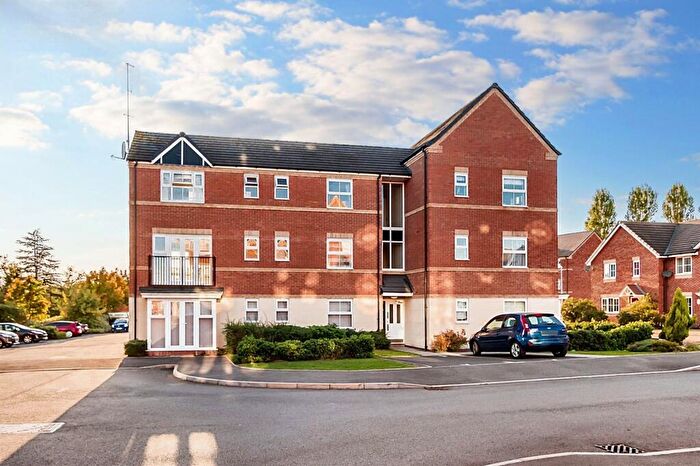
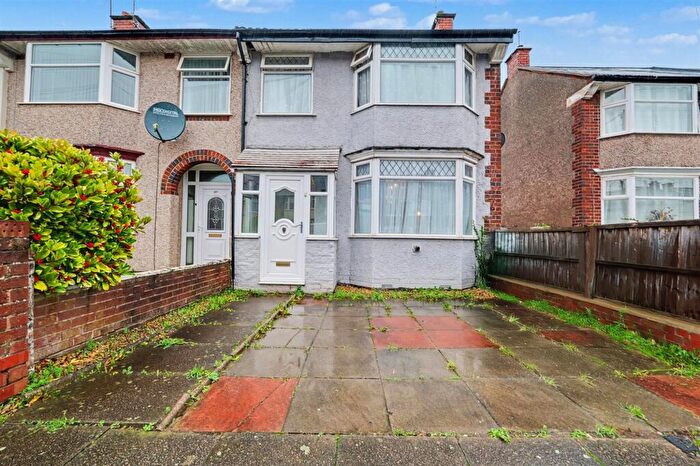
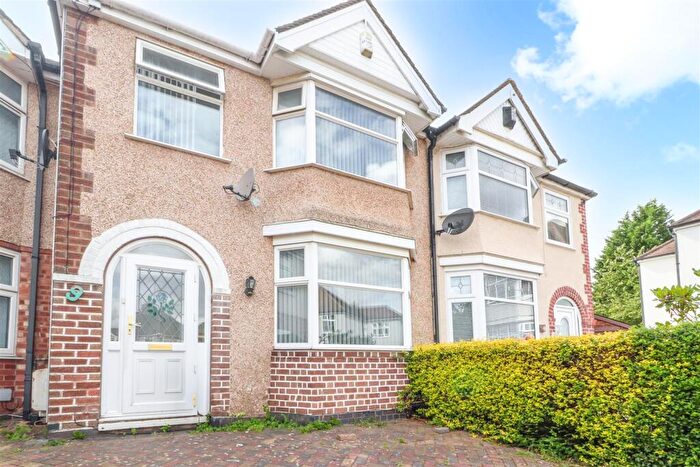
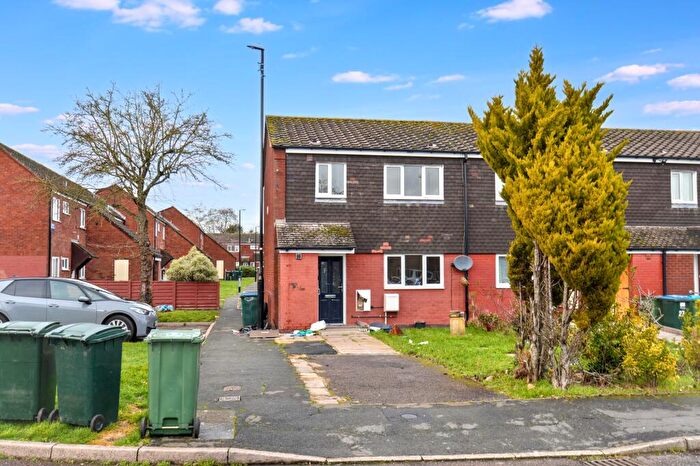
Houses for sale & to rent in Coventry, Warwickshire
House Prices in Coventry
Properties in Coventry have an average house price of £288,119.00 and had 1,053 Property Transactions within the last 3 years.¹
Coventry is an area in Warwickshire with 11,636 households², where the most expensive property was sold for £1,450,000.00.
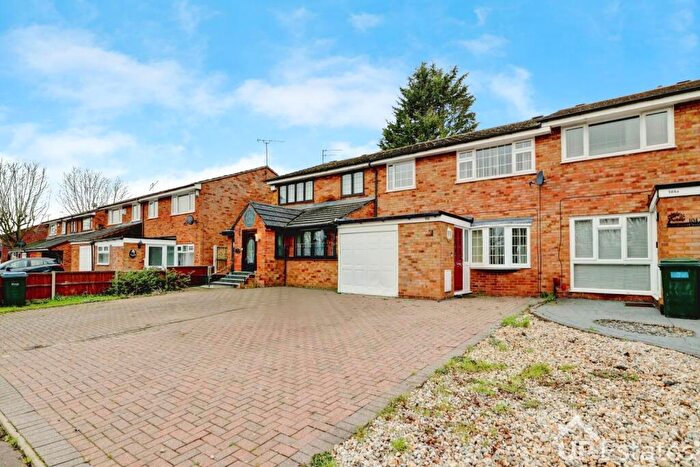
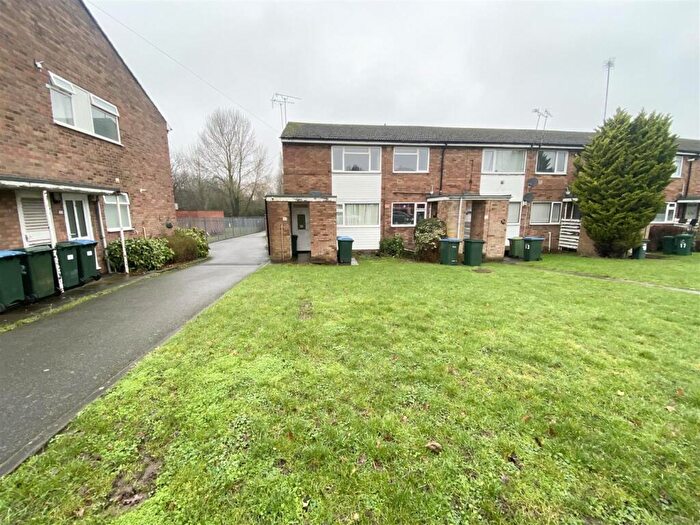
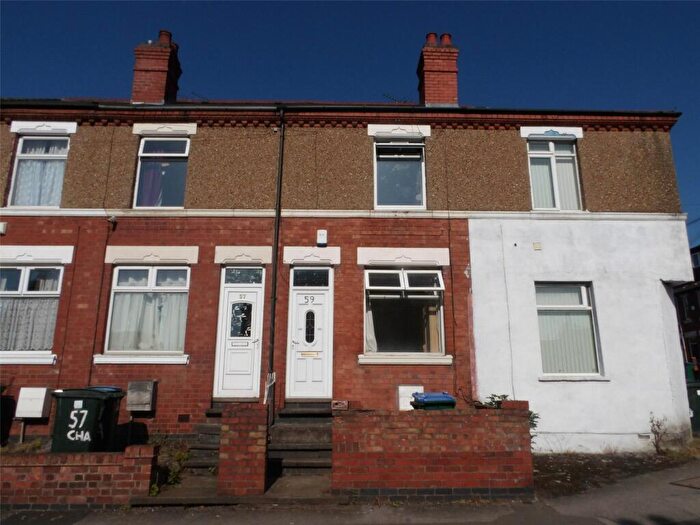
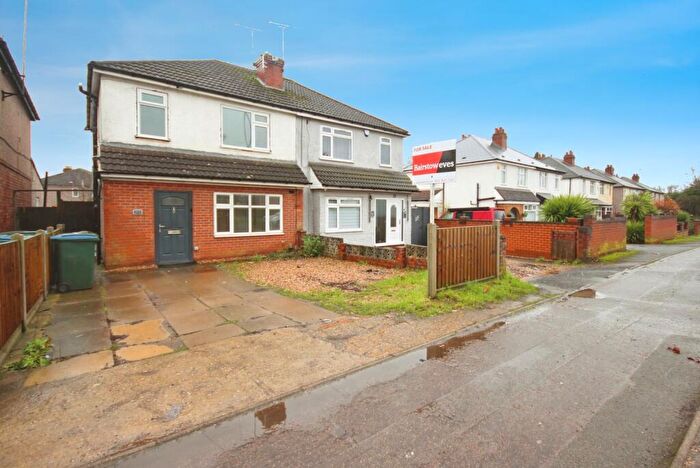
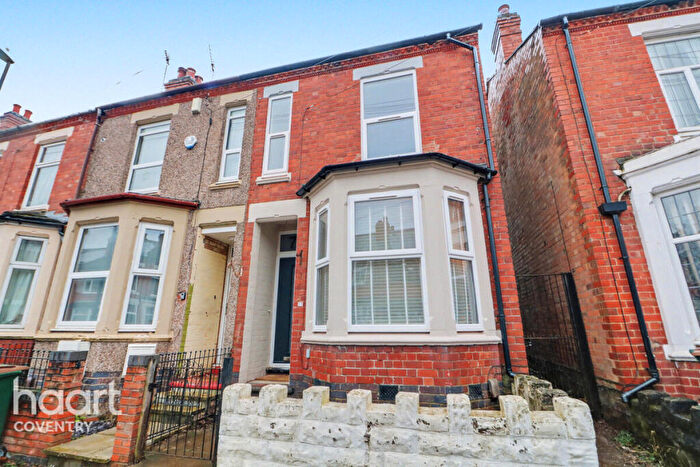
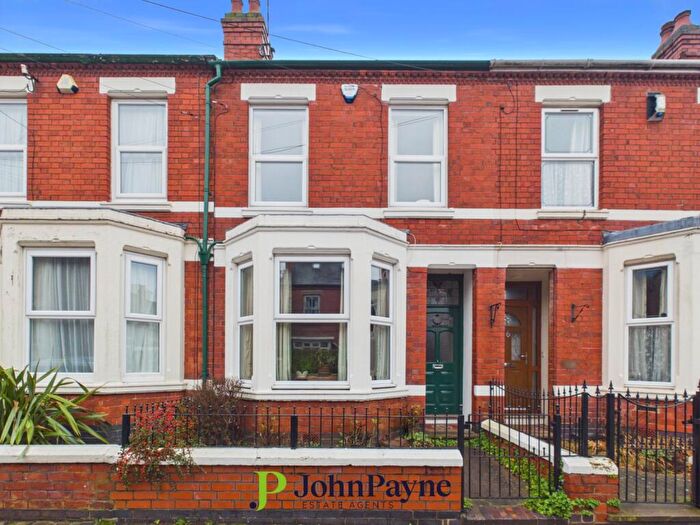
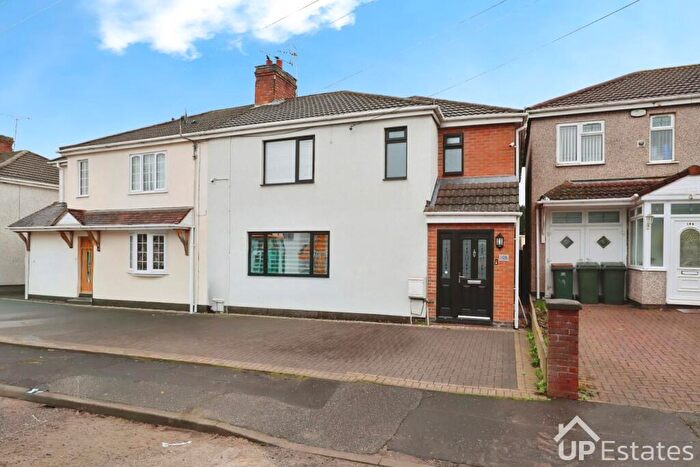
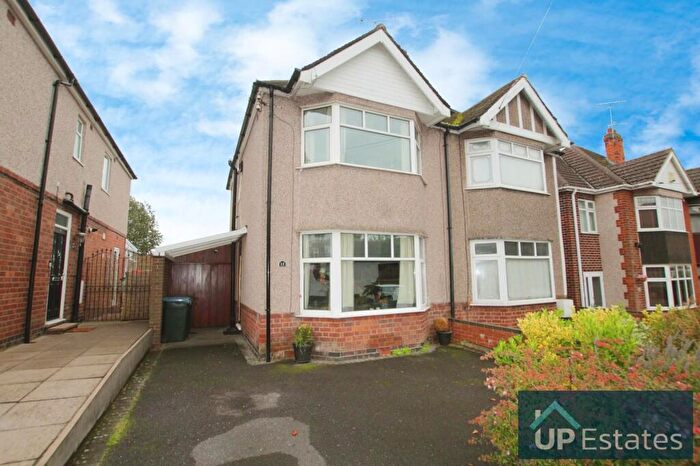
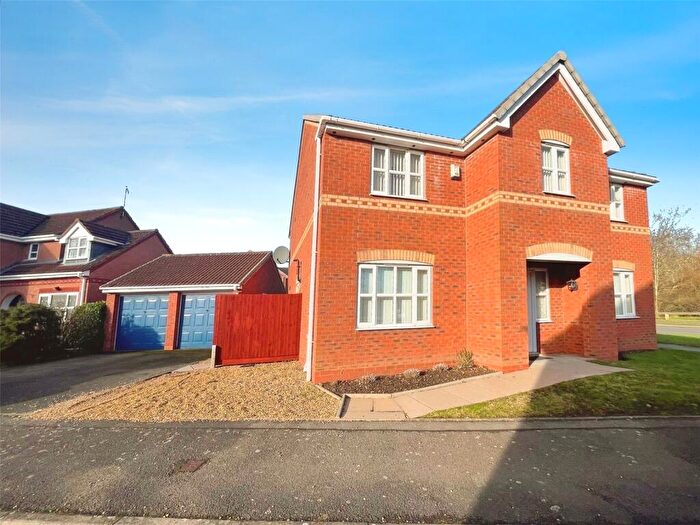
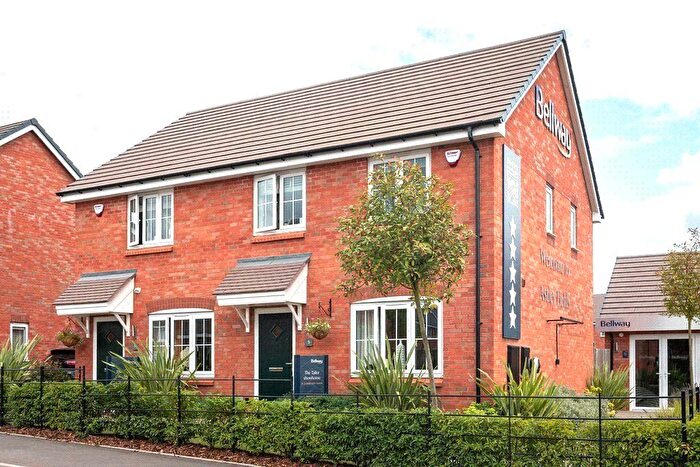
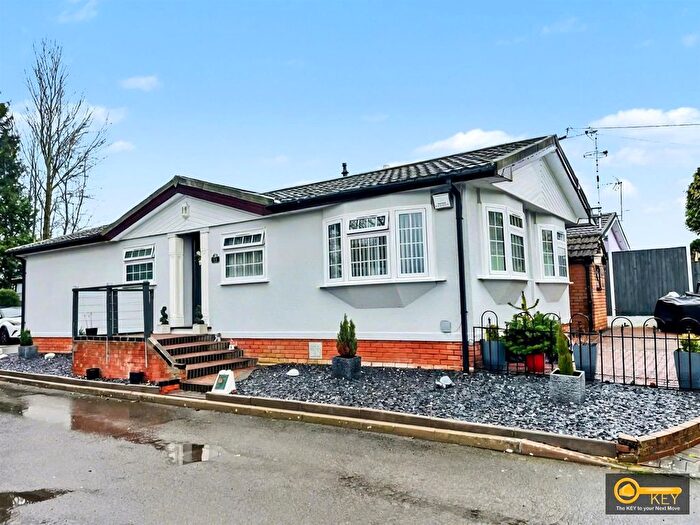
Properties for sale in Coventry
Neighbourhoods in Coventry
Navigate through our locations to find the location of your next house in Coventry, Warwickshire for sale or to rent.
Transport in Coventry
Please see below transportation links in this area:
- FAQ
- Price Paid By Year
- Property Type Price
Frequently asked questions about Coventry
What is the average price for a property for sale in Coventry?
The average price for a property for sale in Coventry is £288,119. This amount is 16% lower than the average price in Warwickshire. There are more than 10,000 property listings for sale in Coventry.
What locations have the most expensive properties for sale in Coventry?
The locations with the most expensive properties for sale in Coventry are Cubbington & Leek Wootton at an average of £1,450,000, Cubbington at an average of £523,339 and Abbey at an average of £494,483.
What locations have the most affordable properties for sale in Coventry?
The locations with the most affordable properties for sale in Coventry are Exhall at an average of £222,423, Arley And Whitacre at an average of £225,855 and Poplar at an average of £236,518.
Which train stations are available in or near Coventry?
Some of the train stations available in or near Coventry are Coventry Arena, Coventry and Canley.
Property Price Paid in Coventry by Year
The average sold property price by year was:
| Year | Average Sold Price | Price Change |
Sold Properties
|
|---|---|---|---|
| 2025 | £291,400 | 2% |
304 Properties |
| 2024 | £284,361 | -2% |
389 Properties |
| 2023 | £289,409 | -2% |
360 Properties |
| 2022 | £294,268 | 7% |
491 Properties |
| 2021 | £274,931 | -0,2% |
520 Properties |
| 2020 | £275,420 | 16% |
379 Properties |
| 2019 | £231,686 | -5% |
449 Properties |
| 2018 | £243,868 | 7% |
475 Properties |
| 2017 | £226,000 | 4% |
451 Properties |
| 2016 | £216,527 | 8% |
501 Properties |
| 2015 | £199,337 | -3% |
518 Properties |
| 2014 | £205,843 | 12% |
461 Properties |
| 2013 | £180,555 | -3% |
393 Properties |
| 2012 | £185,992 | 4% |
322 Properties |
| 2011 | £179,325 | -6% |
309 Properties |
| 2010 | £190,702 | 14% |
316 Properties |
| 2009 | £164,728 | -1% |
260 Properties |
| 2008 | £167,073 | -11% |
319 Properties |
| 2007 | £186,091 | 6% |
592 Properties |
| 2006 | £175,464 | 4% |
653 Properties |
| 2005 | £169,235 | 6% |
597 Properties |
| 2004 | £159,244 | 19% |
626 Properties |
| 2003 | £129,103 | 8% |
734 Properties |
| 2002 | £118,354 | 16% |
864 Properties |
| 2001 | £99,969 | -0,1% |
625 Properties |
| 2000 | £100,037 | 17% |
665 Properties |
| 1999 | £82,579 | 17% |
613 Properties |
| 1998 | £68,819 | -1% |
474 Properties |
| 1997 | £69,178 | 6% |
427 Properties |
| 1996 | £65,029 | 6% |
365 Properties |
| 1995 | £61,118 | - |
289 Properties |
Property Price per Property Type in Coventry
Here you can find historic sold price data in order to help with your property search.
The average Property Paid Price for specific property types in the last three years are:
| Property Type | Average Sold Price | Sold Properties |
|---|---|---|
| Semi Detached House | £255,299.00 | 415 Semi Detached Houses |
| Detached House | £439,865.00 | 295 Detached Houses |
| Terraced House | £212,189.00 | 275 Terraced Houses |
| Flat | £137,174.00 | 68 Flats |

