Houses for sale & to rent in St Johns, Kenilworth
House Prices in St Johns
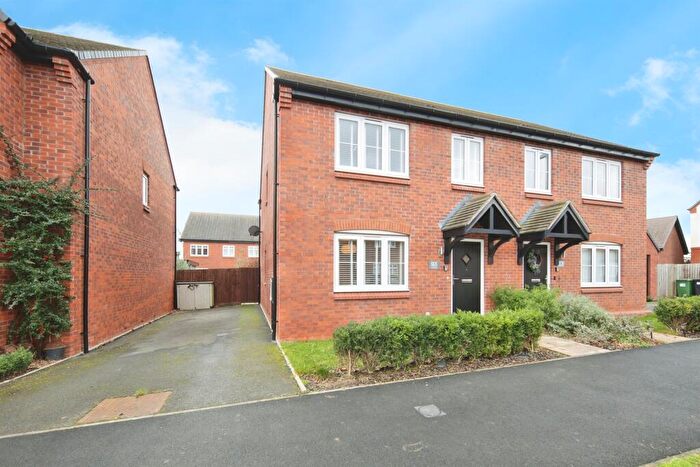
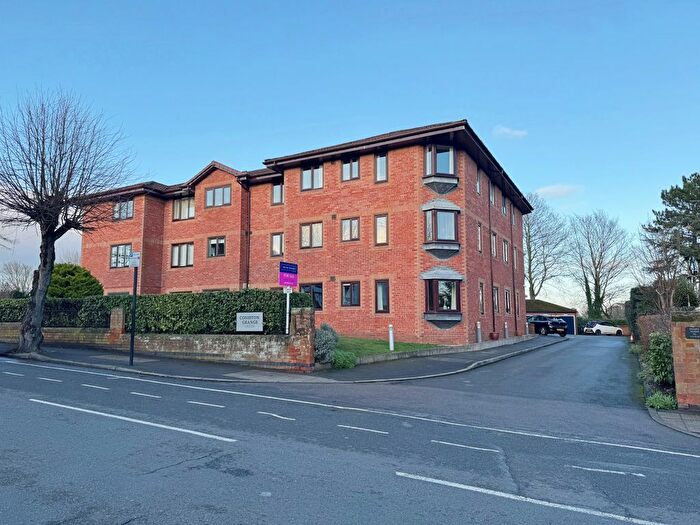
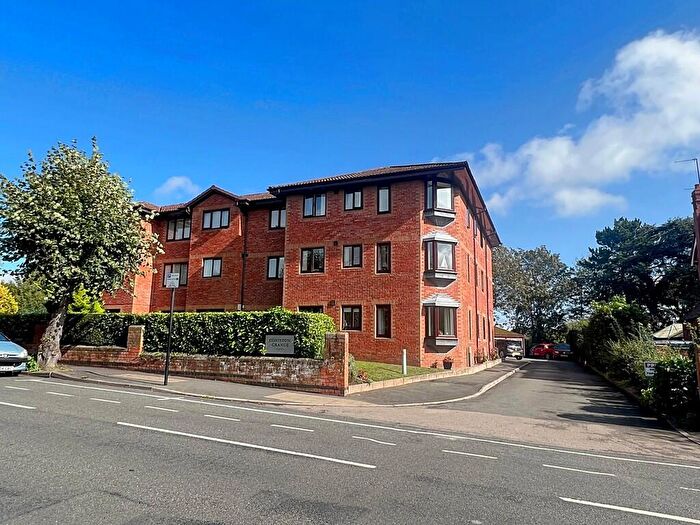
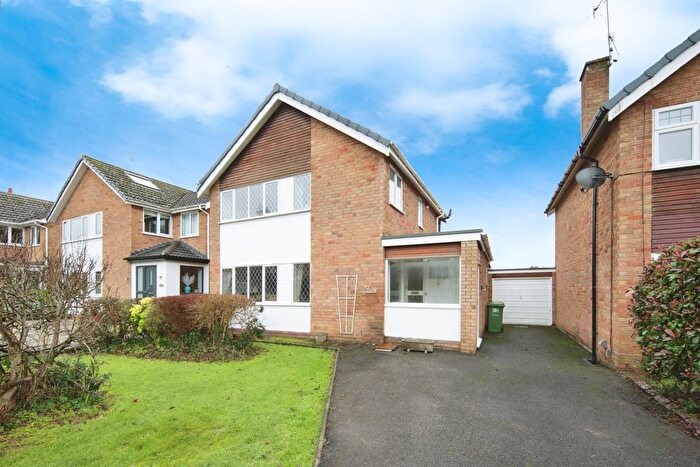
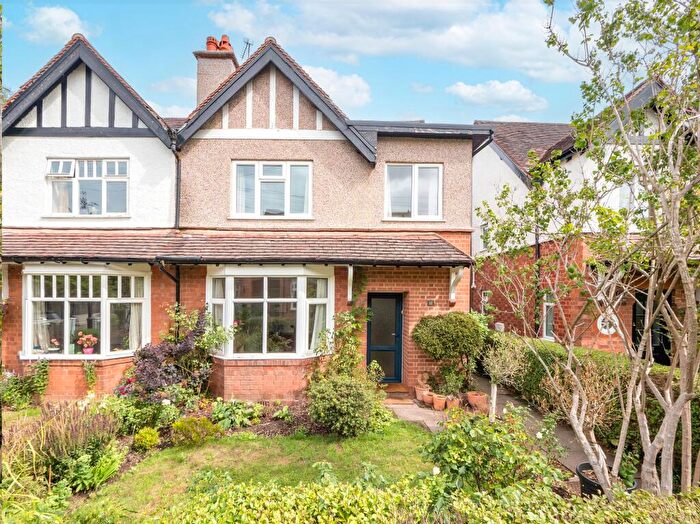
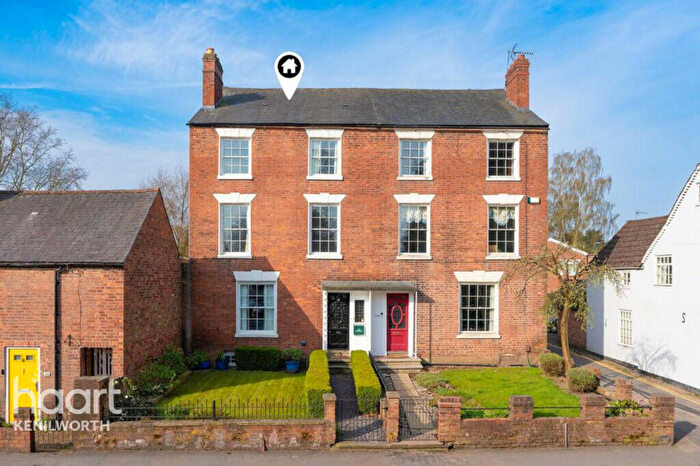
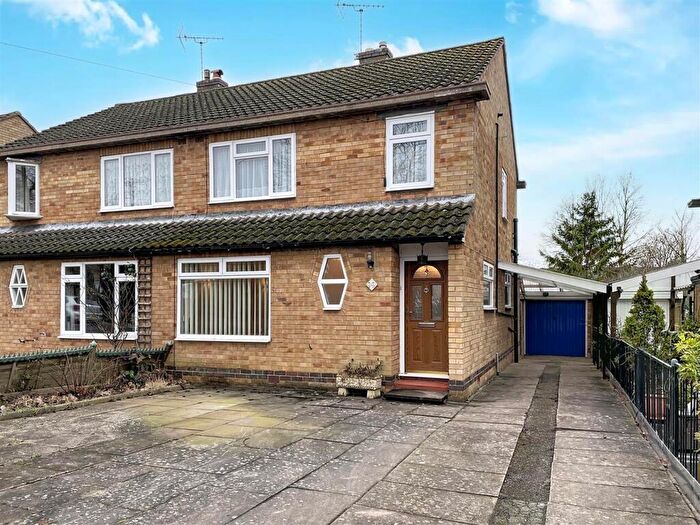
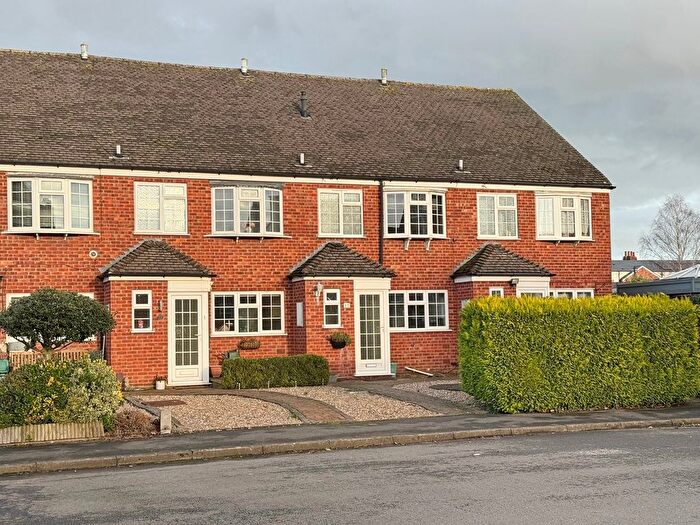
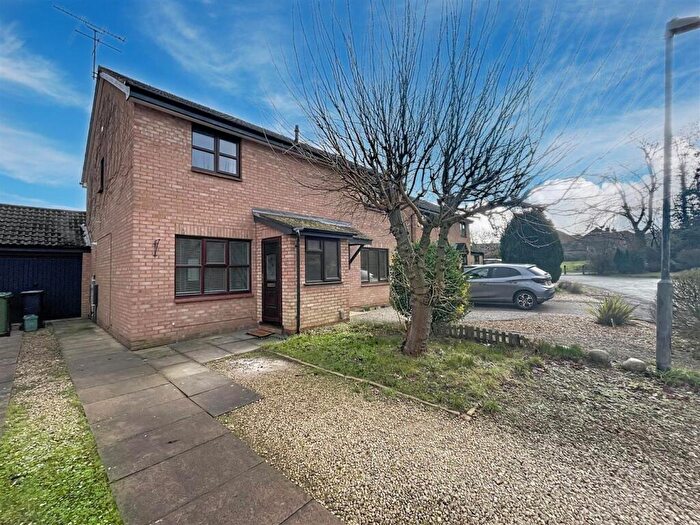
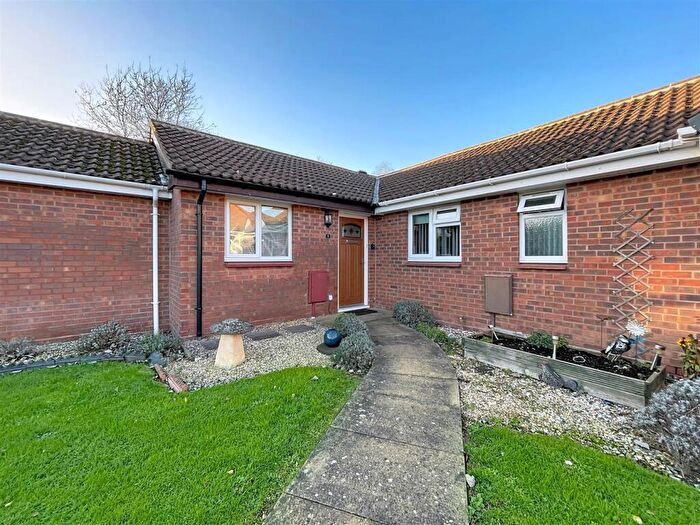
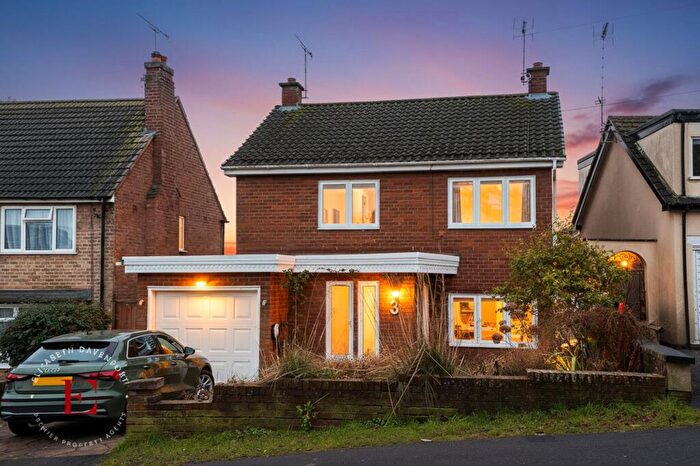
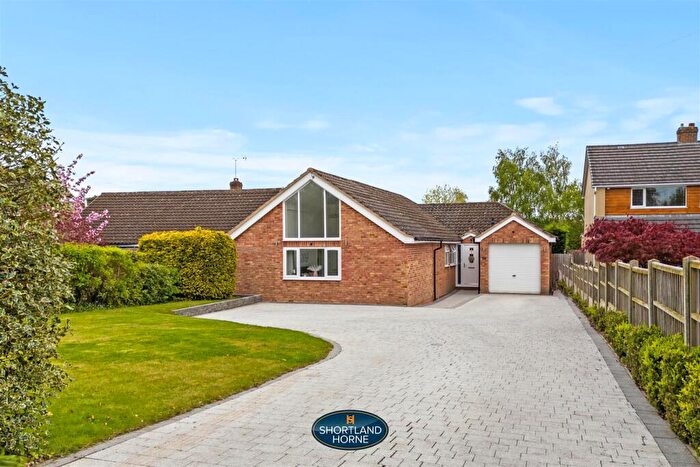
Properties in St Johns have an average house price of £455,744.00 and had 274 Property Transactions within the last 3 years¹.
St Johns is an area in Kenilworth, Warwickshire with 3,192 households², where the most expensive property was sold for £1,100,000.00.
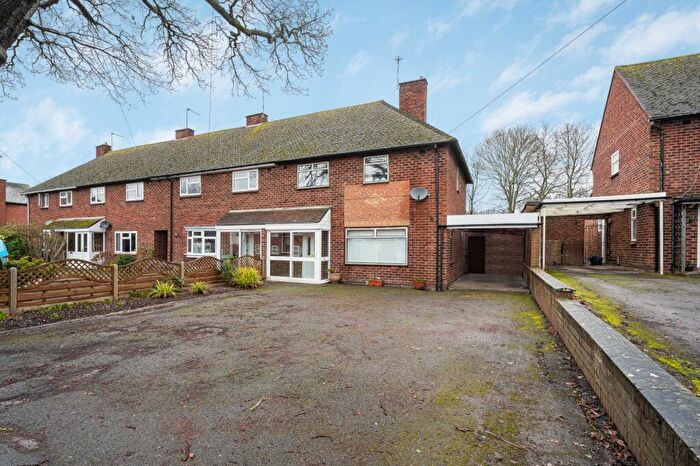
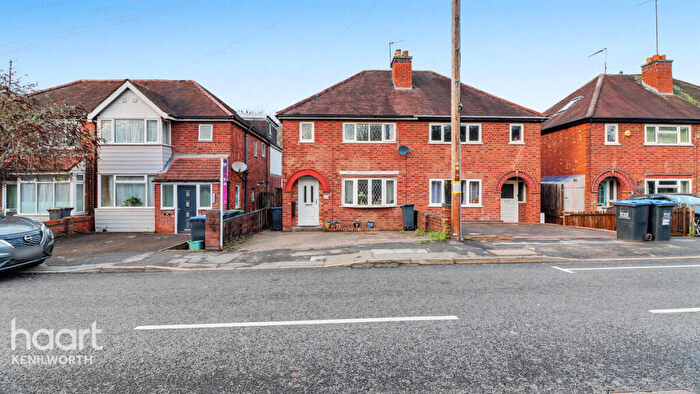
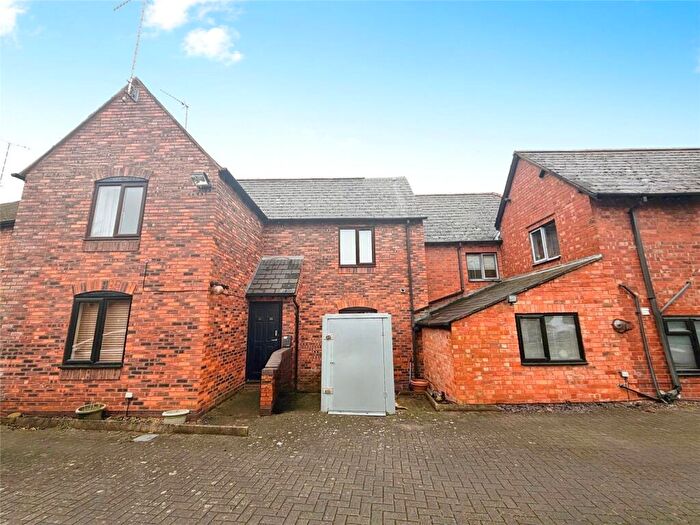
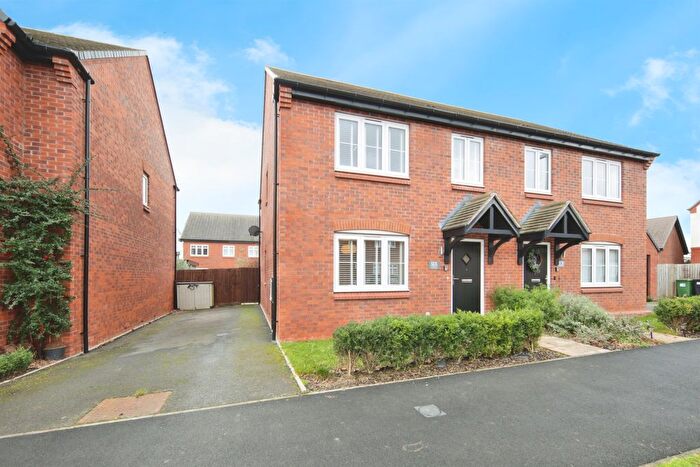
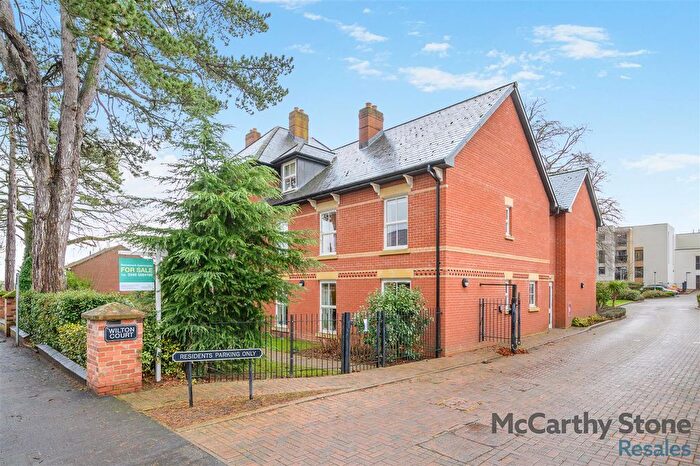
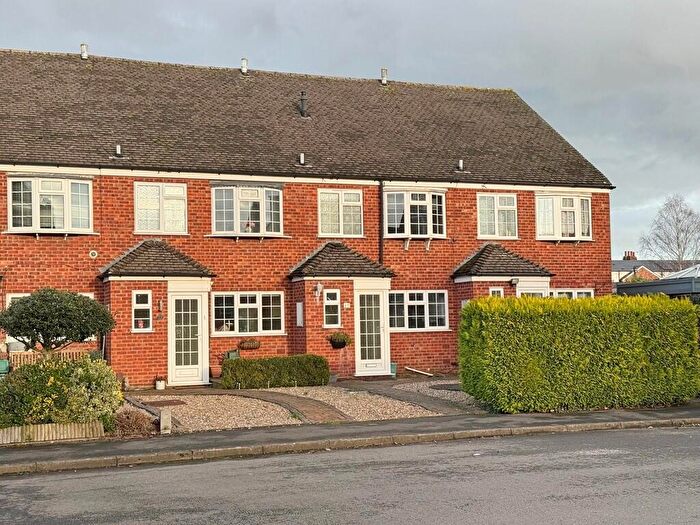
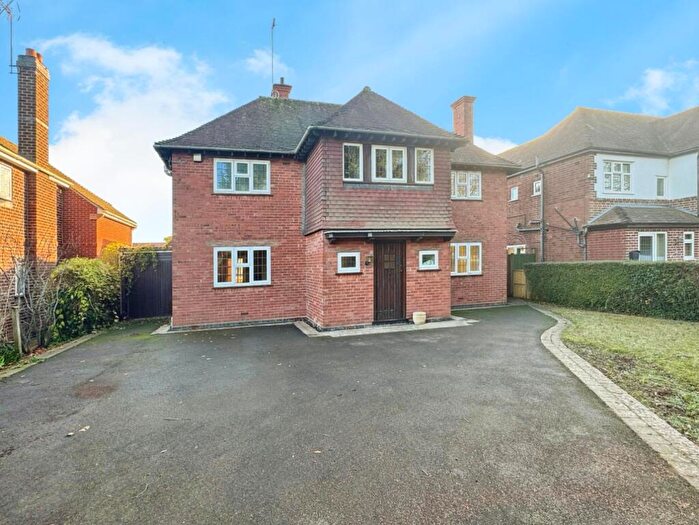
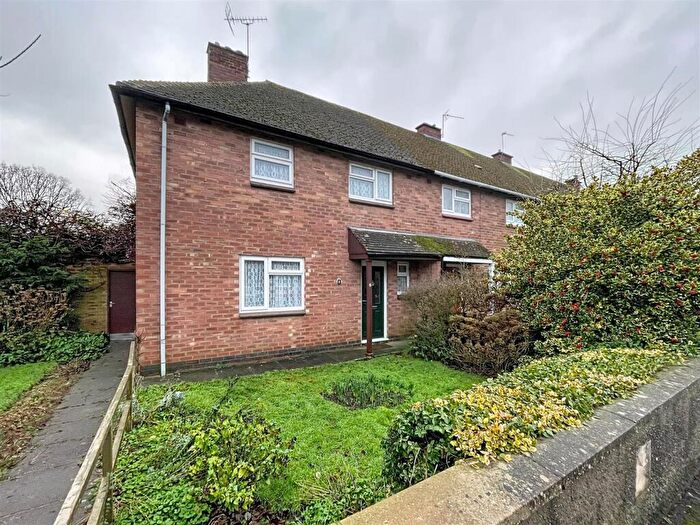
Properties for sale in St Johns
Roads and Postcodes in St Johns
Navigate through our locations to find the location of your next house in St Johns, Kenilworth for sale or to rent.
| Streets | Postcodes |
|---|---|
| Archer Road | CV8 1DJ |
| Arden Road | CV8 2DU |
| Ash Drive | CV8 2DQ |
| Ashfield Road | CV8 2BE |
| Avon Road | CV8 1DH |
| Beauchamp Road | CV8 1GH CV8 1GJ |
| Beechwood Croft | CV8 1GX |
| Birches Lane | CV8 2AB CV8 2AD CV8 2AG |
| Blackthorn Road | CV8 2DS |
| Brooke Road | CV8 2BD |
| Bullimore Grove | CV8 2QF |
| Caesar Road | CV8 1DL CV8 1DP |
| Chestnut Avenue | CV8 1GD |
| Clarendon Mews | CV8 1HQ |
| Clarendon Road | CV8 1HZ |
| Clarkes Avenue | CV8 1HX |
| Drew Crescent | CV8 1RD |
| Dryden Close | CV8 1RY |
| Dudley Road | CV8 1GP CV8 1GQ CV8 1GR |
| Ebourne Close | CV8 2QG CV8 2QL |
| Eden Croft | CV8 2BG |
| Elmdene Road | CV8 2BW CV8 2BX |
| Essex Close | CV8 1GS |
| Faircroft | CV8 1JT |
| Farm Road | CV8 1DX |
| Farmer Ward Road | CV8 2DH CV8 2DJ CV8 2DL CV8 2DN |
| Ferndale Drive | CV8 2PF |
| Fishponds Road | CV8 1EX CV8 1EY CV8 1EZ |
| Gardner Way | CV8 1QW |
| Glebe Crescent | CV8 1JA |
| Grafton Close | CV8 1HA |
| Guy Road | CV8 1FX CV8 1FY |
| Hermitage Way | CV8 2DW |
| John Nash Square | CV8 1RJ |
| John Ogaunt Road | CV8 1DY CV8 1DZ |
| Jordan Close | CV8 2AE |
| Laburnum Avenue | CV8 2DR |
| Lancaster Place | CV8 1GL |
| Latimer Close | CV8 1GN |
| Leamington Road | CV8 2AA |
| Leycester Road | CV8 1FZ |
| Lime Grove | CV8 2DP |
| Lindsey Crescent | CV8 1FL |
| Lockhart Close | CV8 1RB |
| Lunn Avenue | CV8 1DS |
| Mayo Drive | CV8 2QQ |
| Moorlands Avenue | CV8 1HR CV8 1RT CV8 1RZ |
| Mortimer Road | CV8 1FR CV8 1FS |
| Moseley Road | CV8 2AQ CV8 2AR |
| Newey Drive | CV8 1QS |
| Oaks Road | CV8 1GE CV8 1GF |
| Percy Crescent | CV8 1DT |
| Percy Road | CV8 1DQ CV8 1DR |
| Queens Close | CV8 1JR |
| Regency Drive | CV8 1JE |
| Roseland Road | CV8 1GA CV8 1GB |
| Rouncil Lane | CV8 1FF CV8 1FN CV8 1FP CV8 1FQ CV8 1NL CV8 1NN |
| Rounds Hill | CV8 1DU CV8 1DW |
| Scott Road | CV8 1GG |
| Siddeley Avenue | CV8 1EW |
| Sovereign Close | CV8 1SQ |
| St Johns Avenue | CV8 1FW |
| St Johns Street | CV8 1FT |
| St Nicholas Avenue | CV8 1JU CV8 1JW |
| Suncliffe Drive | CV8 1FH |
| Sunningdale Avenue | CV8 2BY CV8 2BZ |
| Sunshine Close | CV8 1FJ |
| Swift Close | CV8 1QT |
| The Conifers | CV8 2BF |
| The Gardens | CV8 2DX |
| The Mews | CV8 1DN |
| Thickthorn Close | CV8 2AF |
| Thickthorn Mews | CV8 2SQ |
| Thickthorn Orchards | CV8 2SH |
| Thornby Avenue | CV8 2DT CV8 2DY |
| Towers Close | CV8 1FG |
| Vicarage Gardens | CV8 1QQ |
| Walkers Way | CV8 1RG |
| Walnut Tree Close | CV8 2NF |
| Warwick Road | CV8 1FB CV8 1FD CV8 1HL CV8 1HP CV8 1HS CV8 1HU CV8 1HY |
| Waverley Road | CV8 1JL |
| Whitemoor Road | CV8 2BP |
| Whites Row | CV8 1HW |
| Willoughby Avenue | CV8 1DG |
| Worcester Road | CV8 2AP |
Transport near St Johns
-
Warwick Station
-
Warwick Parkway Station
-
Leamington Spa Station
-
Tile Hill Station
-
Canley Station
-
Berkswell Station
- FAQ
- Price Paid By Year
- Property Type Price
Frequently asked questions about St Johns
What is the average price for a property for sale in St Johns?
The average price for a property for sale in St Johns is £455,744. This amount is 6% higher than the average price in Kenilworth. There are 2,287 property listings for sale in St Johns.
What streets have the most expensive properties for sale in St Johns?
The streets with the most expensive properties for sale in St Johns are The Conifers at an average of £1,100,000, Sovereign Close at an average of £909,000 and Birches Lane at an average of £904,500.
What streets have the most affordable properties for sale in St Johns?
The streets with the most affordable properties for sale in St Johns are Drew Crescent at an average of £105,000, Ebourne Close at an average of £123,900 and Clarendon Mews at an average of £264,000.
Which train stations are available in or near St Johns?
Some of the train stations available in or near St Johns are Warwick, Warwick Parkway and Leamington Spa.
Property Price Paid in St Johns by Year
The average sold property price by year was:
| Year | Average Sold Price | Price Change |
Sold Properties
|
|---|---|---|---|
| 2025 | £460,482 | 4% |
97 Properties |
| 2024 | £443,325 | -5% |
97 Properties |
| 2023 | £465,056 | 5% |
80 Properties |
| 2022 | £442,538 | 8% |
102 Properties |
| 2021 | £407,790 | -5% |
161 Properties |
| 2020 | £427,597 | 13% |
105 Properties |
| 2019 | £372,024 | -5% |
109 Properties |
| 2018 | £391,156 | 7% |
125 Properties |
| 2017 | £364,708 | 2% |
125 Properties |
| 2016 | £358,595 | 17% |
107 Properties |
| 2015 | £299,228 | 3% |
120 Properties |
| 2014 | £290,011 | 13% |
138 Properties |
| 2013 | £252,742 | -9% |
137 Properties |
| 2012 | £274,349 | -5% |
113 Properties |
| 2011 | £288,185 | 5% |
110 Properties |
| 2010 | £273,685 | 13% |
91 Properties |
| 2009 | £236,866 | -5% |
113 Properties |
| 2008 | £249,800 | -3% |
75 Properties |
| 2007 | £258,468 | 5% |
137 Properties |
| 2006 | £245,785 | 3% |
139 Properties |
| 2005 | £238,176 | 4% |
124 Properties |
| 2004 | £229,154 | 10% |
153 Properties |
| 2003 | £205,633 | 14% |
146 Properties |
| 2002 | £177,433 | 22% |
206 Properties |
| 2001 | £138,573 | 6% |
169 Properties |
| 2000 | £129,670 | 7% |
133 Properties |
| 1999 | £121,013 | -7% |
181 Properties |
| 1998 | £129,636 | 29% |
165 Properties |
| 1997 | £91,472 | 2% |
142 Properties |
| 1996 | £89,838 | 5% |
151 Properties |
| 1995 | £85,399 | - |
135 Properties |
Property Price per Property Type in St Johns
Here you can find historic sold price data in order to help with your property search.
The average Property Paid Price for specific property types in the last three years are:
| Property Type | Average Sold Price | Sold Properties |
|---|---|---|
| Semi Detached House | £427,282.00 | 106 Semi Detached Houses |
| Detached House | £627,457.00 | 89 Detached Houses |
| Terraced House | £369,452.00 | 51 Terraced Houses |
| Flat | £174,860.00 | 28 Flats |

