
Houses for sale & to rent in Kenilworth, Warwickshire
House Prices in Kenilworth
Properties in Kenilworth have an average house price of £427k and had 1,110 Property Transactions within the last 3 years.¹
Kenilworth is an area in Warwickshire with 10,516 households², where the most expensive property was sold for £2.6M.
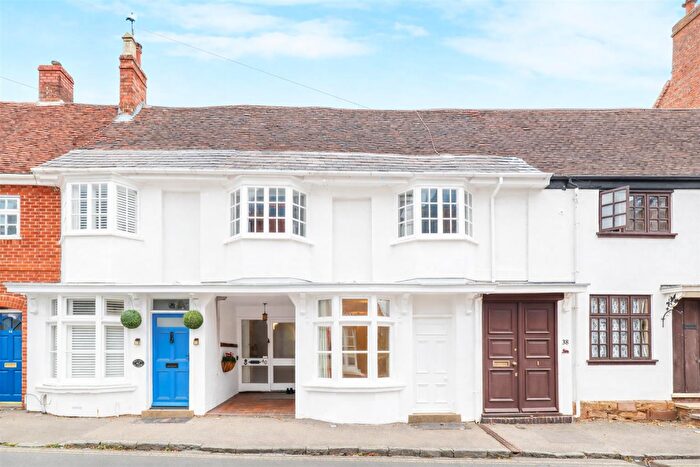
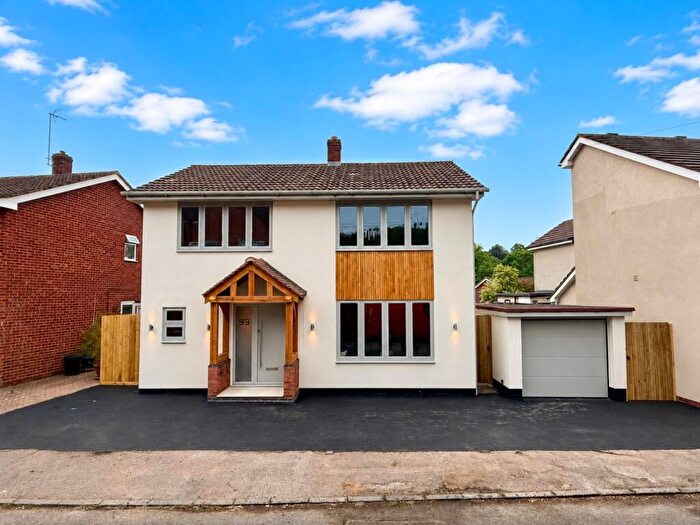
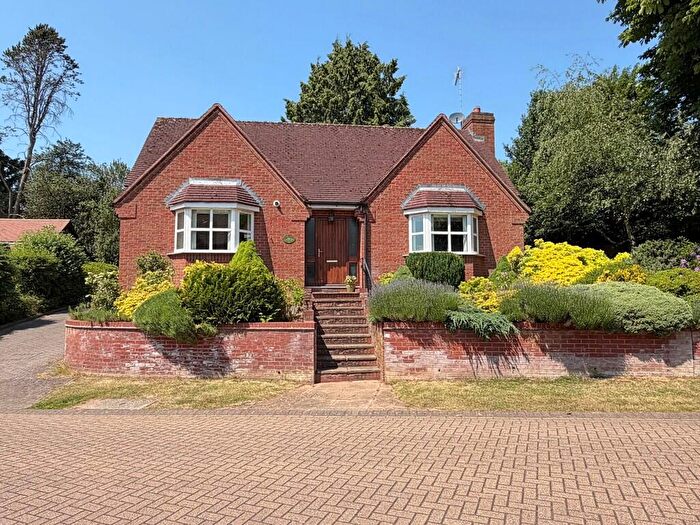
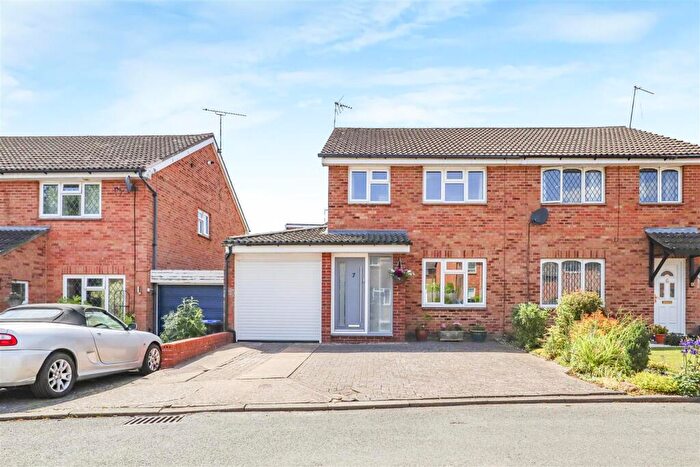
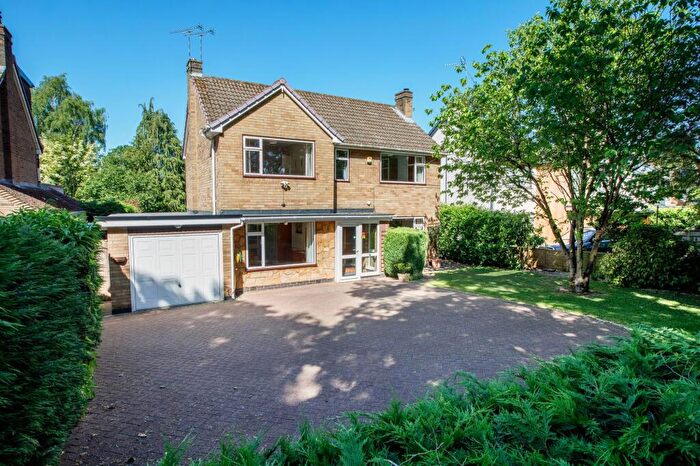
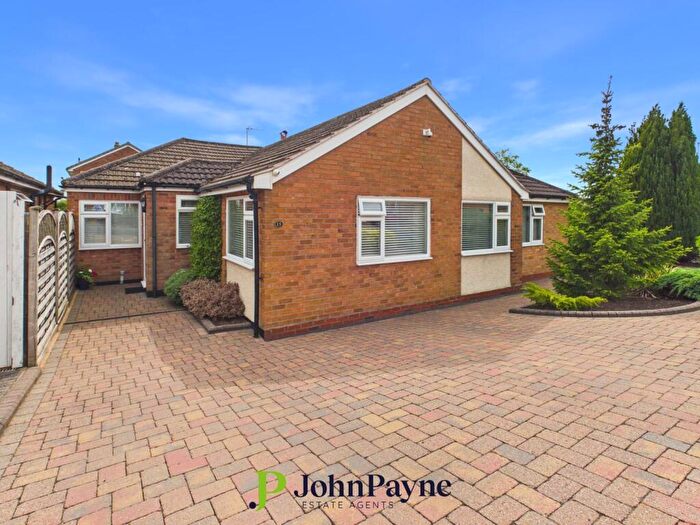
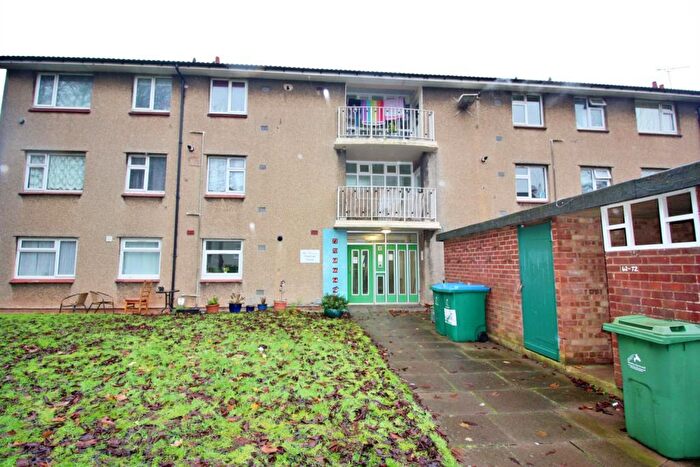
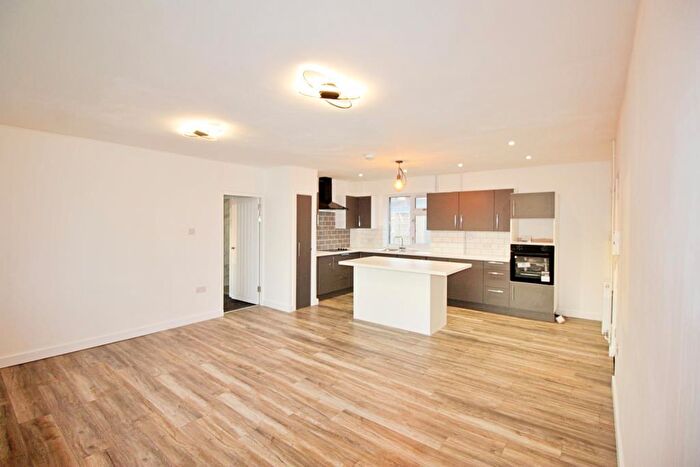
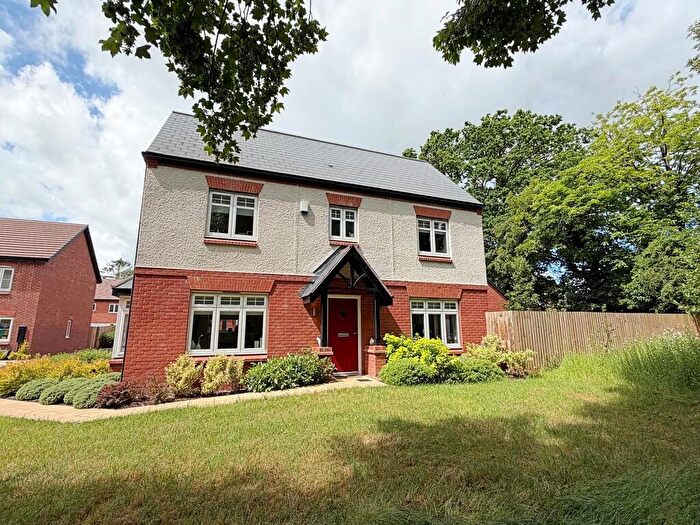
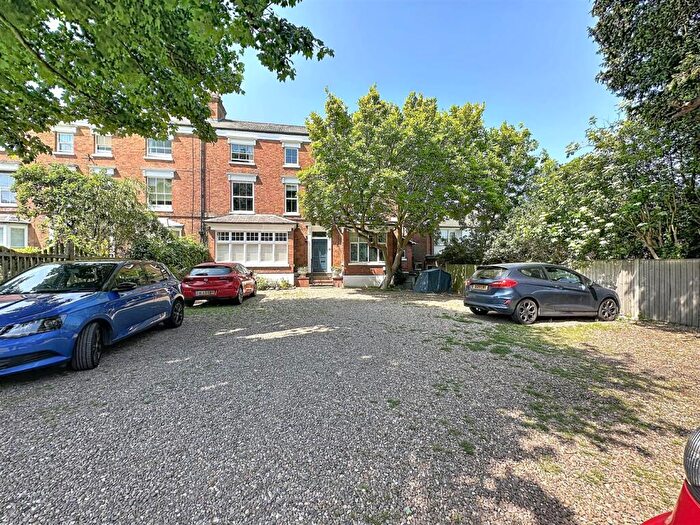
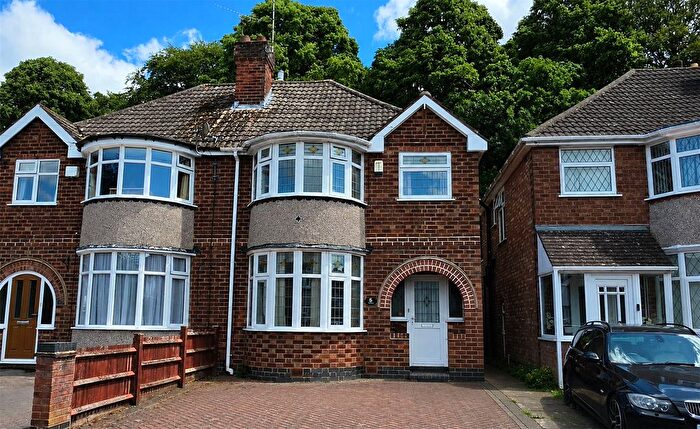
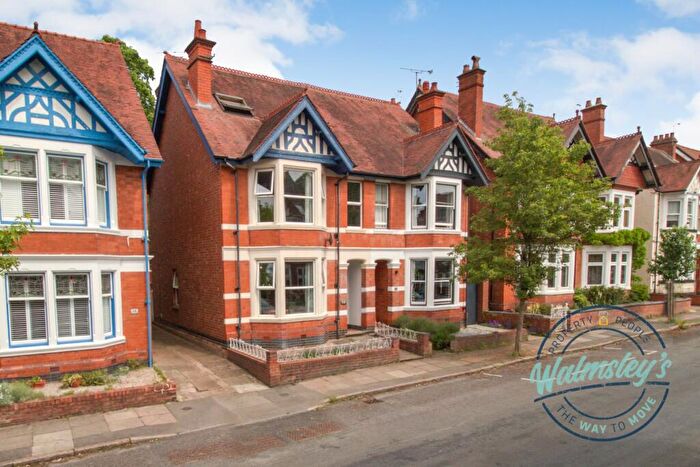
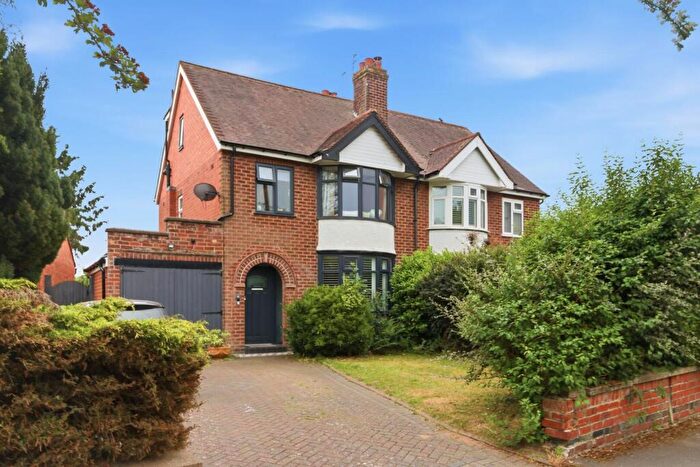
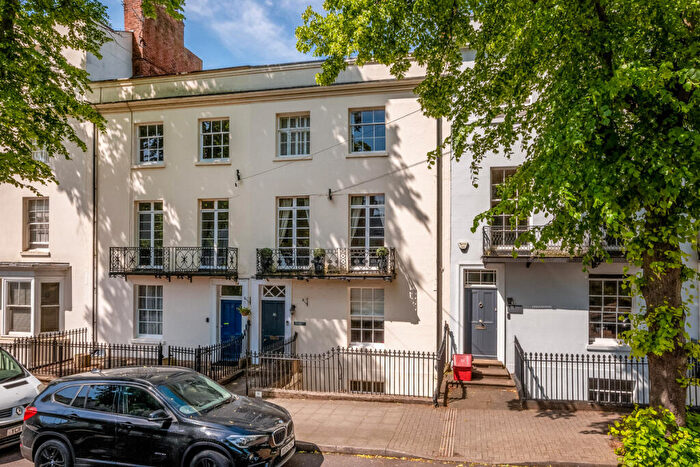
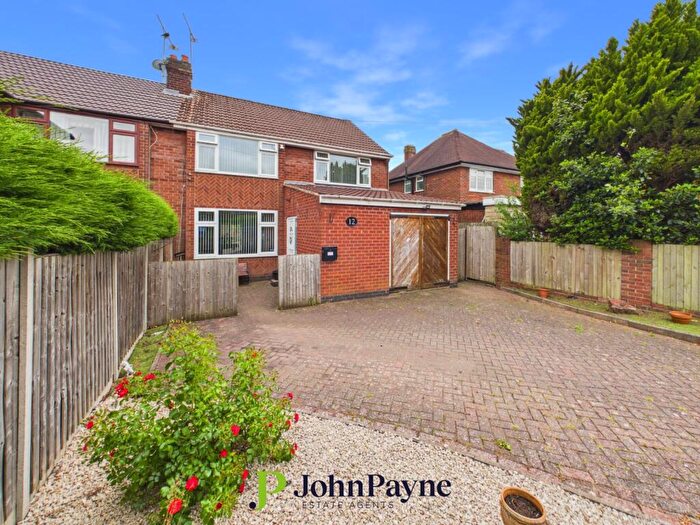
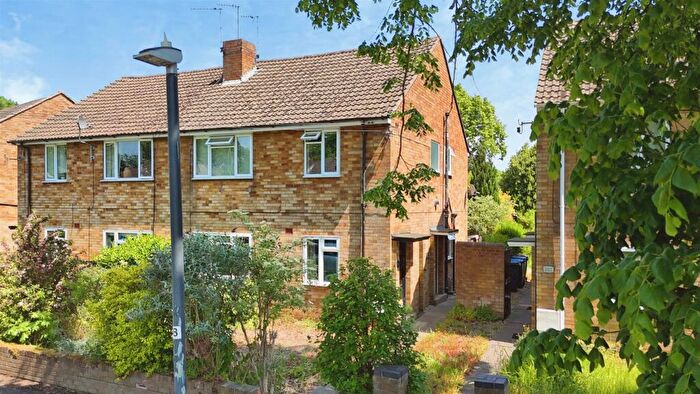
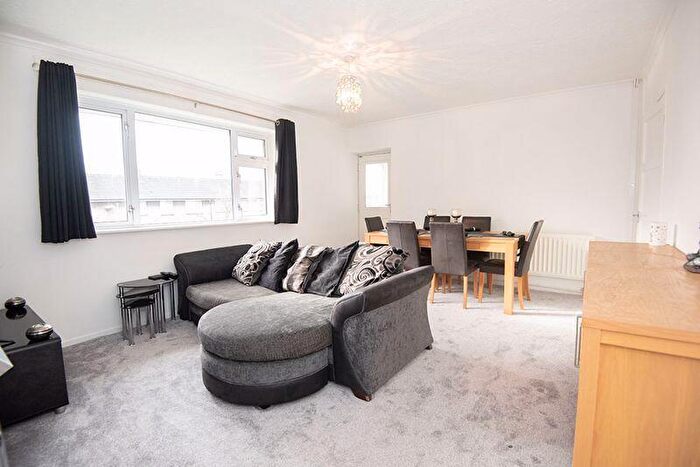
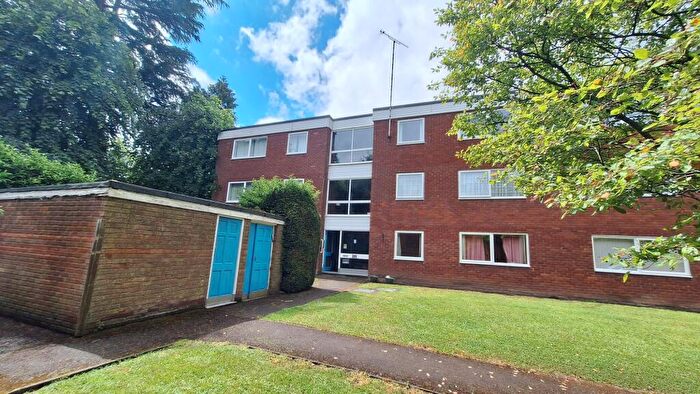
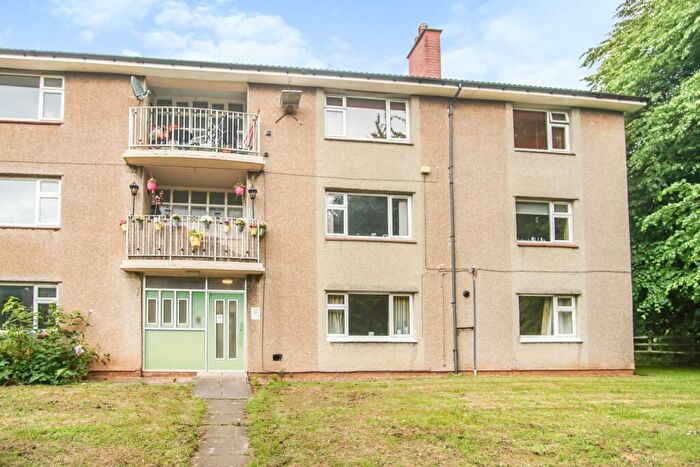
Properties for sale in Kenilworth
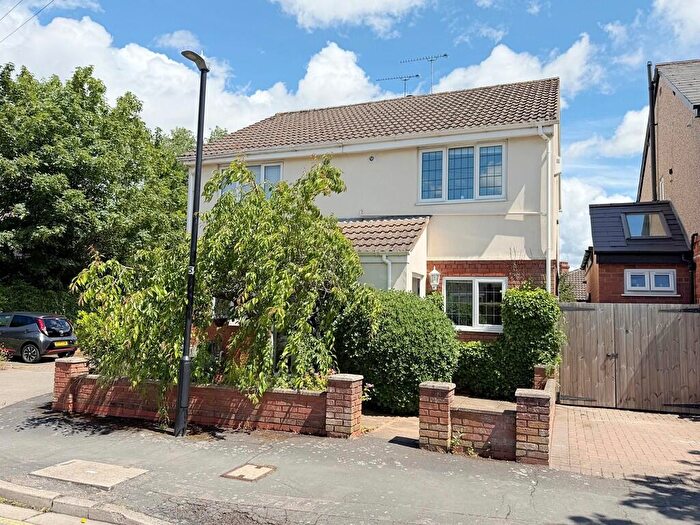
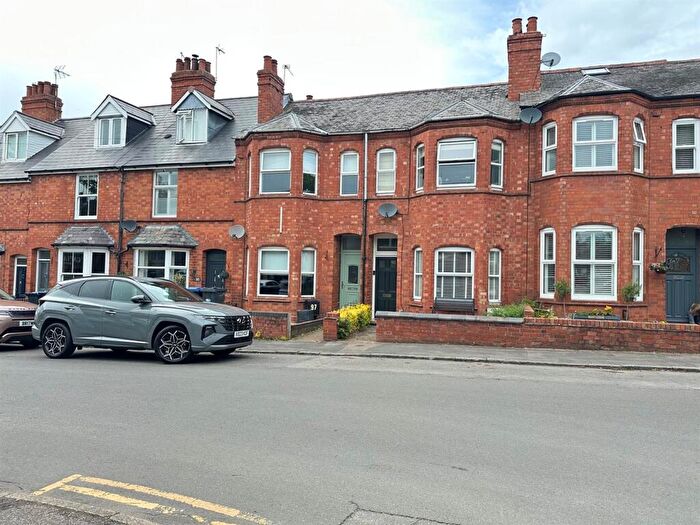
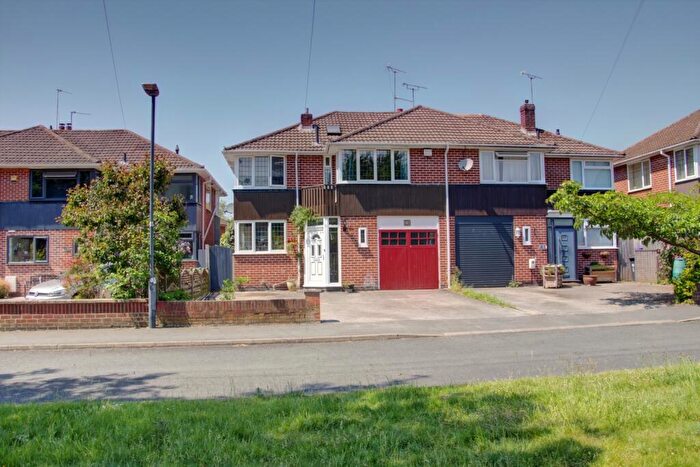
![]()
If you are looking to sell your house, let it out, or receive a property valuation, an expert can help you.
Click the button below to get started.


Neighbourhoods in Kenilworth
Navigate through our locations to find the location of your next house in Kenilworth, Warwickshire for sale or to rent.
Transport in Kenilworth
Please see below transportation links in this area:
-
 Tile Hill Station
 -
Canley Station
-
Warwick Station
-
Warwick Parkway Station
-
Coventry Station
-
Berkswell Station
-
Leamington Spa Station
- FAQ
- Price Paid By Year
- Property Type Price
Frequently asked questions about Kenilworth
What is the average price for a property for sale in Kenilworth?
The average price for a property for sale in Kenilworth is £427,027. This amount is 24% higher than the average price in Warwickshire. There are more than 10,000 property listings for sale in Kenilworth.
What locations have the most expensive properties for sale in Kenilworth?
The locations with the most expensive properties for sale in Kenilworth are Stoneleigh at an average of £868,227, Kenilworth Park Hill at an average of £510,000 and St Johns at an average of £453,566.
What locations have the most affordable properties for sale in Kenilworth?
The locations with the most affordable properties for sale in Kenilworth are Kenilworth St John's at an average of £284,636, Kenilworth Abbey & Arden at an average of £398,722 and Abbey at an average of £408,243.
Which train stations are available in or near Kenilworth?
Some of the train stations available in or near Kenilworth are Tile Hill, Canley and Warwick.
Property Price Paid in Kenilworth by Year
The average sold property price by year was:
| Year | Average Sold Price | Price Change |
Sold Properties
|
|---|---|---|---|
| 2026 | £421,347 | -3% |
21 Properties |
| 2025 | £432,989 | 1% |
399 Properties |
| 2024 | £428,288 | 2% |
371 Properties |
| 2023 | £418,476 | -4% |
319 Properties |
| 2022 | £433,551 | 4% |
383 Properties |
| 2021 | £418,129 | 3% |
580 Properties |
| 2020 | £403,681 | 7% |
378 Properties |
| 2019 | £374,730 | -4% |
418 Properties |
| 2018 | £390,971 | 5% |
437 Properties |
| 2017 | £373,003 | 11% |
405 Properties |
| 2016 | £331,910 | 5% |
407 Properties |
| 2015 | £314,976 | 5% |
473 Properties |
| 2014 | £300,141 | 9% |
554 Properties |
| 2013 | £273,853 | 4% |
450 Properties |
| 2012 | £264,070 | 1% |
339 Properties |
| 2011 | £262,482 | -6% |
385 Properties |
| 2010 | £278,329 | 14% |
383 Properties |
| 2009 | £240,695 | -6% |
400 Properties |
| 2008 | £254,792 | -5% |
302 Properties |
| 2007 | £266,262 | 7% |
542 Properties |
| 2006 | £248,942 | 8% |
631 Properties |
| 2005 | £228,639 | -2% |
544 Properties |
| 2004 | £234,076 | 12% |
606 Properties |
| 2003 | £206,743 | 15% |
643 Properties |
| 2002 | £176,365 | 16% |
710 Properties |
| 2001 | £148,460 | 10% |
660 Properties |
| 2000 | £133,190 | 10% |
590 Properties |
| 1999 | £120,104 | 7% |
682 Properties |
| 1998 | £111,781 | 17% |
575 Properties |
| 1997 | £92,433 | 2% |
639 Properties |
| 1996 | £90,591 | 2% |
633 Properties |
| 1995 | £89,229 | - |
496 Properties |
Property Price per Property Type in Kenilworth
Here you can find historic sold price data in order to help with your property search.
The average Property Paid Price for specific property types in the last three years are:
| Property Type | Average Sold Price | Sold Properties |
|---|---|---|
| Semi Detached House | £410,588.00 | 352 Semi Detached Houses |
| Detached House | £647,452.00 | 324 Detached Houses |
| Terraced House | £340,546.00 | 236 Terraced Houses |
| Flat | £198,634.00 | 198 Flats |