
Houses for sale & to rent in Warwick South, Leamington Spa
House Prices in Warwick South
Properties in Warwick South have an average house price of £438k and had 20 Property Transactions within the last 3 years¹.
Warwick South is an area in Leamington Spa, Warwickshire with 148 households², where the most expensive property was sold for £1.25M.
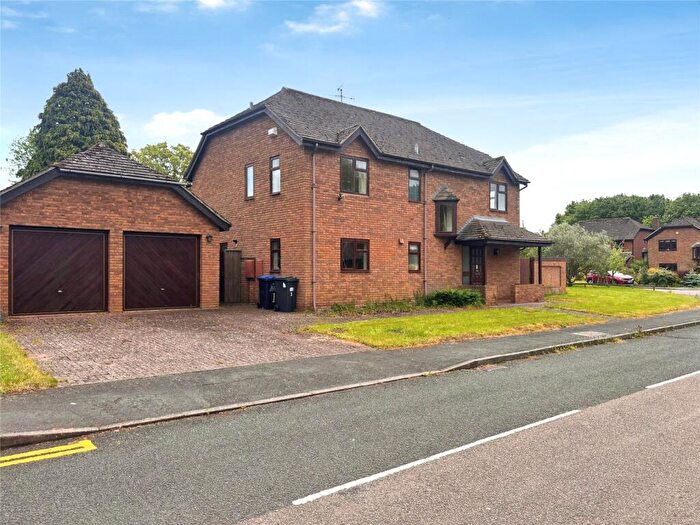
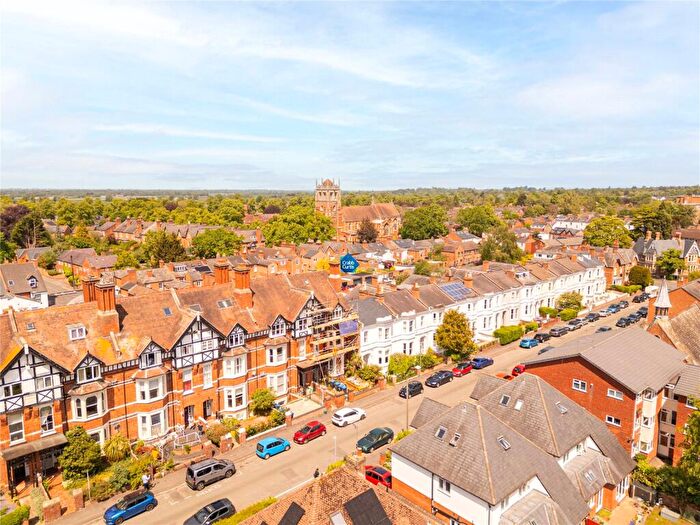
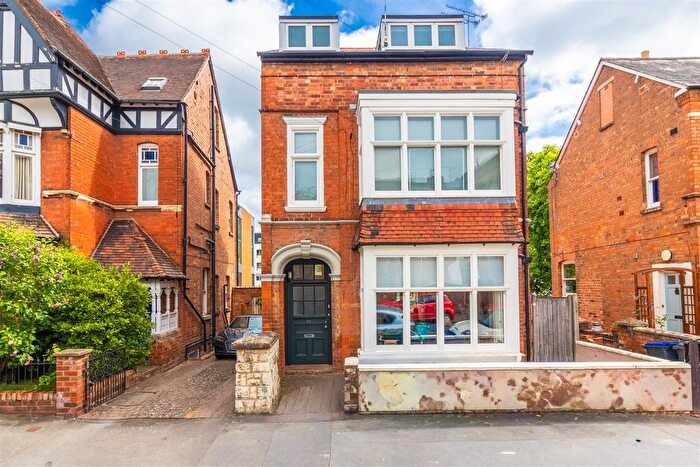
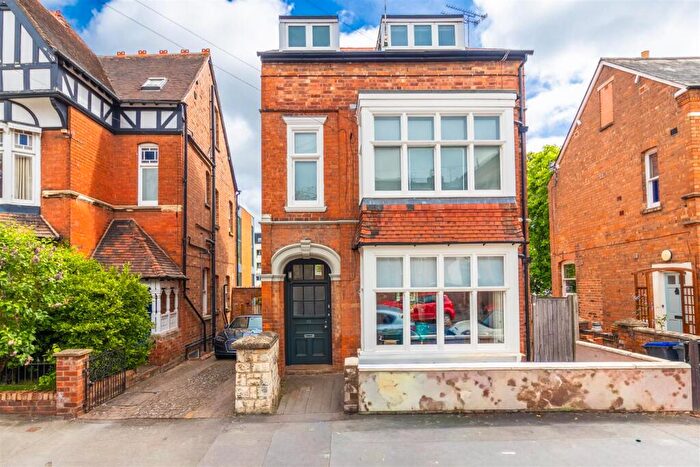
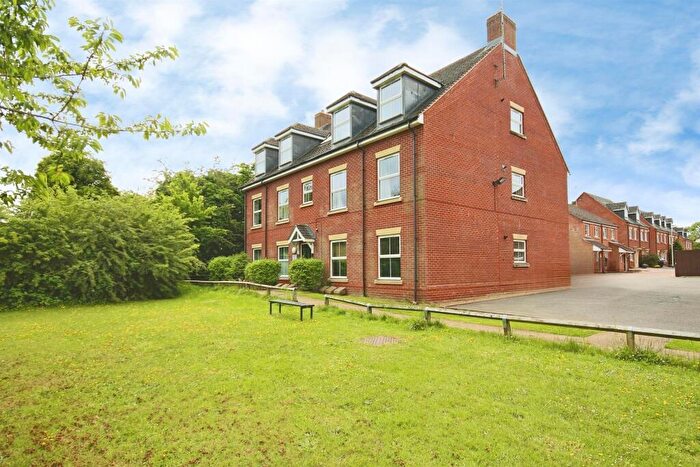
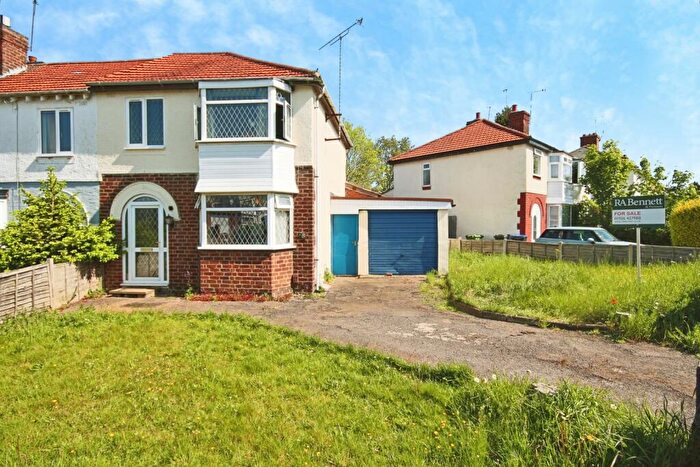
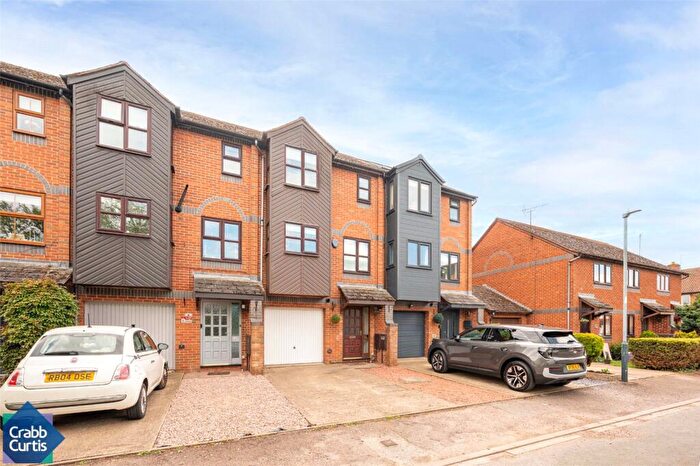
Properties for sale in Warwick South

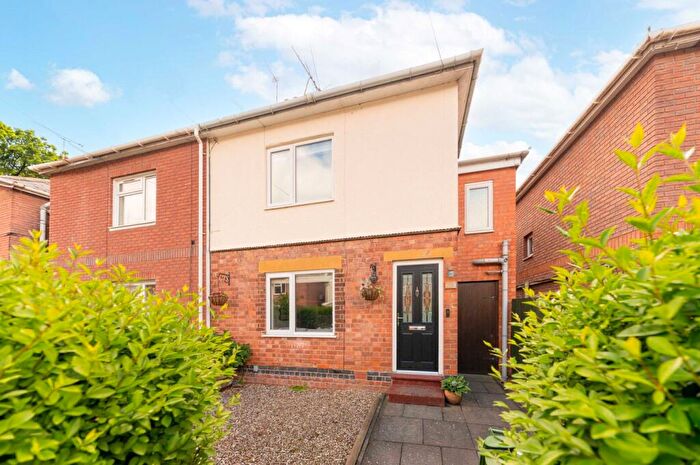
![]()
If you are looking to sell your house, let it out, or receive a property valuation, an expert can help you.
Click the button below to get started.


Roads and Postcodes in Warwick South
Navigate through our locations to find the location of your next house in Warwick South, Leamington Spa for sale or to rent.
| Streets | Postcodes |
|---|---|
| Leam Road | CV31 3PA |
| Myton Crofts | CV31 3NZ |
| Myton Road | CV31 3NY |
| The Moorings | CV31 3QA CV31 3QD |
Transport near Warwick South

- FAQ
- Price Paid By Year
- Property Type Price
Frequently asked questions about Warwick South
What is the average price for a property for sale in Warwick South?
The average price for a property for sale in Warwick South is £438,051. This amount is 12% higher than the average price in Leamington Spa. There are 919 property listings for sale in Warwick South.
What streets have the most expensive properties for sale in Warwick South?
The streets with the most expensive properties for sale in Warwick South are Myton Crofts at an average of £865,900 and Leam Road at an average of £721,110.
What streets have the most affordable properties for sale in Warwick South?
The streets with the most affordable properties for sale in Warwick South are The Moorings at an average of £209,544 and Myton Road at an average of £605,000.
Which train stations are available in or near Warwick South?
Some of the train stations available in or near Warwick South are Leamington Spa, Warwick and Warwick Parkway.
Property Price Paid in Warwick South by Year
The average sold property price by year was:
| Year | Average Sold Price | Price Change |
Sold Properties
|
|---|---|---|---|
| 2025 | £483,436 | 27% |
8 Properties |
| 2024 | £350,900 | -28% |
5 Properties |
| 2023 | £448,433 | 10% |
7 Properties |
| 2022 | £405,500 | 24% |
4 Properties |
| 2021 | £307,333 | 9% |
9 Properties |
| 2020 | £280,666 | -28% |
3 Properties |
| 2019 | £359,687 | 40% |
8 Properties |
| 2018 | £214,450 | -78% |
10 Properties |
| 2017 | £380,777 | 7% |
9 Properties |
| 2016 | £354,444 | -1% |
9 Properties |
| 2015 | £359,425 | 39% |
8 Properties |
| 2014 | £217,710 | 22% |
14 Properties |
| 2013 | £170,000 | -58% |
1 Property |
| 2012 | £269,339 | 17% |
12 Properties |
| 2011 | £223,166 | -37% |
3 Properties |
| 2010 | £306,083 | 14% |
6 Properties |
| 2009 | £261,750 | 8% |
2 Properties |
| 2008 | £239,525 | 27% |
2 Properties |
| 2007 | £174,583 | -59% |
6 Properties |
| 2006 | £278,296 | 22% |
16 Properties |
| 2005 | £217,700 | -9% |
5 Properties |
| 2004 | £237,044 | 12% |
9 Properties |
| 2003 | £207,438 | 27% |
18 Properties |
| 2002 | £152,200 | 17% |
14 Properties |
| 2001 | £127,000 | 20% |
14 Properties |
| 2000 | £101,408 | 6% |
12 Properties |
| 1999 | £94,912 | 13% |
24 Properties |
| 1998 | £82,846 | 3% |
18 Properties |
| 1997 | £80,213 | 22% |
15 Properties |
| 1996 | £62,202 | 4% |
21 Properties |
| 1995 | £59,703 | - |
50 Properties |
Property Price per Property Type in Warwick South
Here you can find historic sold price data in order to help with your property search.
The average Property Paid Price for specific property types in the last three years are:
| Property Type | Average Sold Price | Sold Properties |
|---|---|---|
| Semi Detached House | £998,850.00 | 2 Semi Detached Houses |
| Flat | £209,544.00 | 11 Flats |
| Detached House | £636,904.00 | 7 Detached Houses |