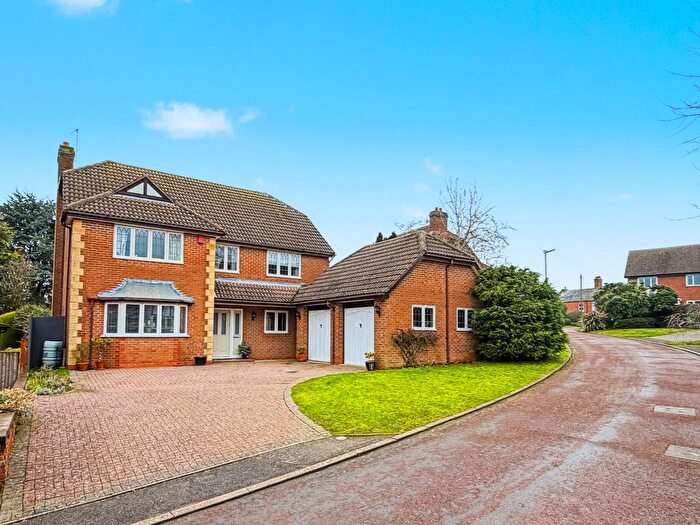
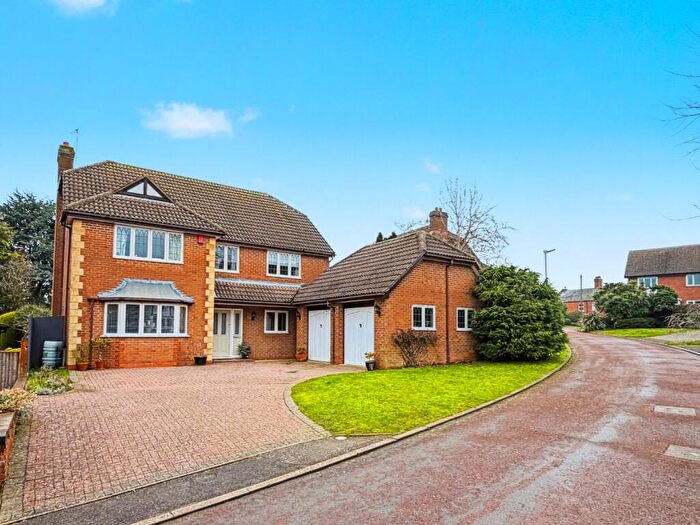
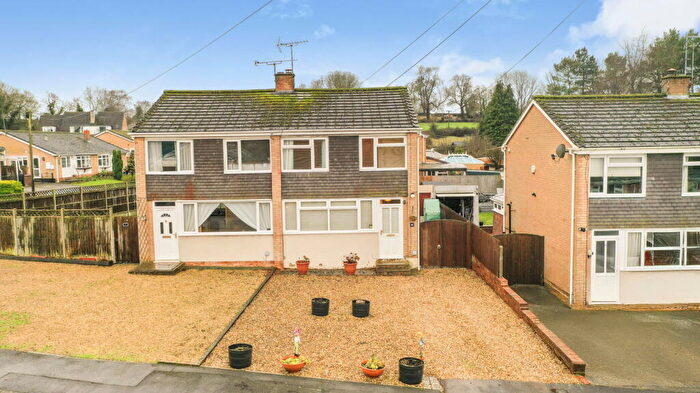
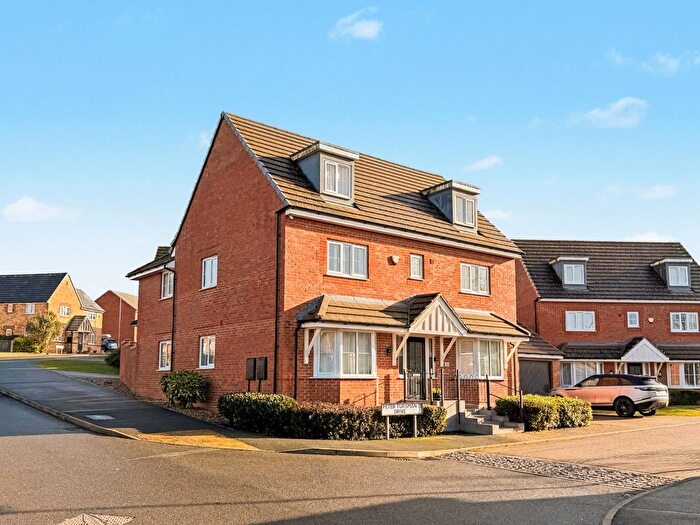
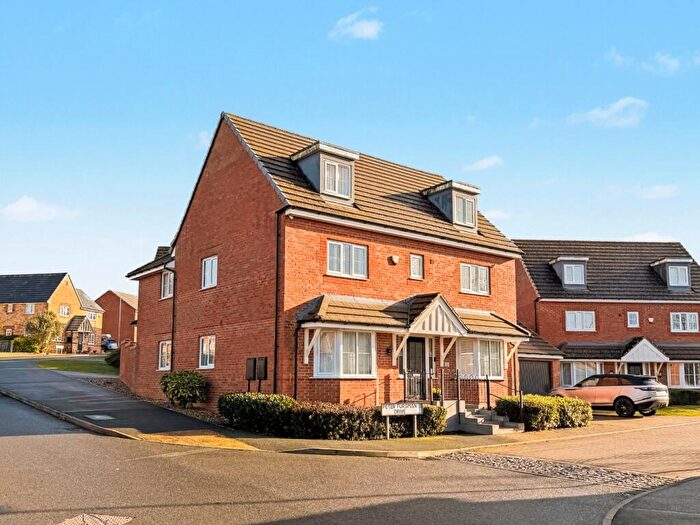
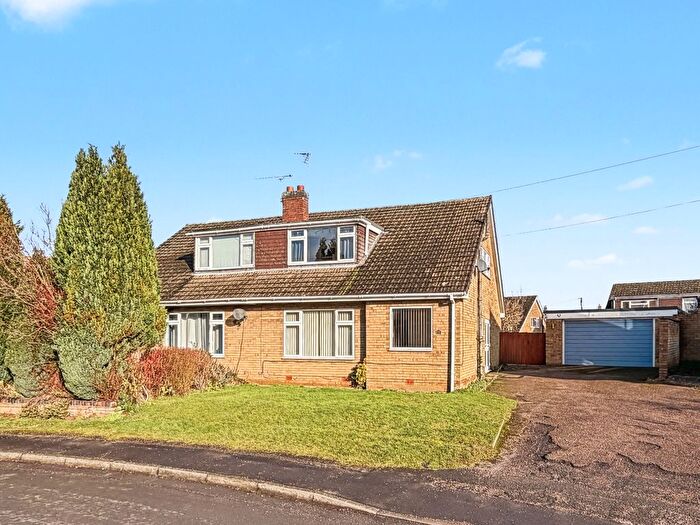
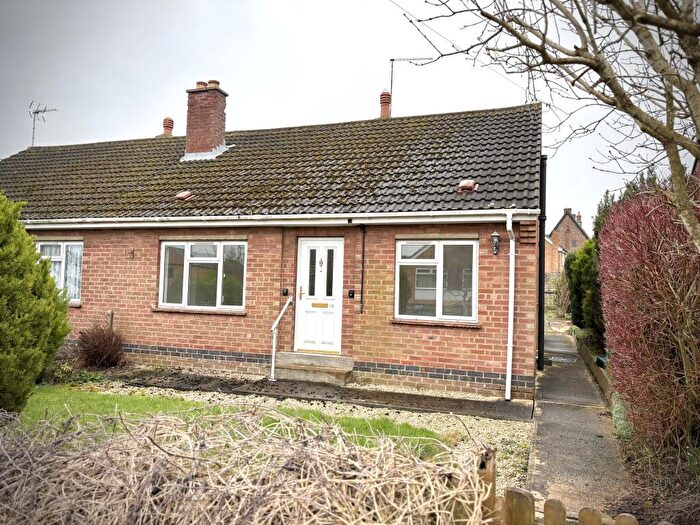
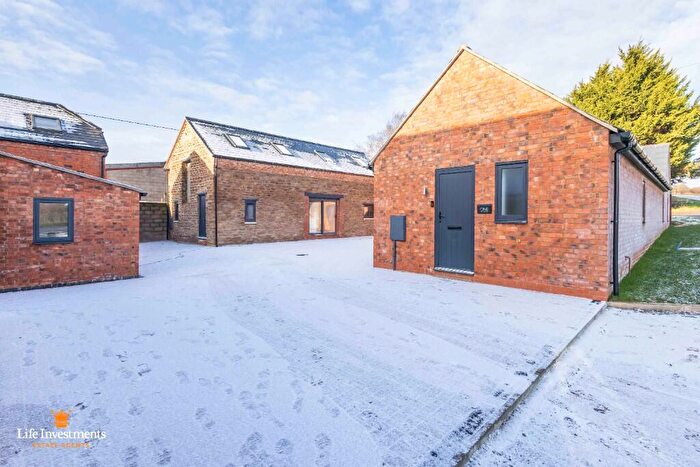
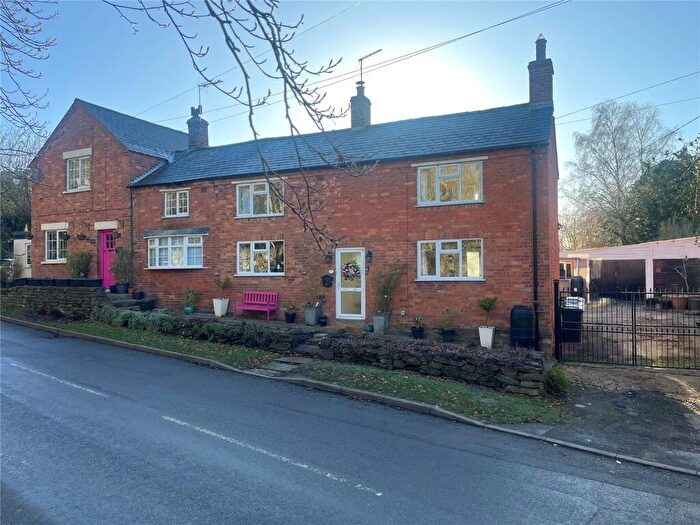
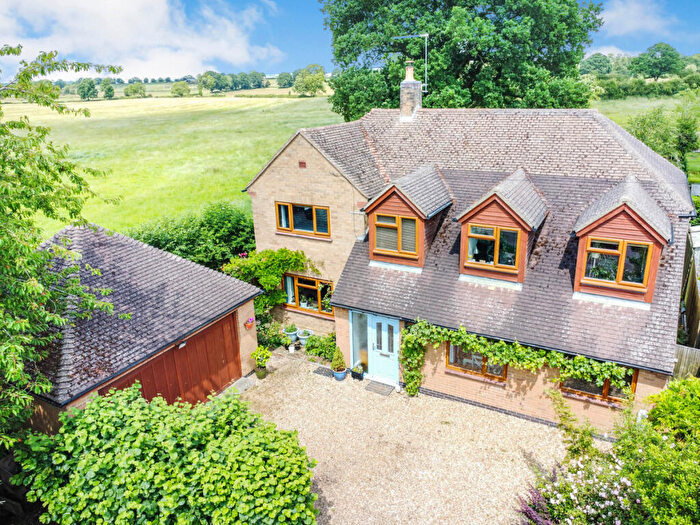
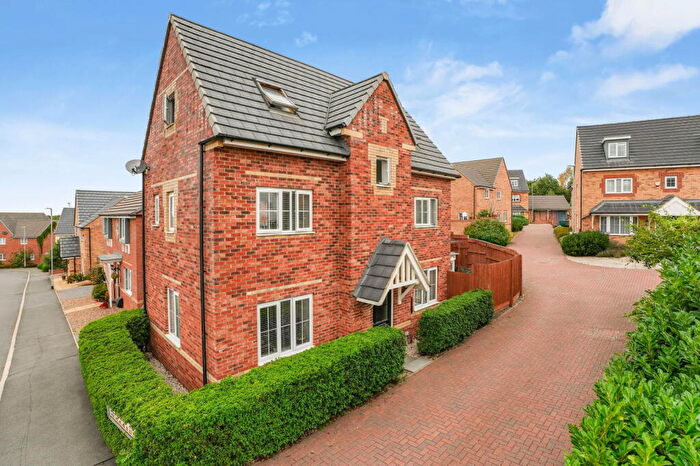
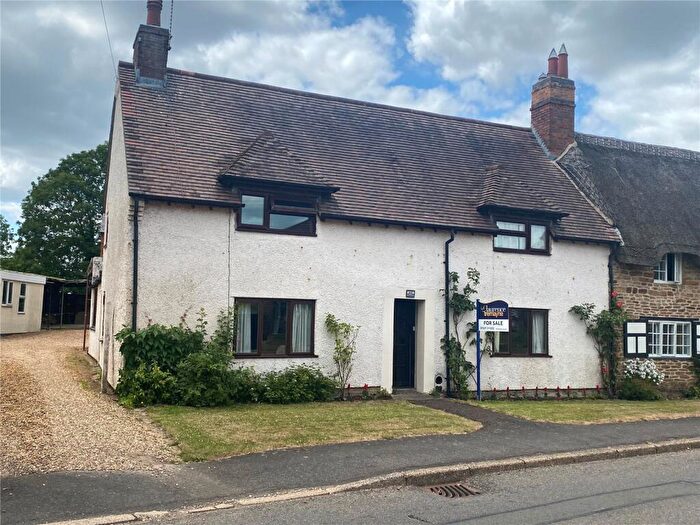
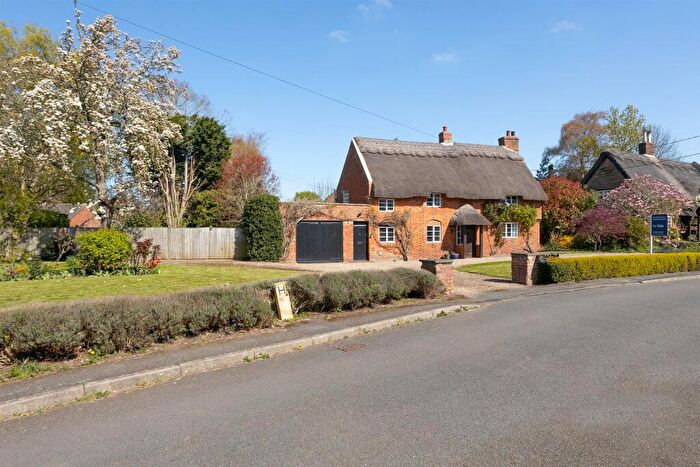
Houses for sale & to rent in Barby And Kilsby, Northampton
House Prices in Barby And Kilsby
Properties in Barby And Kilsby have an average house price of £388,372.00 and had 83 Property Transactions within the last 3 years¹.
Barby And Kilsby is an area in Northampton, Warwickshire with 707 households², where the most expensive property was sold for £1,000,000.00.
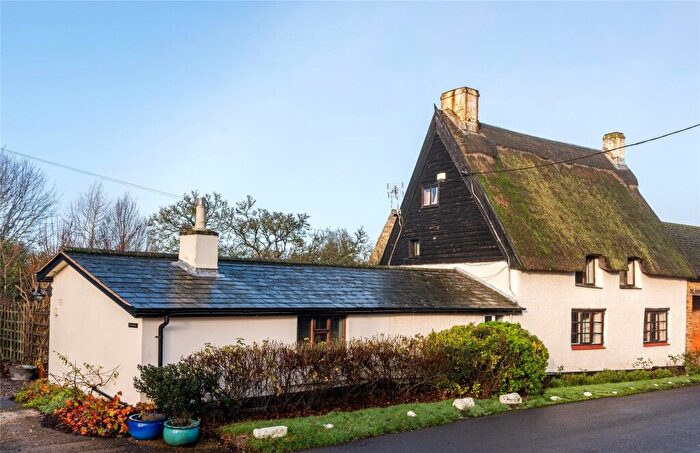
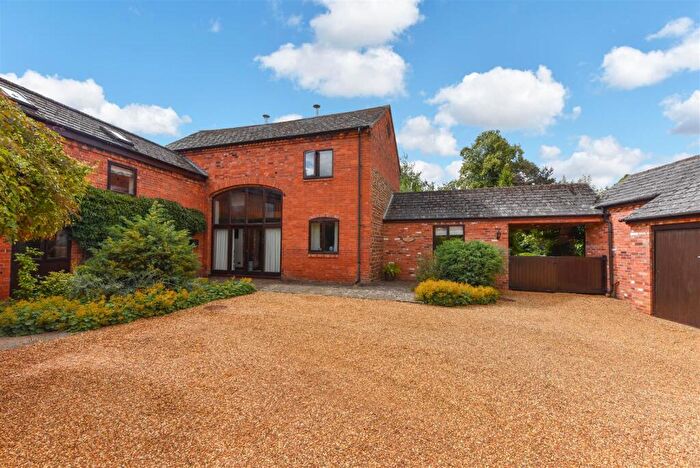
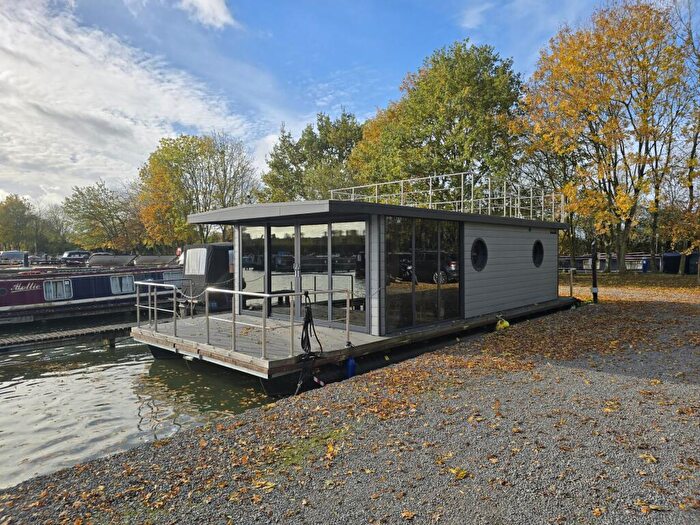
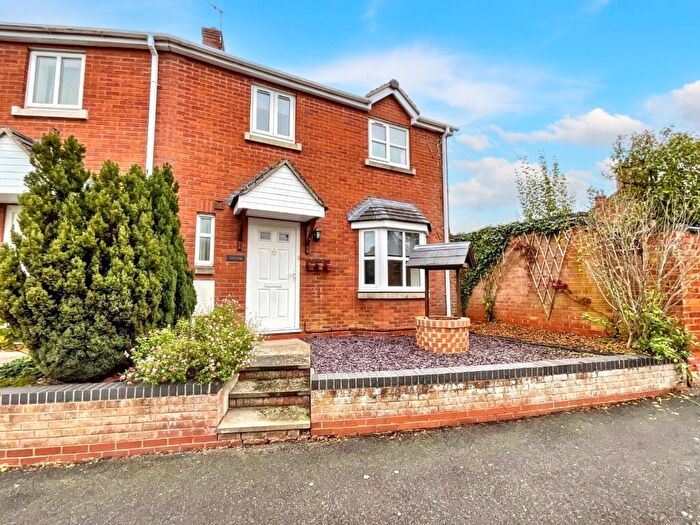
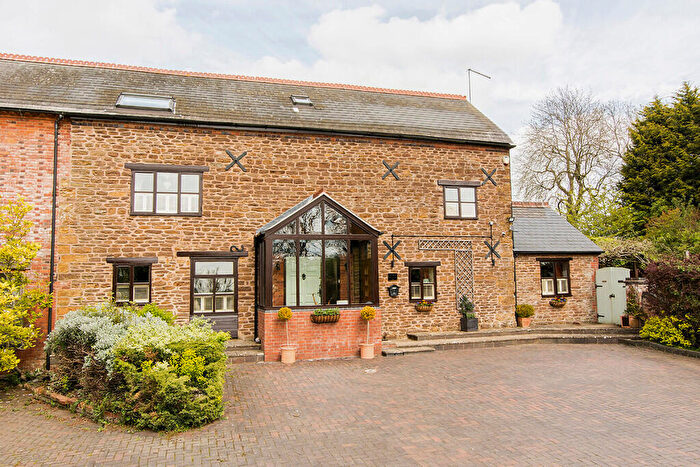
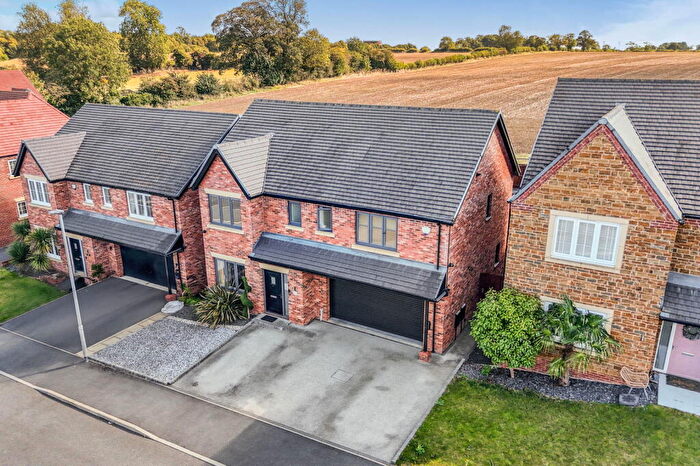
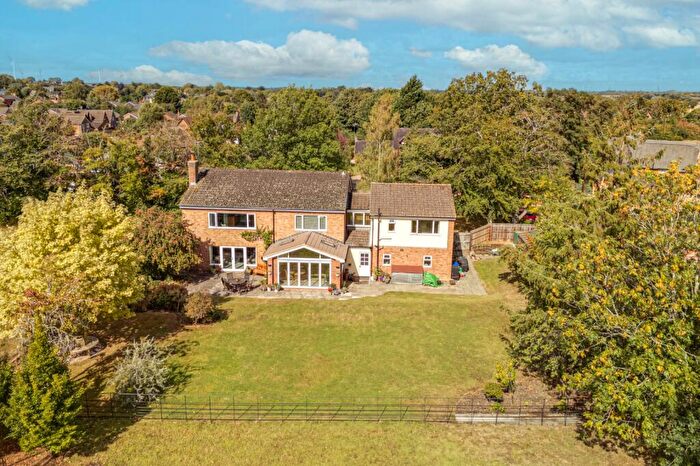
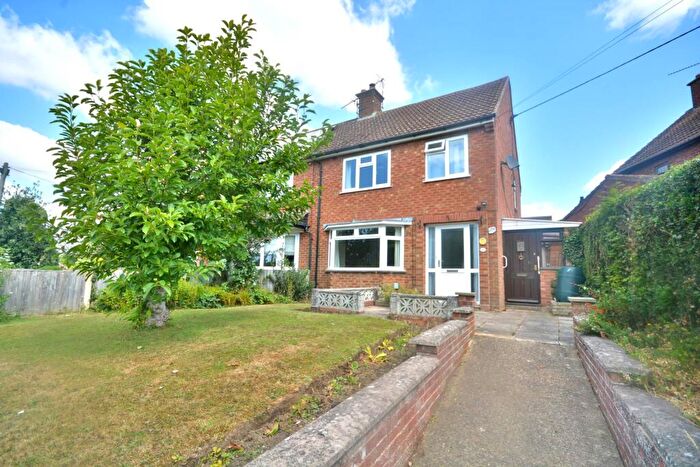
Properties for sale in Barby And Kilsby
Roads and Postcodes in Barby And Kilsby
Navigate through our locations to find the location of your next house in Barby And Kilsby, Northampton for sale or to rent.
| Streets | Postcodes |
|---|---|
| A5 | NN6 7BZ |
| Alice Court | NN6 7SP |
| Ashby Drive | NN6 7TA |
| Ashworth Close | NN6 7XD |
| Barley Croft | NN6 7UA |
| Benjamin Bevin Road | NN6 7WT |
| Boat Horse Lane | NN6 7TH |
| Bucknills Lane | NN6 7SX |
| Bury Dyke | NN6 7XA |
| Celtic Way | NN6 7GW |
| Centenary Drive | NN6 7WN |
| Chapel Lane | NN6 7TW |
| Church Street | NN6 7TP |
| Coleman Close | NN6 7GB |
| Cowley Meadow Way | NN6 7TY |
| Crick Wharf | NN6 7XT |
| Danes Way | NN6 7DD NN6 7GX |
| Dirft Drive | NN6 7GZ |
| Dockham Way | NN6 7TZ |
| Drayson Lane | NN6 7SR |
| Dunn Close | NN6 7GD |
| Eldon Close Industrial Estate | NN6 7UD |
| Eldon Way | NN6 7SL |
| Ellen Close | NN6 7SG |
| Fallowfields | NN6 7GA |
| Haswell Road | NN6 7WQ |
| Hatherley Close | NN6 7GT |
| High Street | NN6 7TS |
| Howkins Road | NN6 7WP |
| King Style Close | NN6 7ST |
| Lauds Road | NN6 7TJ |
| Main Road | NN6 7TU NN6 7TX |
| Marsh Close | NN6 7TL |
| Marsons Drive | NN6 7TD |
| Monks Way | NN6 7XB |
| Oak Lane | NN6 7SS |
| Parklands | NN6 7EA NN6 7EX |
| Peter Fursman Drive | NN6 7WJ |
| Portlow Lane | NN6 7SU |
| Pyke Way | NN6 7NZ |
| Railport Approach | NN6 7EL NN6 7ES NN6 7JZ |
| Rectory Close | NN6 7SY |
| Ritchie Close | NN6 7UG |
| Saxon Drive | NN6 7GY |
| Southfields Drive | NN6 7TQ |
| Swainson Close | NN6 7GS |
| The Derry | NN6 7SZ |
| The High Leys | NN6 7TE |
| The Marsh | NN6 7TN |
| The Paddock | NN6 7XG |
| Thomas Close | NN6 7NX |
| Thornton Close | NN6 7GE |
| Watford Road | NN6 7TG NN6 7TT NN11 2LJ |
| Watling Street | NN6 7UQ |
| Webb Close | NN6 7GF |
| Well Hill Close | NN6 7TB |
| West Haddon Road | NN6 7SQ NN6 7XJ NN6 7NE |
| Winwick Lane | NN6 7NF |
| Wolsey Close | NN6 7XE |
| Yelvertoft Road | NN6 7TF NN6 7TR NN6 7XS |
| NN6 7FT NN6 7SJ NN6 7SN NN6 7US NN6 7XR |
Transport near Barby And Kilsby
- FAQ
- Price Paid By Year
- Property Type Price
Frequently asked questions about Barby And Kilsby
What is the average price for a property for sale in Barby And Kilsby?
The average price for a property for sale in Barby And Kilsby is £388,372. This amount is 6% lower than the average price in Northampton. There are 332 property listings for sale in Barby And Kilsby.
What streets have the most expensive properties for sale in Barby And Kilsby?
The streets with the most expensive properties for sale in Barby And Kilsby are Drayson Lane at an average of £703,750, Pyke Way at an average of £575,000 and Boat Horse Lane at an average of £569,333.
What streets have the most affordable properties for sale in Barby And Kilsby?
The streets with the most affordable properties for sale in Barby And Kilsby are King Style Close at an average of £248,750, Dunn Close at an average of £254,000 and Chapel Lane at an average of £256,000.
Which train stations are available in or near Barby And Kilsby?
Some of the train stations available in or near Barby And Kilsby are Long Buckby, Rugby and Northampton.
Property Price Paid in Barby And Kilsby by Year
The average sold property price by year was:
| Year | Average Sold Price | Price Change |
Sold Properties
|
|---|---|---|---|
| 2025 | £428,086 | 12% |
34 Properties |
| 2024 | £375,553 | 9% |
27 Properties |
| 2023 | £342,727 | -21% |
22 Properties |
| 2022 | £413,767 | 10% |
31 Properties |
| 2021 | £371,094 | 2% |
43 Properties |
| 2020 | £362,890 | 17% |
25 Properties |
| 2019 | £301,623 | -24% |
25 Properties |
| 2018 | £375,290 | 12% |
71 Properties |
| 2017 | £330,959 | -16% |
71 Properties |
| 2016 | £385,116 | 17% |
67 Properties |
| 2015 | £320,390 | 11% |
75 Properties |
| 2014 | £283,561 | 2% |
40 Properties |
| 2013 | £277,009 | 12% |
35 Properties |
| 2012 | £244,272 | -2% |
31 Properties |
| 2011 | £248,703 | -12% |
27 Properties |
| 2010 | £278,527 | 18% |
35 Properties |
| 2009 | £228,200 | -2% |
20 Properties |
| 2008 | £232,746 | -23% |
16 Properties |
| 2007 | £285,910 | 6% |
29 Properties |
| 2006 | £268,498 | 5% |
30 Properties |
| 2005 | £254,758 | -6% |
25 Properties |
| 2004 | £268,923 | 19% |
48 Properties |
| 2003 | £216,841 | 5% |
55 Properties |
| 2002 | £205,227 | 29% |
55 Properties |
| 2001 | £145,902 | 2% |
46 Properties |
| 2000 | £142,935 | 17% |
25 Properties |
| 1999 | £118,894 | -0,2% |
44 Properties |
| 1998 | £119,098 | 25% |
67 Properties |
| 1997 | £89,856 | 6% |
32 Properties |
| 1996 | £84,633 | -18% |
24 Properties |
| 1995 | £100,142 | - |
26 Properties |
Property Price per Property Type in Barby And Kilsby
Here you can find historic sold price data in order to help with your property search.
The average Property Paid Price for specific property types in the last three years are:
| Property Type | Average Sold Price | Sold Properties |
|---|---|---|
| Semi Detached House | £288,019.00 | 33 Semi Detached Houses |
| Detached House | £502,341.00 | 42 Detached Houses |
| Terraced House | £203,987.00 | 8 Terraced Houses |

