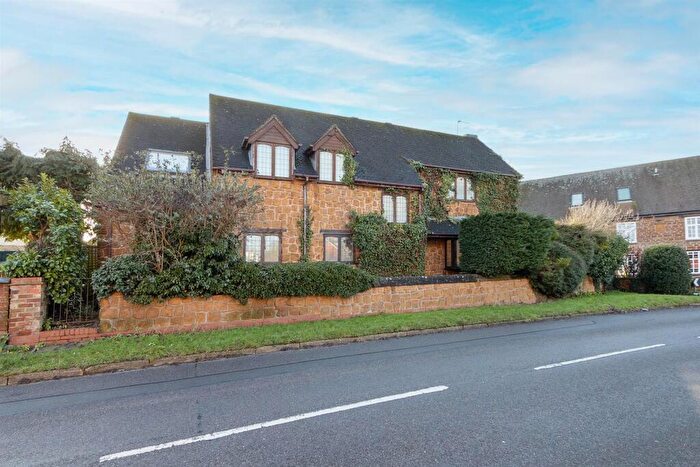
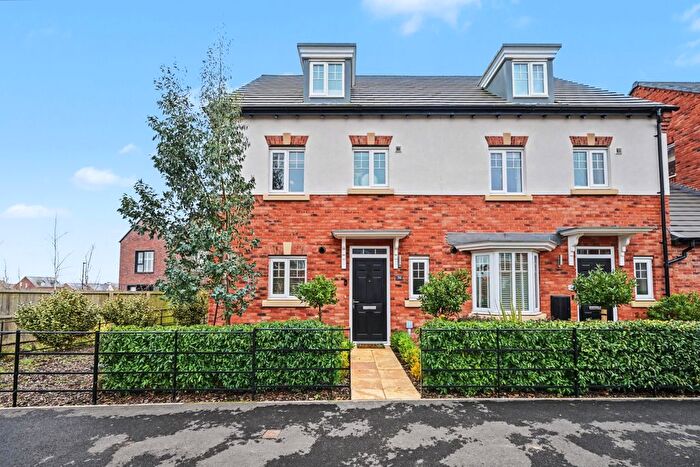
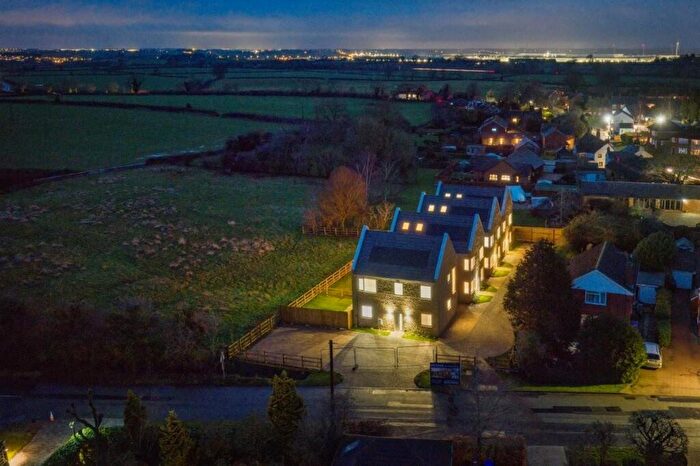
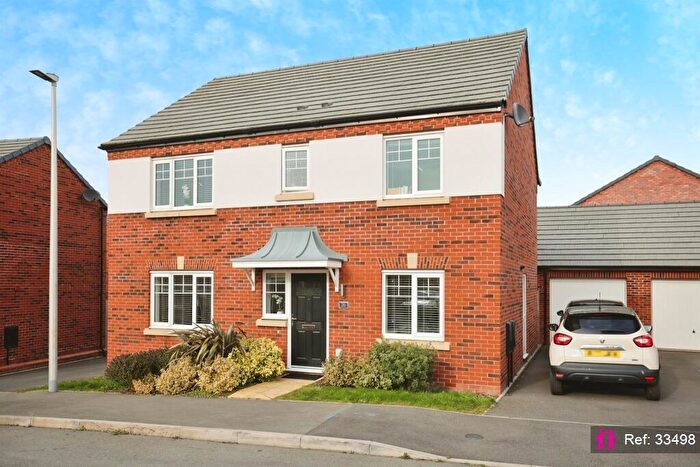
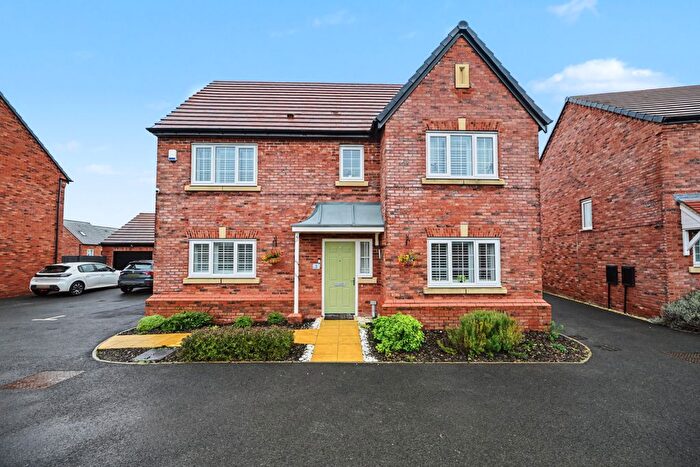
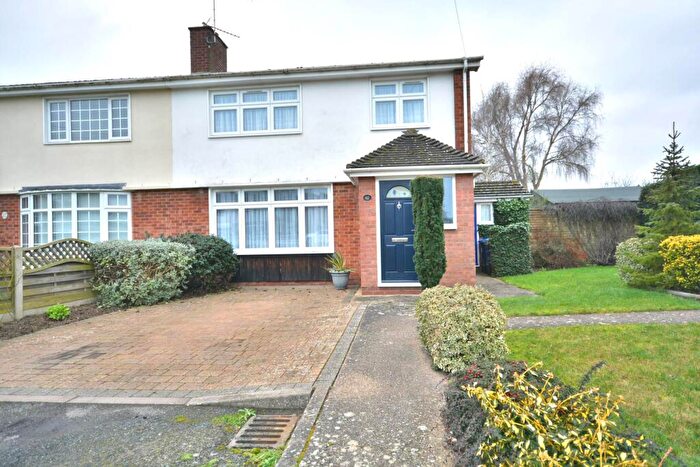
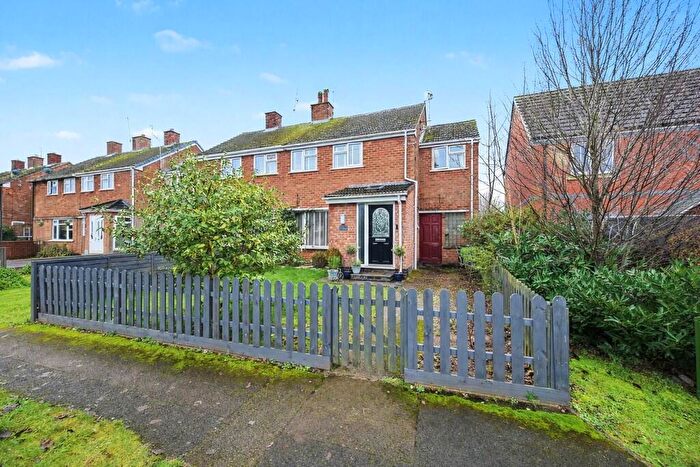
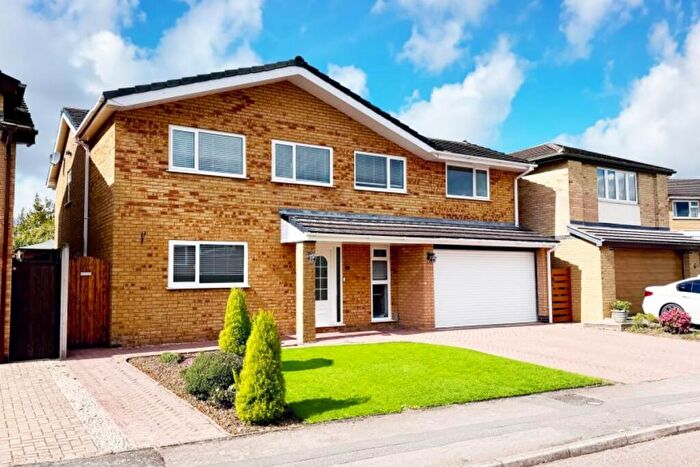
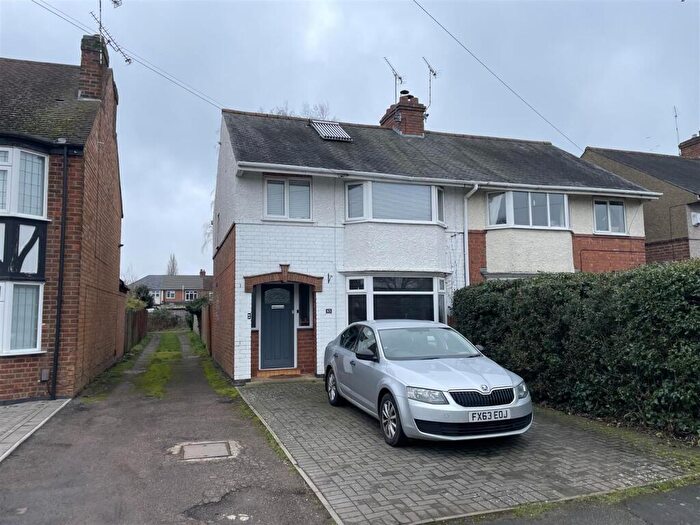
Houses for sale & to rent in Barby And Kilsby, Rugby
House Prices in Barby And Kilsby
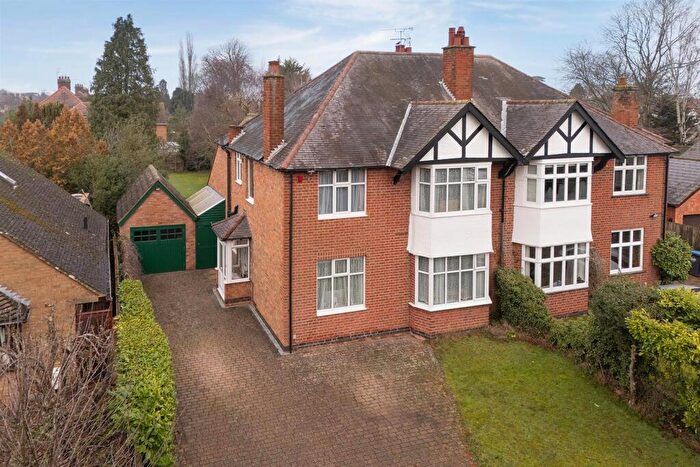
Properties in Barby And Kilsby have an average house price of £389,324.00 and had 107 Property Transactions within the last 3 years¹.
Barby And Kilsby is an area in Rugby, Warwickshire with 1,096 households², where the most expensive property was sold for £1,325,000.00.
Properties for sale in Barby And Kilsby
Roads and Postcodes in Barby And Kilsby
Navigate through our locations to find the location of your next house in Barby And Kilsby, Rugby for sale or to rent.
| Streets | Postcodes |
|---|---|
| Almond Close | CV23 8TL |
| Arnills Way | CV23 8UY |
| Ashby Road | CV23 8UZ |
| Ashleigh Close | CV23 8UG |
| Balding Close | CV23 8TQ |
| Barby Lane | CV23 8TD CV23 8UJ CV23 8UX |
| Barby Road | CV23 8XD |
| Boxwood Drive | CV23 8YQ |
| Brackendale Drive | CV23 8TJ |
| Brassey Way | CV23 8BQ |
| Castle Mound | CV23 8TN |
| Chapel Street | CV23 8XE |
| Church Walk | CV23 8TW CV23 8YB |
| Cleve Cottage | CV23 8TF |
| Cowley Way | CV23 8XB |
| Crick Road | CV23 8YL |
| Daventry Road | CV23 8TP CV23 8TR CV23 8XF CV23 8YX CV23 8FJ CV23 8UP |
| Devon Ox Road | CV23 8XG CV23 8YS |
| Elkington Lane | CV23 8US CV23 8WA |
| Emery Close | CV23 8ZA |
| Emery Row | CV23 8YY |
| Essen Lane | CV23 8XQ |
| Fishers Close | CV23 8XH |
| George Row | CV23 8XJ |
| Hall Close | CV23 8XZ |
| Holme Way | CV23 8UQ |
| Independent Street | CV23 8XL |
| Kilsby Road | CV23 8TT CV23 8TU |
| Llamas Farm Court | CV23 8BF |
| Longhouse Road | CV23 8YJ |
| Main Road | CV23 8XP CV23 8XR CV23 8XW |
| Main Street | CV23 8UN |
| Malt Mill Close | CV23 8XN |
| Malt Mill Green | CV23 8YW |
| Manor Farm Close | CV23 8FA |
| Manor Villas | CV23 8XS |
| Middle Street | CV23 8XT |
| Mitchison Close | CV23 8TH |
| Montague Drive | CV23 8FP |
| Normandy Fields Way | CV23 8YP |
| North Street | CV23 8XU |
| Nortoft Lane | CV23 8YF |
| Onley | CV23 8AP |
| Onley Lane | CV23 8TB |
| Onley Park | CV23 8AL CV23 8AN CV23 8AW CV23 8SY CV23 8SZ |
| Pittoms Lane | CV23 8TX |
| Postle Close | CV23 8YG |
| Rectory Close | CV23 8TY |
| Rectory Lane | CV23 8TZ |
| Rugby Road | CV23 8UA CV23 8UB CV23 8XX |
| School Close | CV23 8TA |
| Smarts Estate | CV23 8XY |
| Spring Close | CV23 8YZ |
| Star Corner | CV23 8UD |
| Stephenson Way | CV23 8YH |
| The Banks | CV23 8XA |
| The Green | CV23 8TS |
| The Lane | CV23 8UL |
| The Lawns | CV23 8YT |
| Ware Orchard | CV23 8UF |
| Ware Road | CV23 8UE |
| Watling Street | CV23 8UW CV23 8YA CV23 8YD CV23 8YE |
| Welton Road | CV23 8TG CV23 8UR |
| Willoughby Road | CV23 8UH |
| CV23 8AJ CV23 8UT CV23 8UU |
Transport near Barby And Kilsby
- FAQ
- Price Paid By Year
- Property Type Price
Frequently asked questions about Barby And Kilsby
What is the average price for a property for sale in Barby And Kilsby?
The average price for a property for sale in Barby And Kilsby is £389,324. This amount is 30% higher than the average price in Rugby. There are 2,341 property listings for sale in Barby And Kilsby.
What streets have the most expensive properties for sale in Barby And Kilsby?
The streets with the most expensive properties for sale in Barby And Kilsby are Llamas Farm Court at an average of £897,000, North Street at an average of £850,000 and The Lane at an average of £810,000.
What streets have the most affordable properties for sale in Barby And Kilsby?
The streets with the most affordable properties for sale in Barby And Kilsby are Ware Orchard at an average of £250,000, Onley Park at an average of £279,055 and Smarts Estate at an average of £281,333.
Which train stations are available in or near Barby And Kilsby?
Some of the train stations available in or near Barby And Kilsby are Rugby, Long Buckby and Northampton.
Property Price Paid in Barby And Kilsby by Year
The average sold property price by year was:
| Year | Average Sold Price | Price Change |
Sold Properties
|
|---|---|---|---|
| 2025 | £395,394 | -3% |
30 Properties |
| 2024 | £407,769 | 10% |
39 Properties |
| 2023 | £365,601 | -28% |
38 Properties |
| 2022 | £466,843 | 21% |
35 Properties |
| 2021 | £366,583 | 8% |
53 Properties |
| 2020 | £338,565 | 2% |
45 Properties |
| 2019 | £332,272 | -17% |
50 Properties |
| 2018 | £389,386 | 22% |
63 Properties |
| 2017 | £302,170 | -4% |
27 Properties |
| 2016 | £313,248 | 13% |
46 Properties |
| 2015 | £272,146 | 7% |
48 Properties |
| 2014 | £253,810 | -1% |
52 Properties |
| 2013 | £256,588 | 17% |
38 Properties |
| 2012 | £214,062 | -10% |
28 Properties |
| 2011 | £234,636 | -11% |
38 Properties |
| 2010 | £259,779 | 15% |
31 Properties |
| 2009 | £221,152 | -3% |
39 Properties |
| 2008 | £226,897 | -23% |
34 Properties |
| 2007 | £278,251 | 15% |
38 Properties |
| 2006 | £235,679 | 11% |
47 Properties |
| 2005 | £208,829 | 2% |
34 Properties |
| 2004 | £205,664 | 2% |
42 Properties |
| 2003 | £200,999 | -10% |
46 Properties |
| 2002 | £220,396 | 49% |
46 Properties |
| 2001 | £113,052 | -8% |
45 Properties |
| 2000 | £121,798 | 7% |
35 Properties |
| 1999 | £113,050 | 8% |
58 Properties |
| 1998 | £103,584 | -11% |
48 Properties |
| 1997 | £115,440 | 16% |
42 Properties |
| 1996 | £96,451 | 6% |
44 Properties |
| 1995 | £90,750 | - |
39 Properties |
Property Price per Property Type in Barby And Kilsby
Here you can find historic sold price data in order to help with your property search.
The average Property Paid Price for specific property types in the last three years are:
| Property Type | Average Sold Price | Sold Properties |
|---|---|---|
| Semi Detached House | £311,165.00 | 51 Semi Detached Houses |
| Detached House | £486,699.00 | 49 Detached Houses |
| Terraced House | £277,142.00 | 7 Terraced Houses |

