
Houses for sale & to rent in Moulton, Northampton
House Prices in Moulton
Properties in Moulton have an average house price of £364k and had 250 Property Transactions within the last 3 years¹.
Moulton is an area in Northampton, Warwickshire with 1,765 households², where the most expensive property was sold for £1.52M.
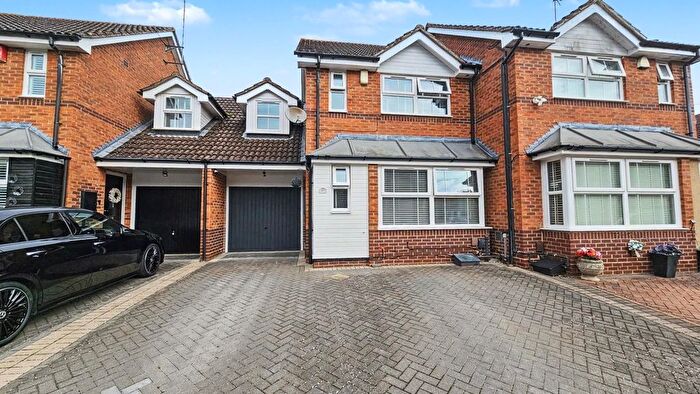
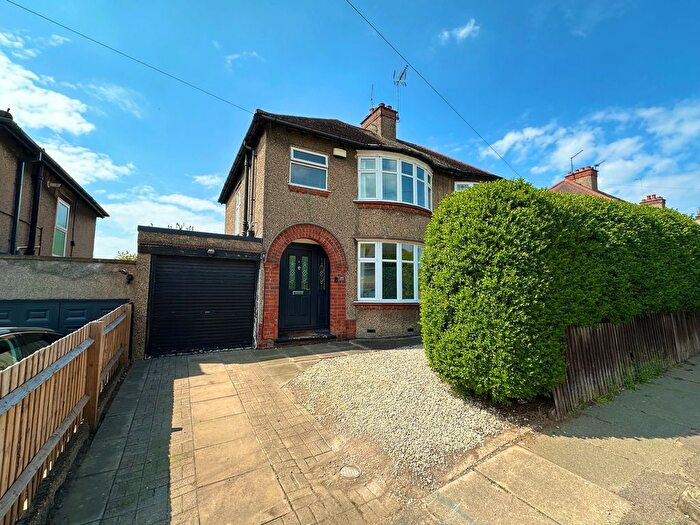
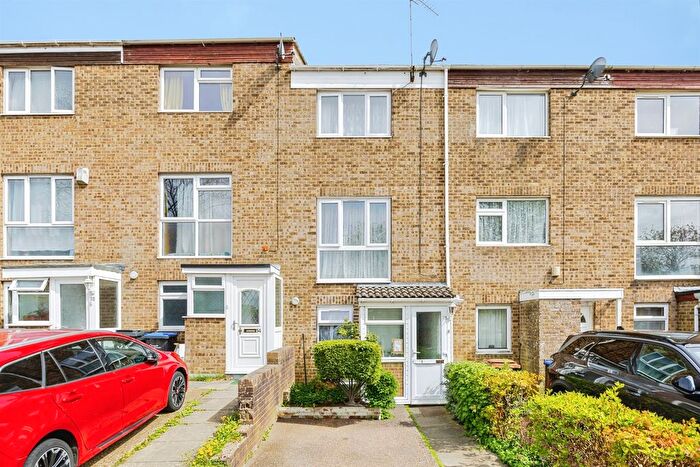
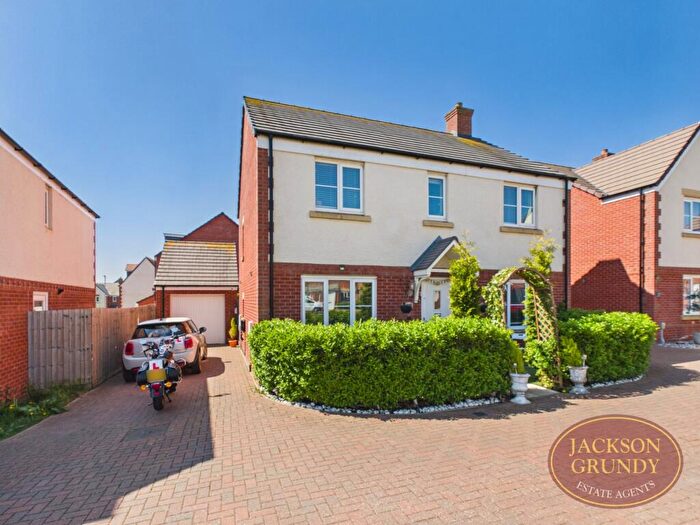
Properties for sale in Moulton
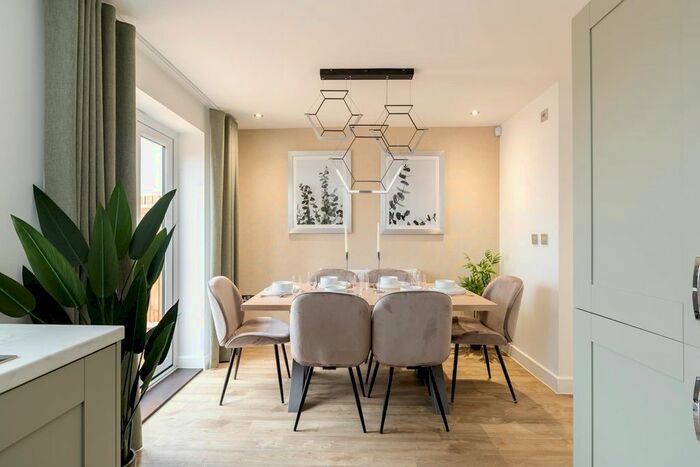

![]()
If you are looking to sell your house, let it out, or receive a property valuation, an expert can help you.
Click the button below to get started.

Roads and Postcodes in Moulton
Navigate through our locations to find the location of your next house in Moulton, Northampton for sale or to rent.
| Streets | Postcodes |
|---|---|
| Alibone Close | NN3 7WR |
| Arnsby Crescent | NN3 7SL |
| Ashby Court | NN3 7AH |
| Ashby Gardens | NN3 7AG |
| Ashley Close | NN3 7AT |
| Ashley Lane | NN3 7TH NN3 7TJ |
| Barlow Lane | NN3 7SZ |
| Boughton Road | NN3 7SG NN3 7SJ NN3 7SQ |
| Browns Close | NN3 7AQ |
| Brunting Road | NN3 7QT NN3 7QX |
| Carey Close | NN3 7SN |
| Chater Street | NN3 7UD |
| Church Hill | NN3 7SW |
| Church Mews | NN3 7SE |
| Church Street | NN3 7SP |
| Church View | NN3 7FZ |
| Crescent Lodge | NN6 0SR |
| Cross Street | NN3 7RZ |
| Doves Lane | NN3 7TA |
| Druids Way | NN3 7AY |
| Eady Close | NN3 7TF |
| Fuller Road | NN3 7QZ NN3 7RA |
| Glengary | NN3 7FH |
| Grange Lane | NN6 9AN |
| Greenwood Close | NN3 7RD |
| Grove Farm Lane | NN3 7TG |
| Harvey Lane | NN3 7RB |
| High Street | NN3 7SR |
| Holcot Road | NN3 7NW NN3 7QN |
| Homestead Close | NN3 7RG |
| Honeystones | NN3 7RX |
| Inniskilling Close | NN3 7AD |
| Jeyes Close | NN3 7GH |
| Lakeside | NN6 0AP NN6 0AS NN6 0QS |
| Leonard Lane | NN3 7LL |
| Lunchfield Court | NN3 7AJ |
| Lunchfield Gardens | NN3 7AP |
| Lunchfield Lane | NN3 7AB |
| Lunchfield Walk | NN3 7AL |
| Manor Road | NN3 7QU |
| Northampton Lane North | NN3 7QR NN3 7QS NN3 7QW NN3 7QY NN3 7RF NN3 7RQ |
| Northampton Lane South | NN3 7RH |
| Oakley Drive | NN3 7UH |
| Overstone Close | NN3 7AF |
| Overstone Crescent | NN6 0AL |
| Overstone Lane | NN6 0AA |
| Overstone Road | NN3 7UG NN3 7UL NN3 7UP NN3 7UU NN3 7UX |
| Parade Bank | NN3 7ST |
| Park View | NN3 7TN NN3 7TP NN3 7TW NN3 7UZ |
| Park View Close | NN3 7AU |
| Pitsford Road | NN3 7SS NN3 7XW |
| Prince Of Wales Row | NN3 7UN |
| Pytchley View | NN3 7UQ |
| Reedings | NN3 7AX |
| Rose Tree Close | NN3 7SU |
| Ryland Road | NN3 7RE |
| Sandy Hill Lane | NN3 7AW |
| Siddons Way | NN3 7UR |
| Southcourt | NN3 7BB |
| Spectacle Lane | NN3 7SH |
| Stewart Close | NN3 7WU |
| Stocks Hill | NN3 7TB |
| Sywell Road | NN6 0AG NN6 0AN NN6 0AQ NN6 0GN |
| Tarrant Close | NN3 7UT |
| Tarrant Way | NN3 7US |
| The Avenue | NN3 7TL NN6 0RH |
| The Crescent | NN3 7UW |
| The Glebe | NN3 7DG |
| The Grove | NN3 7UE NN3 7UF |
| The Laurels | NN3 7EQ |
| The Nurseries | NN3 7SA |
| The Paddocks | NN3 7AS |
| The Roundel | NN6 0AF NN6 0FF |
| Thorpeville | NN3 7TR |
| Wantage Close | NN3 7UY |
| West Street | NN3 7SB |
| Whiting Court | NN3 7QE |
| Woodland Avenue | NN6 0AH NN6 0AJ |
| NN2 8RD |
Transport near Moulton

- FAQ
- Price Paid By Year
- Property Type Price
Frequently asked questions about Moulton
What is the average price for a property for sale in Moulton?
The average price for a property for sale in Moulton is £363,716. This amount is 12% lower than the average price in Northampton. There are 4,333 property listings for sale in Moulton.
What streets have the most expensive properties for sale in Moulton?
The streets with the most expensive properties for sale in Moulton are Grange Lane at an average of £787,666, The Avenue at an average of £705,000 and Sywell Road at an average of £615,558.
What streets have the most affordable properties for sale in Moulton?
The streets with the most affordable properties for sale in Moulton are Whiting Court at an average of £91,500, Crescent Lodge at an average of £187,500 and The Roundel at an average of £206,178.
Which train stations are available in or near Moulton?
Some of the train stations available in or near Moulton are Northampton, Wellingborough and Kettering.
Property Price Paid in Moulton by Year
The average sold property price by year was:
| Year | Average Sold Price | Price Change |
Sold Properties
|
|---|---|---|---|
| 2026 | £337,500 | -2% |
4 Properties |
| 2025 | £343,611 | -7% |
96 Properties |
| 2024 | £366,909 | -7% |
91 Properties |
| 2023 | £393,279 | -10% |
59 Properties |
| 2022 | £431,582 | 25% |
79 Properties |
| 2021 | £325,164 | 3% |
107 Properties |
| 2020 | £314,053 | 10% |
85 Properties |
| 2019 | £281,751 | -11% |
77 Properties |
| 2018 | £312,280 | -2% |
81 Properties |
| 2017 | £319,239 | 16% |
71 Properties |
| 2016 | £268,760 | 2% |
111 Properties |
| 2015 | £263,110 | 4% |
92 Properties |
| 2014 | £253,667 | -1% |
118 Properties |
| 2013 | £257,289 | 6% |
69 Properties |
| 2012 | £241,351 | 10% |
59 Properties |
| 2011 | £217,029 | 0,1% |
51 Properties |
| 2010 | £216,705 | 10% |
48 Properties |
| 2009 | £194,995 | -33% |
54 Properties |
| 2008 | £259,754 | 10% |
66 Properties |
| 2007 | £233,777 | 7% |
85 Properties |
| 2006 | £217,619 | 14% |
96 Properties |
| 2005 | £188,003 | 1% |
94 Properties |
| 2004 | £185,339 | 9% |
105 Properties |
| 2003 | £168,248 | 2% |
111 Properties |
| 2002 | £165,286 | 20% |
107 Properties |
| 2001 | £131,791 | 11% |
103 Properties |
| 2000 | £116,742 | 19% |
85 Properties |
| 1999 | £94,936 | -5% |
113 Properties |
| 1998 | £99,317 | 22% |
97 Properties |
| 1997 | £77,939 | -0,5% |
101 Properties |
| 1996 | £78,323 | 9% |
107 Properties |
| 1995 | £71,339 | - |
73 Properties |
Property Price per Property Type in Moulton
Here you can find historic sold price data in order to help with your property search.
The average Property Paid Price for specific property types in the last three years are:
| Property Type | Average Sold Price | Sold Properties |
|---|---|---|
| Semi Detached House | £295,831.00 | 101 Semi Detached Houses |
| Detached House | £506,933.00 | 94 Detached Houses |
| Terraced House | £265,055.00 | 45 Terraced Houses |
| Flat | £147,077.00 | 10 Flats |