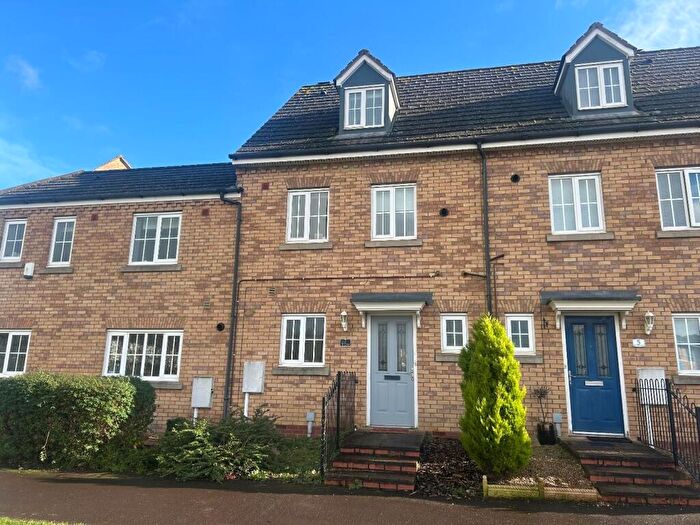
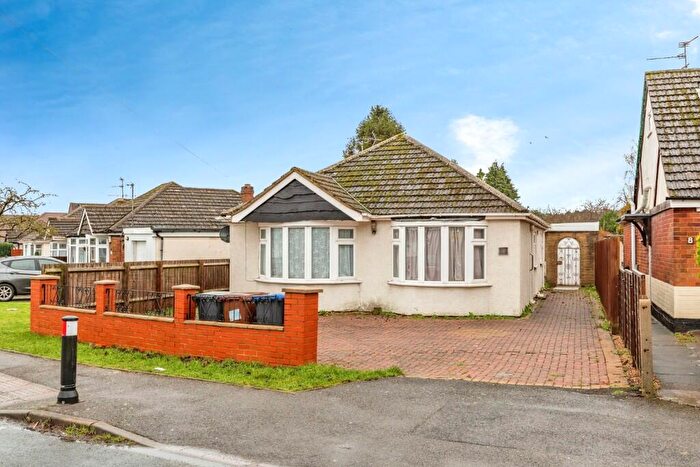
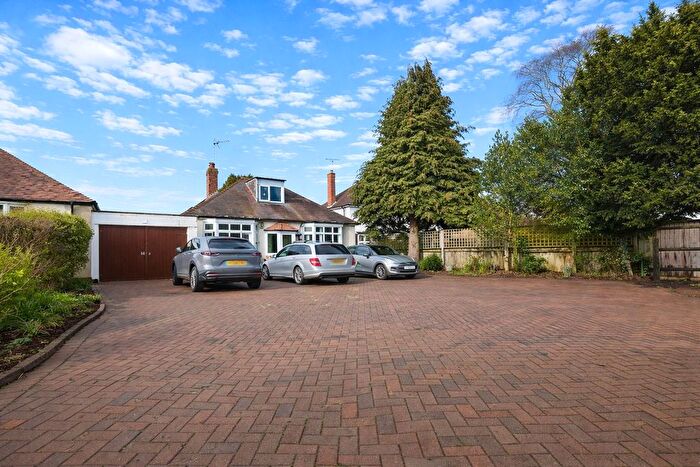
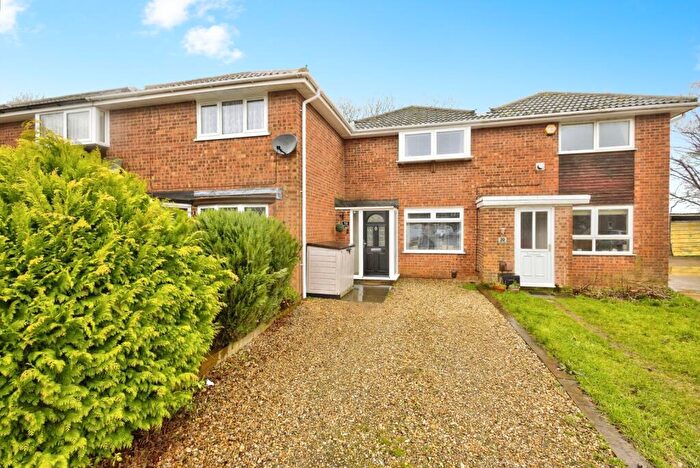
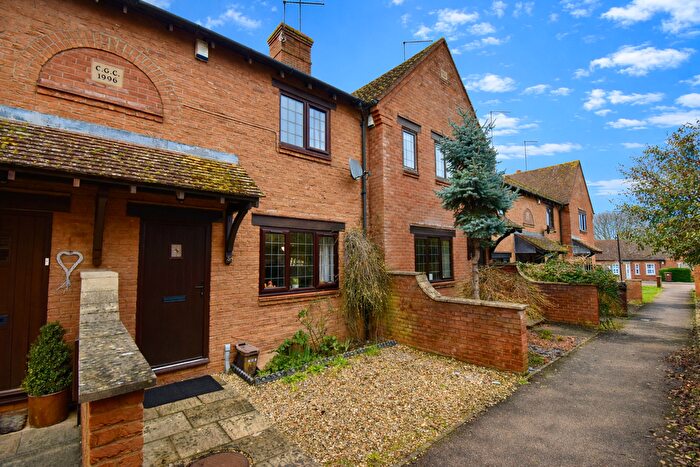
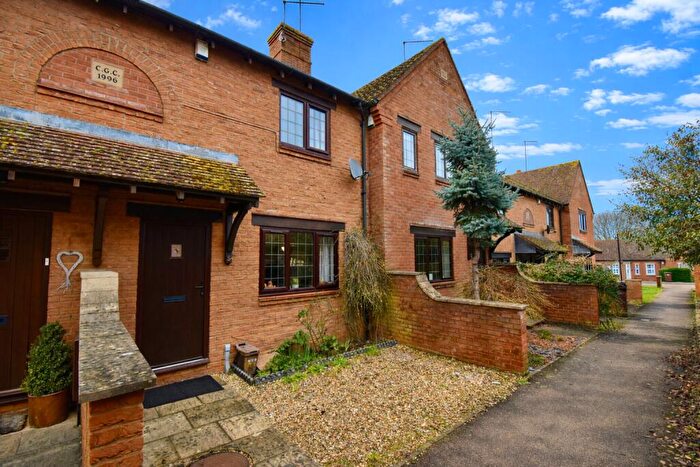
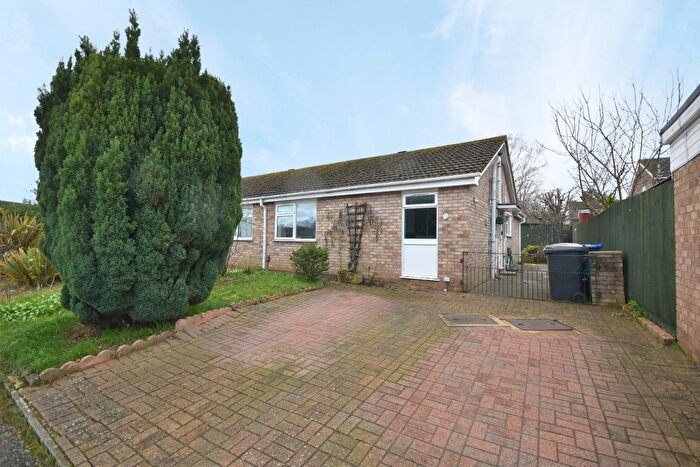
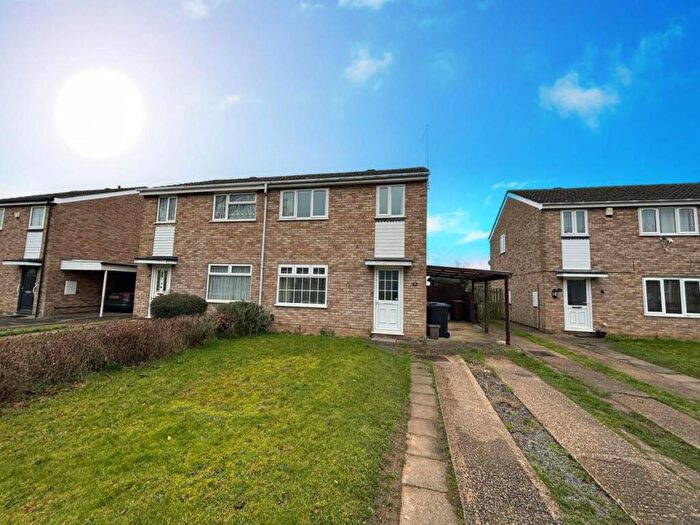
Houses for sale & to rent in Boothville, Northampton
House Prices in Boothville
Properties in Boothville have an average house price of £296,276.00 and had 210 Property Transactions within the last 3 years¹.
Boothville is an area in Northampton, Northamptonshire with 1,707 households², where the most expensive property was sold for £740,000.00.
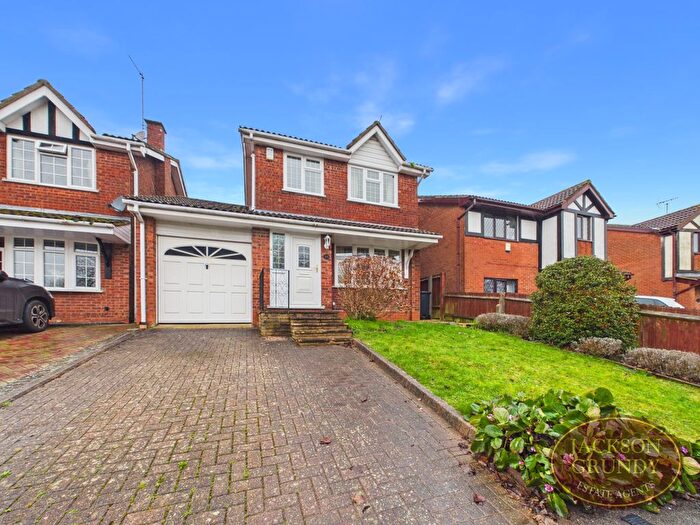
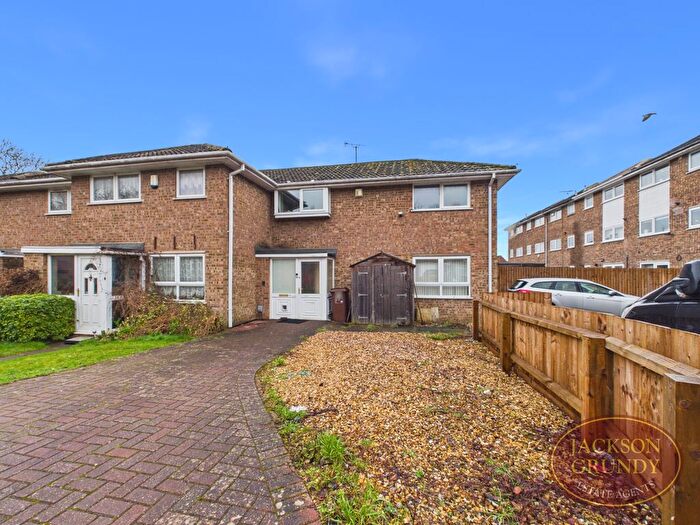
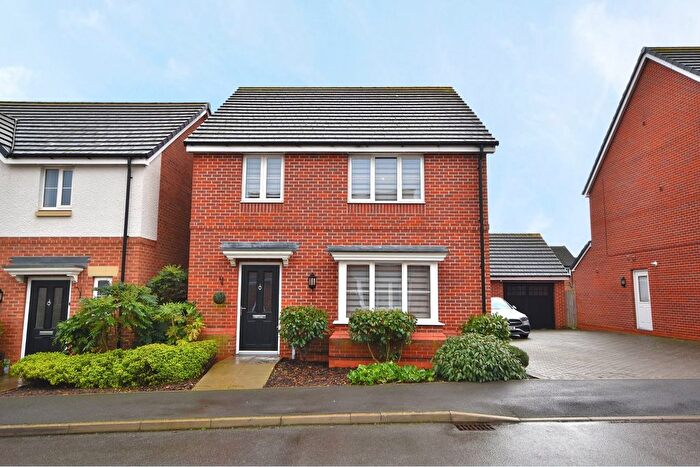
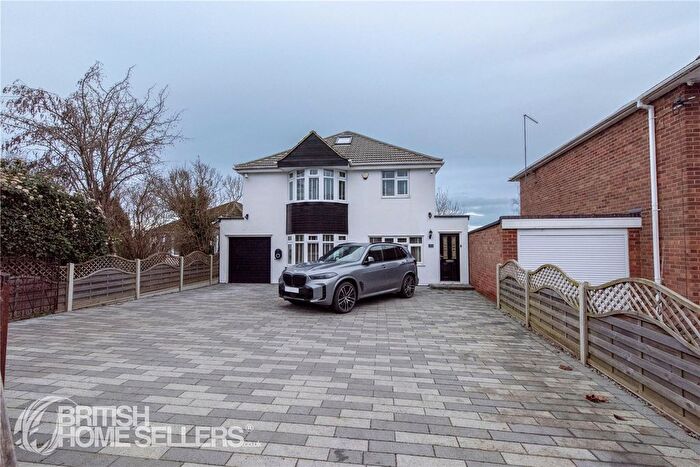
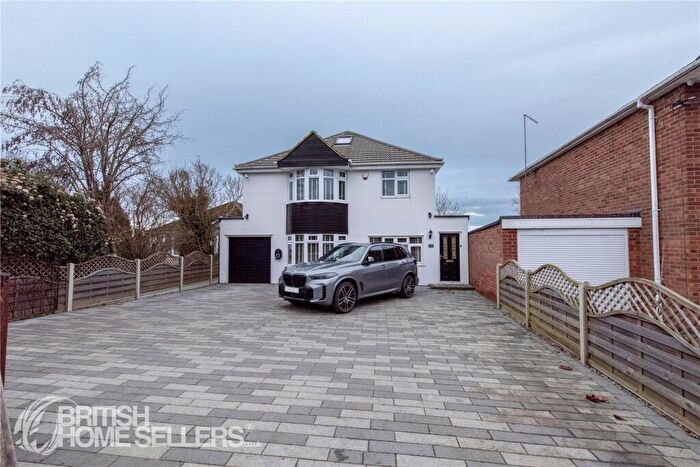
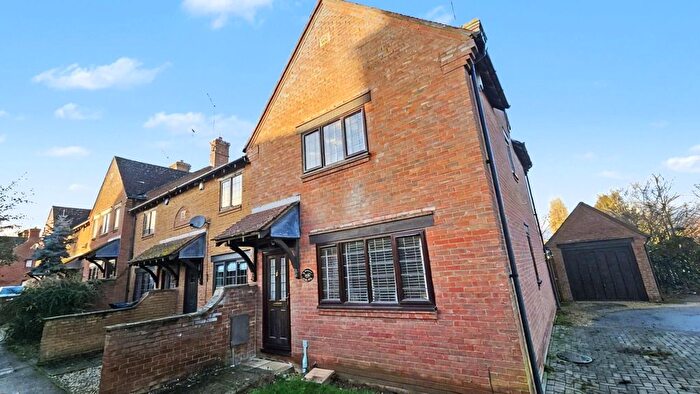
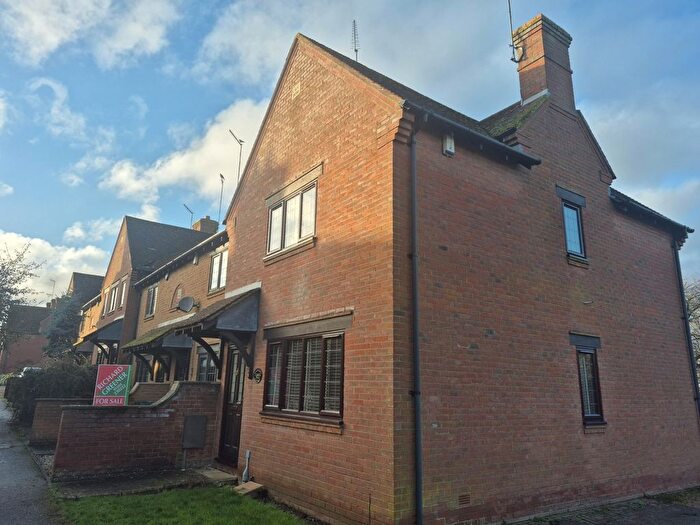
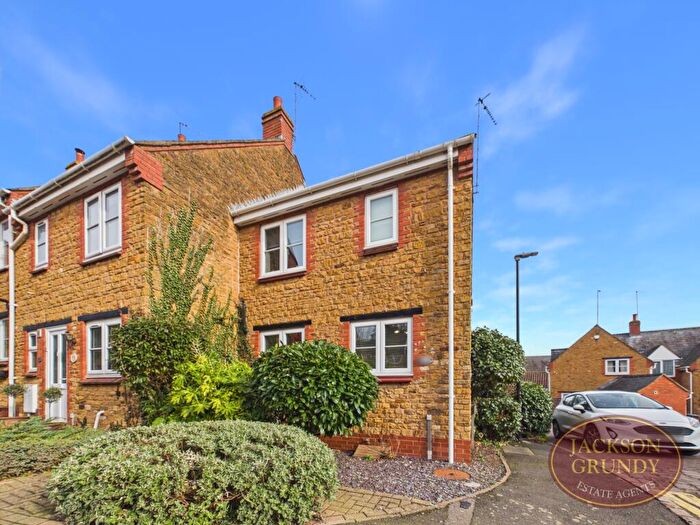
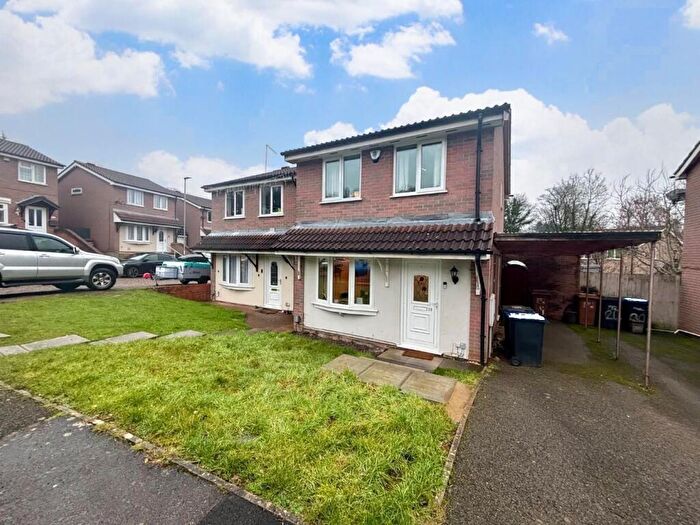
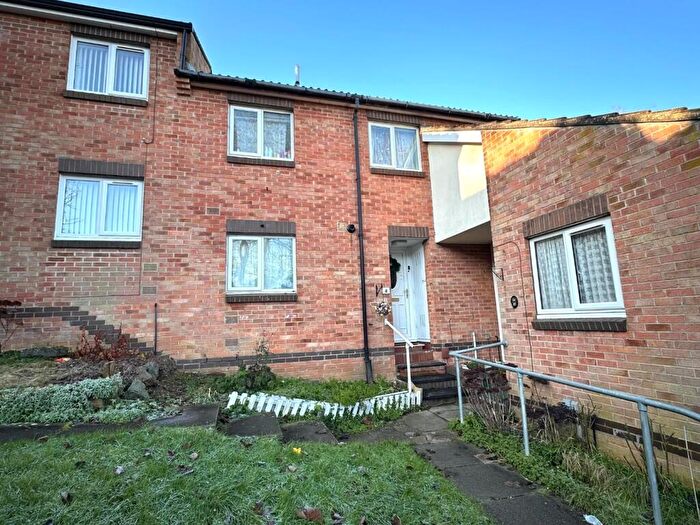
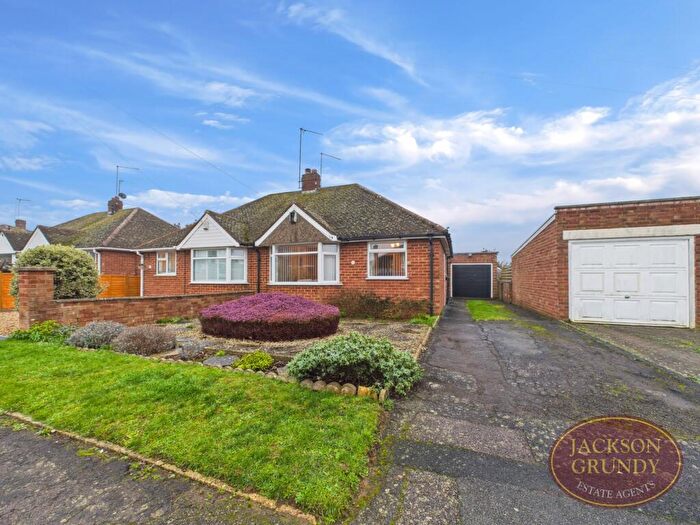
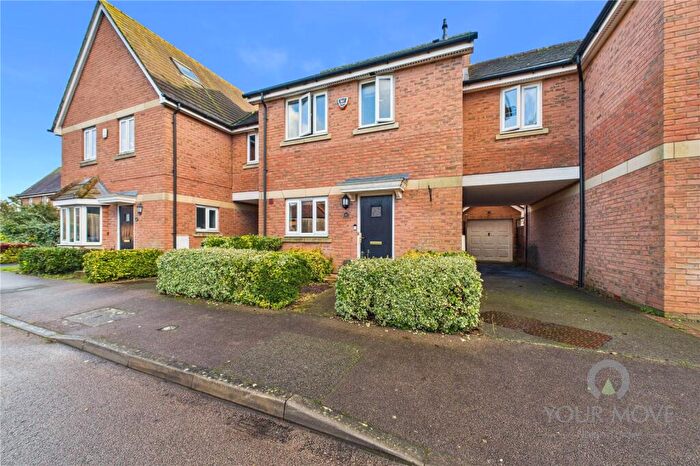
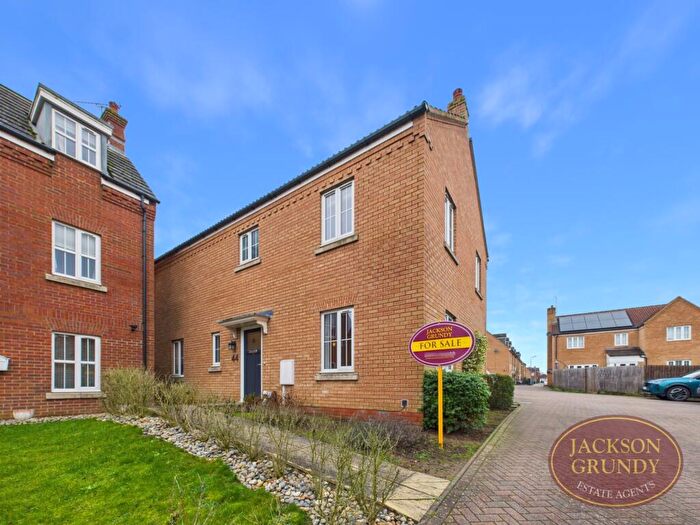
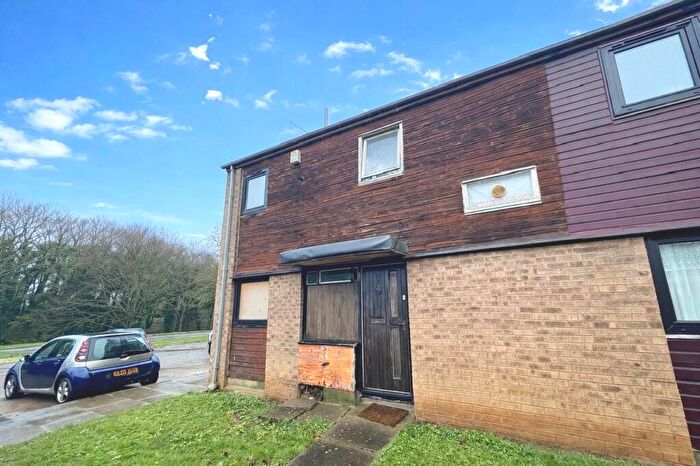
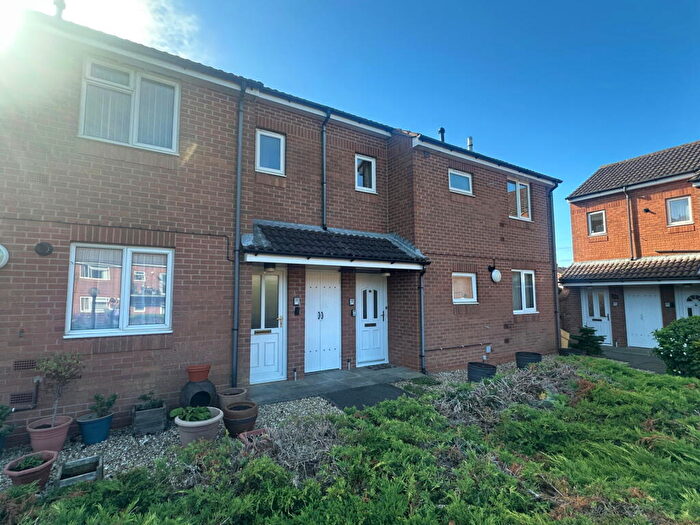
Properties for sale in Boothville
Roads and Postcodes in Boothville
Navigate through our locations to find the location of your next house in Boothville, Northampton for sale or to rent.
| Streets | Postcodes |
|---|---|
| Beech Grove | NN3 6JX NN3 6JY |
| Bibury Crescent | NN3 6AG |
| Booth Lane North | NN3 6JE NN3 6JH NN3 6JQ |
| Booth Park | NN3 6HS NN3 6HU |
| Booth Rise | NN3 6HP NN3 6HR |
| Booth Rise North | NN3 6HQ |
| Boothville Green | NN3 6JR |
| Boughton Lane | NN3 7LE NN3 7RN |
| Burford Avenue | NN3 6AF |
| Copper Leaf Close | NN3 7HS |
| Cottingham Drive | NN3 7LD NN3 7LG |
| Crowberry Avenue | NN3 7BN |
| Cubleigh Close | NN3 7BG |
| East Leys Court | NN3 7TX |
| Edges Court | NN3 7UJ |
| Fernie Field | NN3 7BD |
| Gayhurst Close | NN3 7LQ |
| Green Finch Drive | NN3 7HX |
| Greenway Avenue | NN3 6JP |
| Hallam Close | NN3 7LB |
| Hollow Bank | NN3 7HQ |
| Horsewell Court | NN3 7XB |
| Kendal Close | NN3 6WJ |
| Lowick Court | NN3 7TY NN3 7TZ |
| Lumbertubs Lane | NN3 6AE NN3 6AH |
| Lumbertubs Rise | NN3 6AJ |
| Manning Court | NN3 7HE |
| Manning Road | NN3 7HJ NN3 7XD NN3 7XE NN3 7XF NN3 7AR |
| Medbourne Close | NN3 7LH |
| Moulton Way North | NN3 7RW |
| Moulton Way South | NN3 7RP |
| North Leys Court | NN3 7TQ |
| Northampton Lane South | NN3 7RJ NN3 7RL |
| Oakham Close | NN3 7DE |
| Old Orchard Lane Cottingham Drive | NN3 7LJ |
| Oundle Drive | NN3 7DB NN3 7DD |
| Poplar Court | NN3 6SE |
| Queenswood Avenue | NN3 6JS NN3 6JT NN3 6JU |
| Redwing Avenue | NN3 7BJ |
| Rides Court | NN3 7UA |
| Rowan Avenue | NN3 6JF |
| Russell Square | NN3 7AN |
| Rutland Walk | NN3 7DF |
| Samian Grove | NN3 6HX |
| Talavera Way | NN3 6FR |
| Tamarisk Drive | NN3 7BL |
| Thorpeville | NN3 7TS NN3 7TT |
| Underbank Lane | NN3 7HH |
| Wagtail Close | NN3 7EY |
| West Leys Court | NN3 7UB |
| White Doe Drive | NN3 7HD |
| Woodrush Way | NN3 7HU |
| Woodside Avenue | NN3 6JJ NN3 6JL NN3 6JW |
| Woodside Crescent | NN3 6JN |
| Yewtree Court | NN3 6SF |
Transport near Boothville
- FAQ
- Price Paid By Year
- Property Type Price
Frequently asked questions about Boothville
What is the average price for a property for sale in Boothville?
The average price for a property for sale in Boothville is £296,276. This amount is 3% higher than the average price in Northampton. There are 614 property listings for sale in Boothville.
What streets have the most expensive properties for sale in Boothville?
The streets with the most expensive properties for sale in Boothville are Thorpeville at an average of £610,000, Fernie Field at an average of £591,666 and Beech Grove at an average of £480,000.
What streets have the most affordable properties for sale in Boothville?
The streets with the most affordable properties for sale in Boothville are Samian Grove at an average of £100,333, Booth Park at an average of £104,500 and Manning Court at an average of £120,890.
Which train stations are available in or near Boothville?
Some of the train stations available in or near Boothville are Northampton, Wellingborough and Kettering.
Property Price Paid in Boothville by Year
The average sold property price by year was:
| Year | Average Sold Price | Price Change |
Sold Properties
|
|---|---|---|---|
| 2025 | £303,698 | 3% |
59 Properties |
| 2024 | £293,625 | 0,2% |
83 Properties |
| 2023 | £293,072 | -5% |
68 Properties |
| 2022 | £306,274 | 4% |
65 Properties |
| 2021 | £292,968 | 7% |
77 Properties |
| 2020 | £272,109 | 13% |
63 Properties |
| 2019 | £235,769 | 6% |
90 Properties |
| 2018 | £221,986 | -11% |
68 Properties |
| 2017 | £245,756 | 10% |
74 Properties |
| 2016 | £221,507 | 11% |
85 Properties |
| 2015 | £196,524 | 4% |
69 Properties |
| 2014 | £188,691 | 5% |
78 Properties |
| 2013 | £178,840 | 3% |
64 Properties |
| 2012 | £173,478 | 11% |
60 Properties |
| 2011 | £154,191 | -6% |
64 Properties |
| 2010 | £163,846 | -1% |
51 Properties |
| 2009 | £165,754 | -1% |
40 Properties |
| 2008 | £168,208 | -14% |
46 Properties |
| 2007 | £192,296 | 7% |
81 Properties |
| 2006 | £179,727 | 16% |
97 Properties |
| 2005 | £150,746 | -7% |
67 Properties |
| 2004 | £161,259 | 7% |
96 Properties |
| 2003 | £150,080 | 21% |
71 Properties |
| 2002 | £118,405 | 21% |
96 Properties |
| 2001 | £94,102 | 4% |
109 Properties |
| 2000 | £90,270 | 19% |
86 Properties |
| 1999 | £73,015 | 7% |
107 Properties |
| 1998 | £67,934 | 5% |
87 Properties |
| 1997 | £64,449 | 13% |
104 Properties |
| 1996 | £55,965 | 1% |
90 Properties |
| 1995 | £55,294 | - |
73 Properties |
Property Price per Property Type in Boothville
Here you can find historic sold price data in order to help with your property search.
The average Property Paid Price for specific property types in the last three years are:
| Property Type | Average Sold Price | Sold Properties |
|---|---|---|
| Semi Detached House | £279,229.00 | 85 Semi Detached Houses |
| Detached House | £357,358.00 | 86 Detached Houses |
| Terraced House | £216,081.00 | 29 Terraced Houses |
| Flat | £148,440.00 | 10 Flats |

