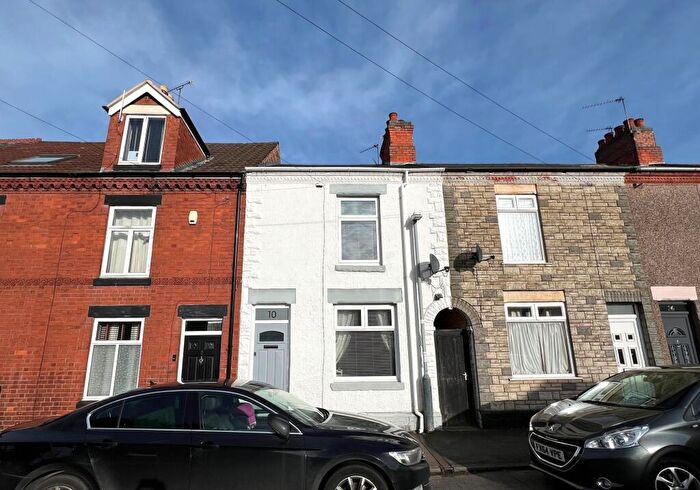
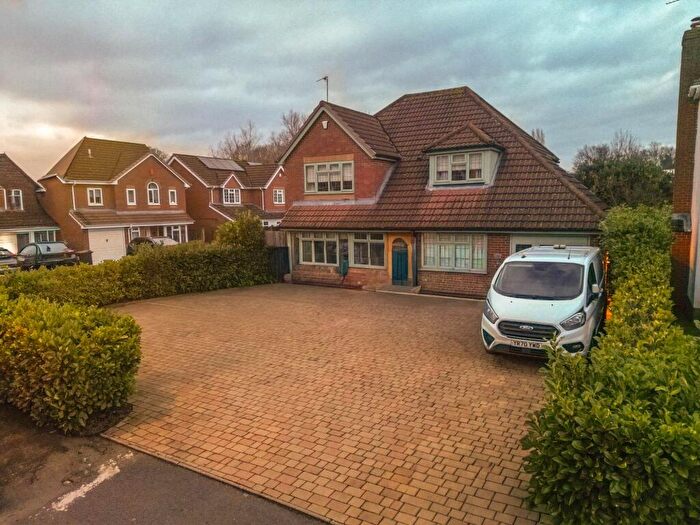
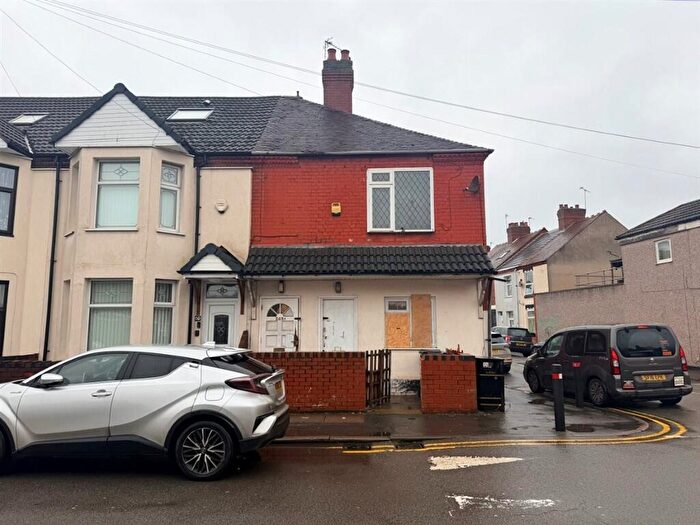
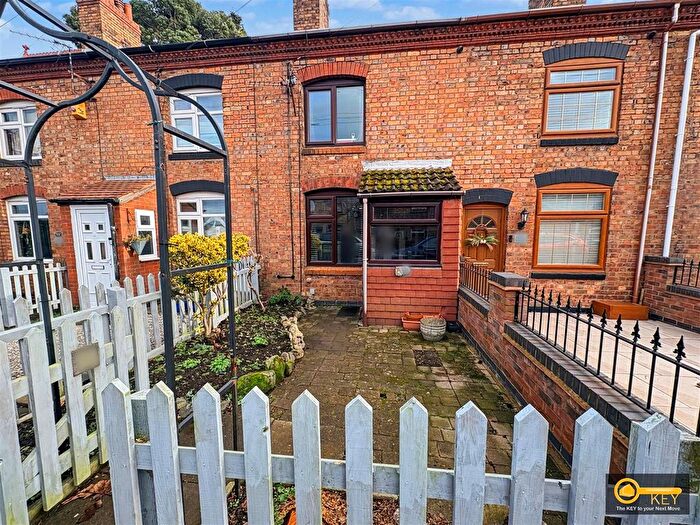
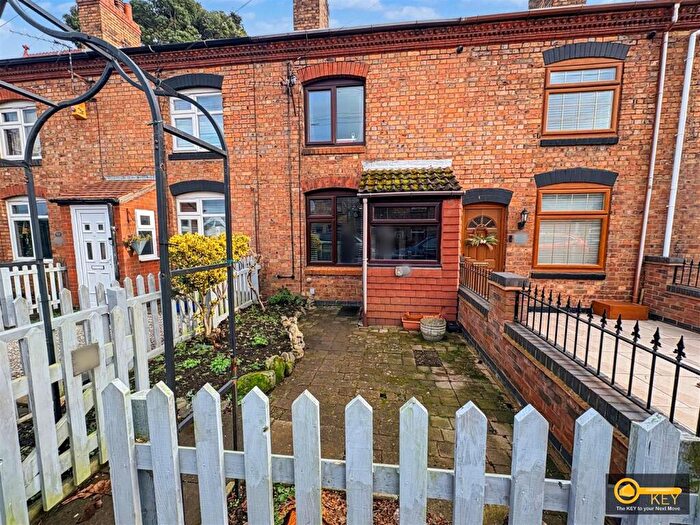
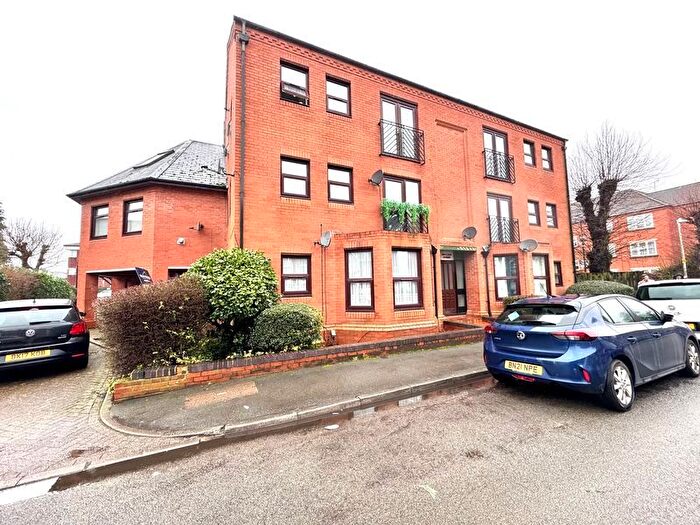
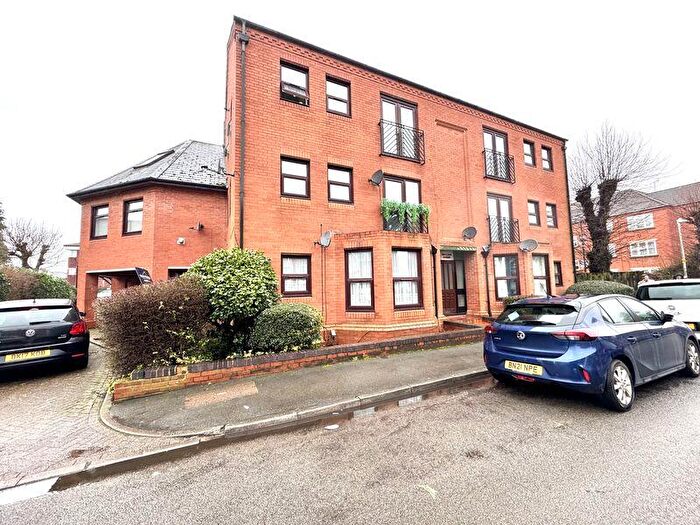
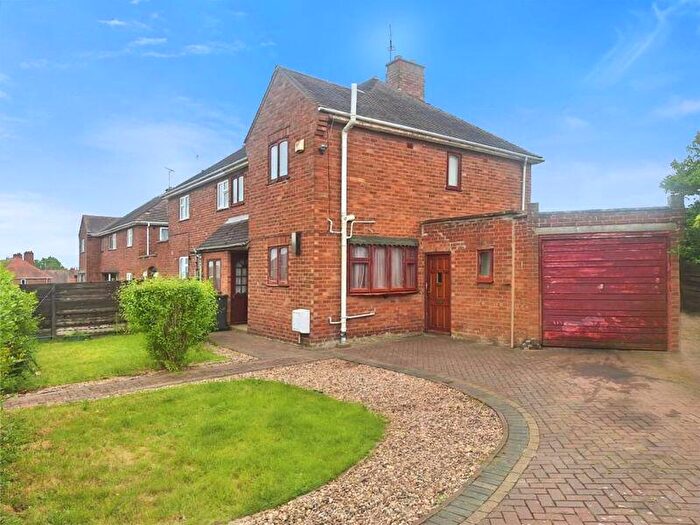
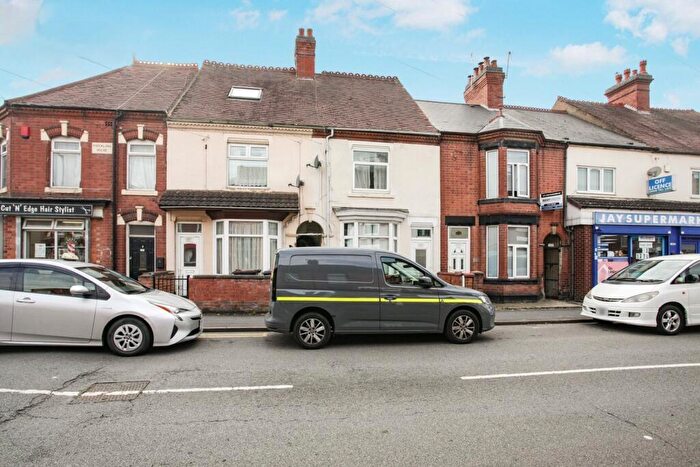
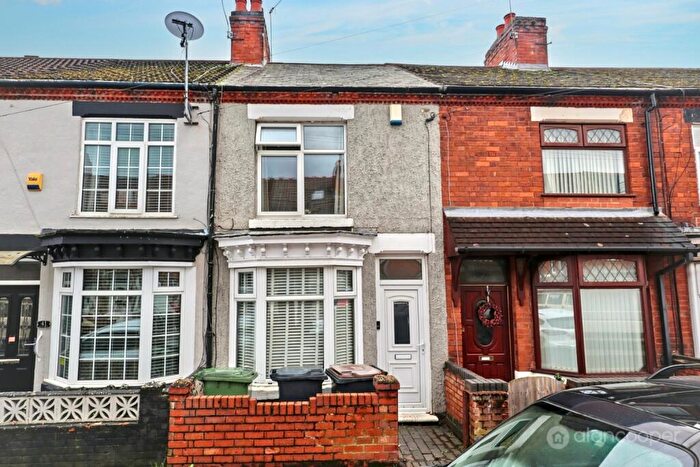
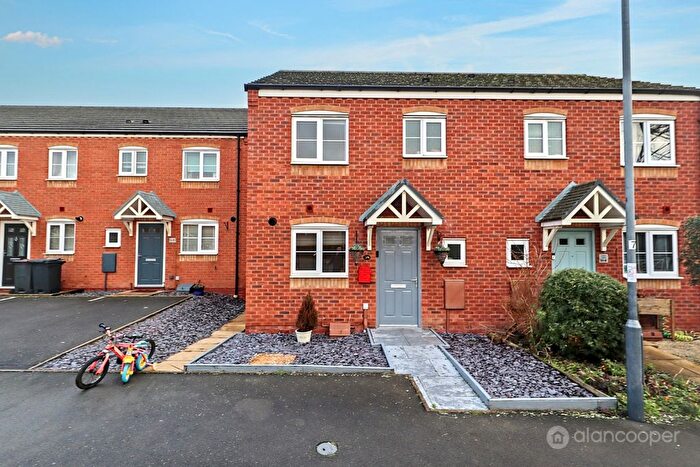
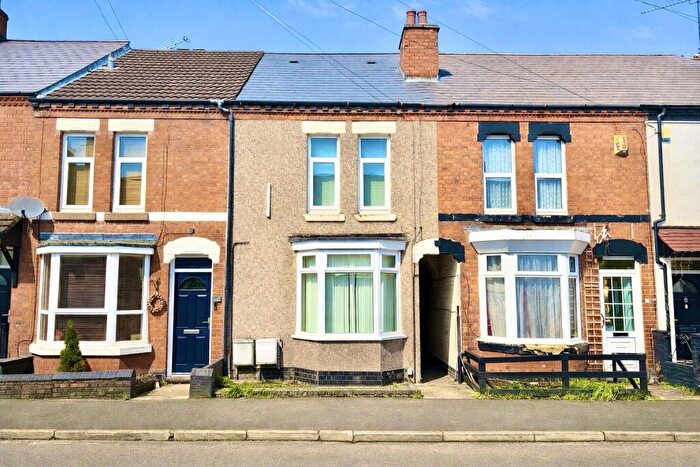
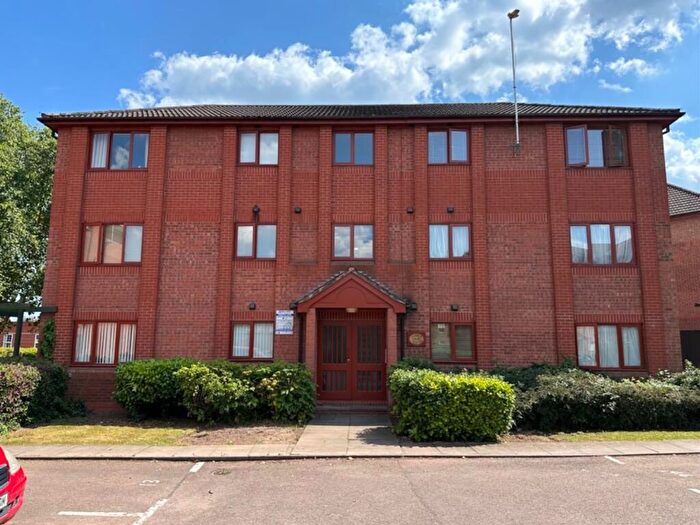
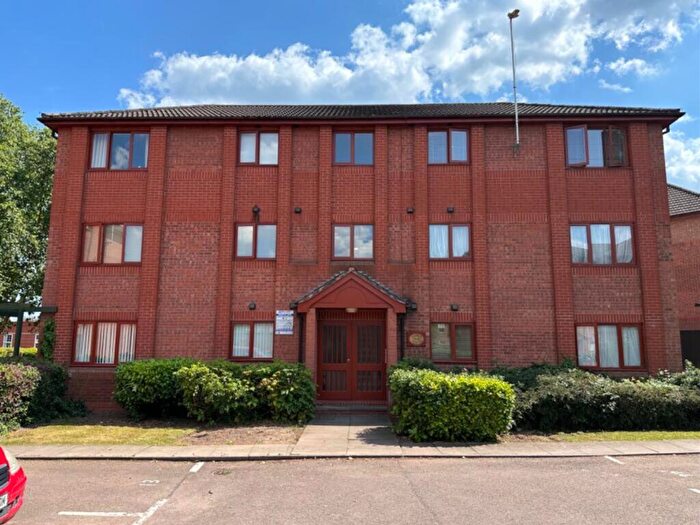
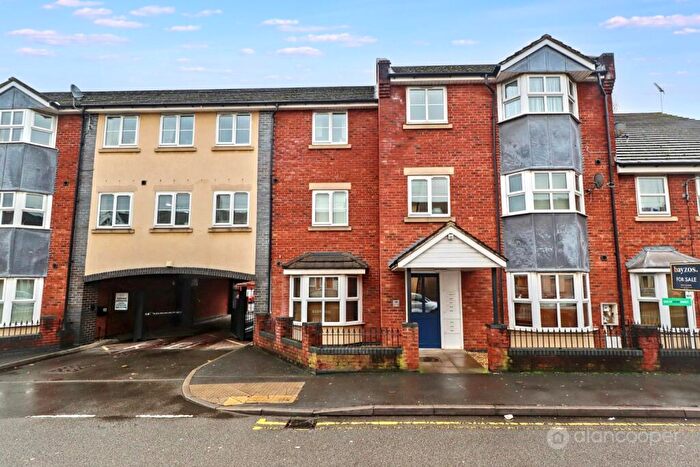
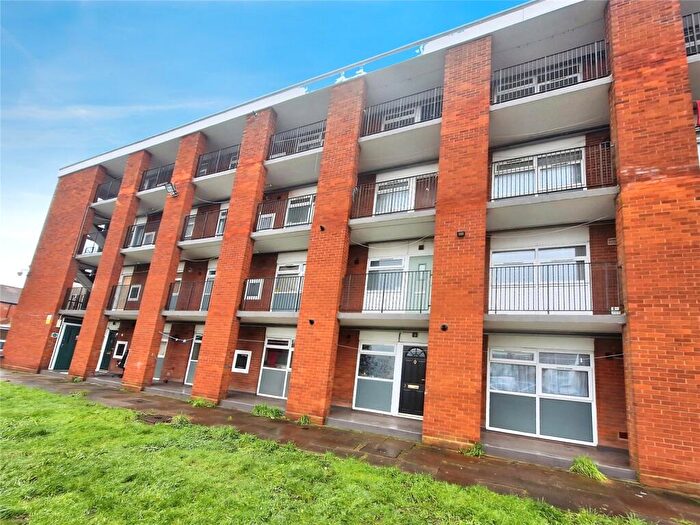
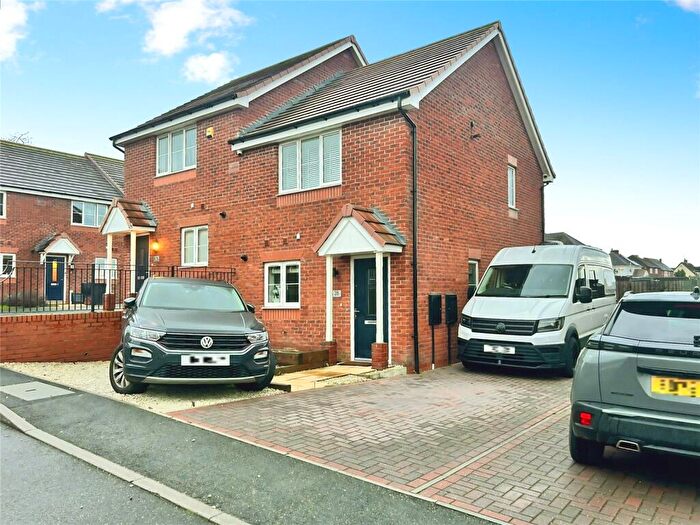
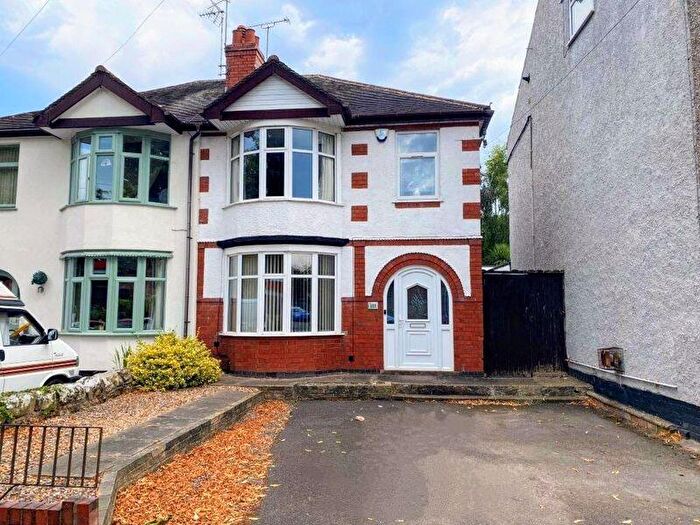
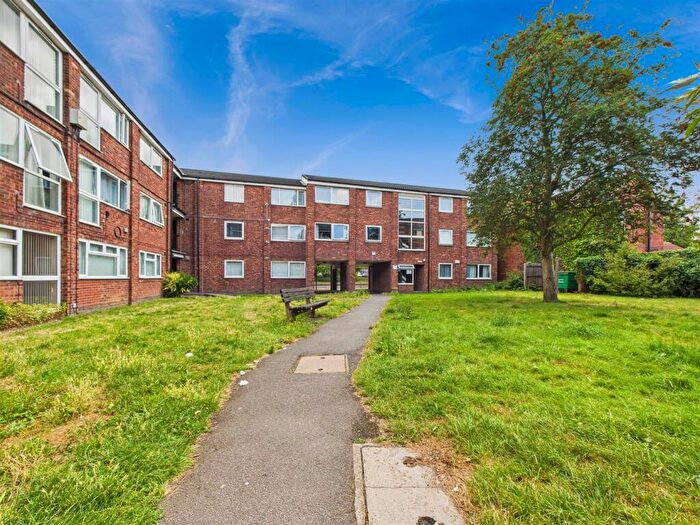
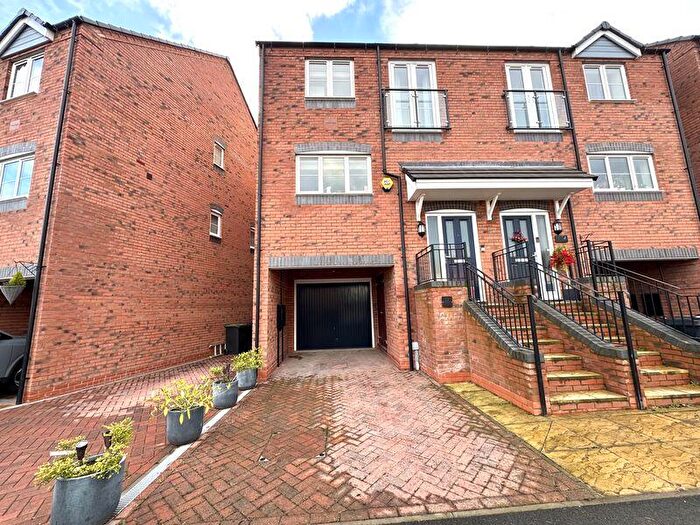
Houses for sale & to rent in Wem Brook, Nuneaton
House Prices in Wem Brook
Properties in Wem Brook have an average house price of £175,315.00 and had 205 Property Transactions within the last 3 years¹.
Wem Brook is an area in Nuneaton, Warwickshire with 3,185 households², where the most expensive property was sold for £405,000.00.
Properties for sale in Wem Brook
Roads and Postcodes in Wem Brook
Navigate through our locations to find the location of your next house in Wem Brook, Nuneaton for sale or to rent.
| Streets | Postcodes |
|---|---|
| Amos Avenue | CV10 7BD |
| Avenue Road | CV11 4NA CV11 4LU CV11 4LX CV11 4LY CV11 4ND |
| Barton Road | CV10 7BN CV10 7BW |
| Bracebridge Street | CV11 5PE |
| Bradestone Road | CV11 4QR CV11 4QS CV11 4QU CV11 4QT |
| Bridge Street | CV11 5UD CV11 5UE |
| Buckingham Close | CV10 7JT |
| Bull Ring | CV10 7BB |
| Burlington Road | CV10 7JR |
| Caldwell Court | CV11 4QQ |
| Caldwell Road | CV11 4QE CV11 4QF CV11 4NB |
| Centrovell Industrial Estate | CV11 4NG |
| Cheverel Place | CV11 5SF |
| Cheverel Street | CV11 5SB CV11 5SD CV11 5SE |
| Clement Street | CV11 5PH |
| Clinic Drive | CV11 5TT |
| College Street | CV10 7BJ CV10 7BL CV10 7BQ |
| Coton Road | CV11 5TW CV11 5UG CV11 5UQ CV11 5HA CV11 5TJ CV11 5TS CV11 5TU CV11 5TX CV11 5TY CV11 5UA CV11 5UF |
| Coventry Road | CV10 7AA CV10 7AB CV10 7AD CV10 7AU CV10 7AX CV10 7BA CV11 4NJ CV11 4NL CV11 4NP |
| Deacon Street | CV11 5SG |
| Discovery Way | CV10 7PS |
| Donnithorne Avenue | CV10 7AE CV10 7AF CV10 7AR CV11 4QJ CV11 4QL |
| Dorlecote Court | CV10 7AS |
| Dorlecote Place | CV10 7AH |
| Dorlecote Road | CV10 7AG CV10 7AQ |
| Dugdale Street | CV11 5QB CV11 5QP CV11 5QD |
| Dunns Close | CV11 4NE CV11 4NF |
| Edward Street | CV11 5QU CV11 5QZ CV11 5RA CV11 5RD CV11 5RP CV11 5RU CV11 5QY |
| Featherstone Close | CV10 7BP |
| Fir Tree Grove | CV11 4QX |
| Firecrest Way | CV11 4DQ |
| Fitton Street | CV11 5RY CV11 5RZ |
| Frank Street | CV11 5RB |
| Franklin Court | CV11 4QW |
| Franklin Road | CV11 4QN |
| George Eliot Street | CV11 4NW |
| Gilfil Road | CV10 7BT CV10 7BU |
| Gipsy Lane | CV10 7PH |
| Gresham Road | CV10 7QR |
| Hadley Mews | CV11 4SF |
| Hanover Glebe | CV11 4NQ |
| Harcourt Gardens | CV11 5UR |
| Harold Street | CV11 5QX |
| Henry Street | CV11 5SQ |
| Hilditch Way | CV11 4LW |
| Home Park Road | CV11 5UB |
| John Street | CV11 5SH |
| Knebley Crescent | CV10 7AT |
| Lydgate Court | CV11 5RR |
| Marner Road | CV10 7BX |
| Marston Lane | CV11 4RD CV11 4RE CV11 4RF CV11 4RH |
| Middlemarch Road | CV10 7BS |
| Morris Drive | CV11 4QH |
| Norman Avenue | CV11 5NZ |
| Poyser Road | CV10 7AP |
| Princes Avenue | CV11 5NT |
| Princes Street | CV11 5NP |
| Raveloe Drive | CV11 4QP |
| Red Deeps | CV11 4QY CV11 4QZ |
| Ribbonbrook | CV11 4LN |
| Riversley Road | CV11 5QS CV11 5QT |
| Rose Lane | CV11 5TR |
| Shepperton Street | CV11 4NN |
| Sorrell Place | CV10 7AY |
| Sorrell Road | CV10 7AN CV10 7AW |
| St Georges Way | CV10 7JS CV10 7JU |
| Stewart Street | CV11 5SA |
| Stoneleigh Gardens | CV11 5QR |
| Sudeley Road | CV10 7AJ |
| The Parade | CV11 5NR |
| Triton Road | CV11 4NR CV11 4RA |
| Tulliver Road | CV10 7AL |
| Villiers Street | CV11 5PJ |
| Watersbridge Gardens | CV10 7TA |
| Wharf Gardens | CV10 7FD |
| CV10 7FB CV10 7TF |
Transport near Wem Brook
- FAQ
- Price Paid By Year
- Property Type Price
Frequently asked questions about Wem Brook
What is the average price for a property for sale in Wem Brook?
The average price for a property for sale in Wem Brook is £175,315. This amount is 26% lower than the average price in Nuneaton. There are 1,010 property listings for sale in Wem Brook.
What streets have the most expensive properties for sale in Wem Brook?
The streets with the most expensive properties for sale in Wem Brook are Ribbonbrook at an average of £350,000, Featherstone Close at an average of £261,250 and Frank Street at an average of £245,000.
What streets have the most affordable properties for sale in Wem Brook?
The streets with the most affordable properties for sale in Wem Brook are Princes Street at an average of £82,333, Coton Road at an average of £85,000 and Harcourt Gardens at an average of £126,000.
Which train stations are available in or near Wem Brook?
Some of the train stations available in or near Wem Brook are Bermuda Park, Nuneaton and Bedworth.
Property Price Paid in Wem Brook by Year
The average sold property price by year was:
| Year | Average Sold Price | Price Change |
Sold Properties
|
|---|---|---|---|
| 2025 | £176,063 | -1% |
58 Properties |
| 2024 | £178,209 | 4% |
82 Properties |
| 2023 | £170,997 | -12% |
65 Properties |
| 2022 | £191,731 | 19% |
76 Properties |
| 2021 | £154,506 | 5% |
81 Properties |
| 2020 | £146,882 | 4% |
72 Properties |
| 2019 | £141,544 | 5% |
85 Properties |
| 2018 | £133,834 | 2% |
106 Properties |
| 2017 | £131,334 | 12% |
89 Properties |
| 2016 | £116,051 | 3% |
78 Properties |
| 2015 | £112,186 | 3% |
70 Properties |
| 2014 | £108,811 | 8% |
76 Properties |
| 2013 | £100,566 | -2% |
61 Properties |
| 2012 | £102,576 | -0,3% |
50 Properties |
| 2011 | £102,858 | 1% |
52 Properties |
| 2010 | £101,400 | 0,2% |
53 Properties |
| 2009 | £101,174 | -9% |
56 Properties |
| 2008 | £110,661 | -6% |
60 Properties |
| 2007 | £117,187 | 8% |
136 Properties |
| 2006 | £108,354 | 3% |
149 Properties |
| 2005 | £105,477 | 11% |
95 Properties |
| 2004 | £93,988 | 24% |
151 Properties |
| 2003 | £71,707 | 22% |
125 Properties |
| 2002 | £55,758 | 3% |
132 Properties |
| 2001 | £53,990 | 21% |
129 Properties |
| 2000 | £42,804 | 8% |
83 Properties |
| 1999 | £39,470 | -13% |
88 Properties |
| 1998 | £44,650 | 14% |
112 Properties |
| 1997 | £38,283 | 12% |
64 Properties |
| 1996 | £33,804 | -8% |
82 Properties |
| 1995 | £36,599 | - |
85 Properties |
Property Price per Property Type in Wem Brook
Here you can find historic sold price data in order to help with your property search.
The average Property Paid Price for specific property types in the last three years are:
| Property Type | Average Sold Price | Sold Properties |
|---|---|---|
| Semi Detached House | £196,836.00 | 69 Semi Detached Houses |
| Detached House | £289,900.00 | 10 Detached Houses |
| Terraced House | £160,500.00 | 106 Terraced Houses |
| Flat | £122,300.00 | 20 Flats |

