
Houses for sale in Nuneaton, Warwickshire
House Prices in Nuneaton
Properties in Nuneaton have an average house price of £237k and had 3,948 Property Transactions within the last 3 years.¹
Nuneaton is an area in Warwickshire with 41,104 households², where the most expensive property was sold for £1.45M.
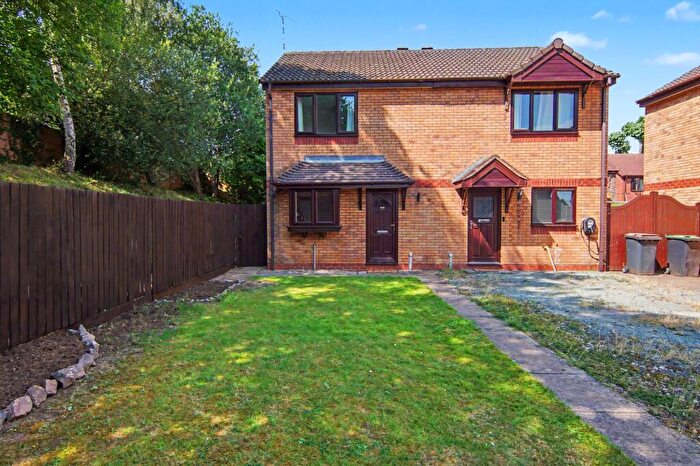
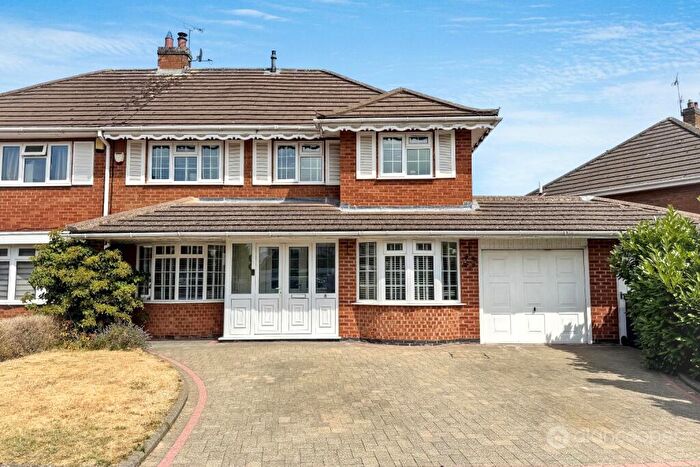
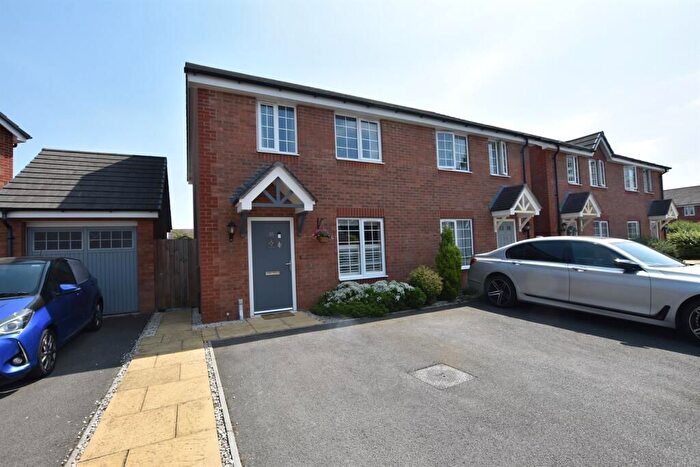
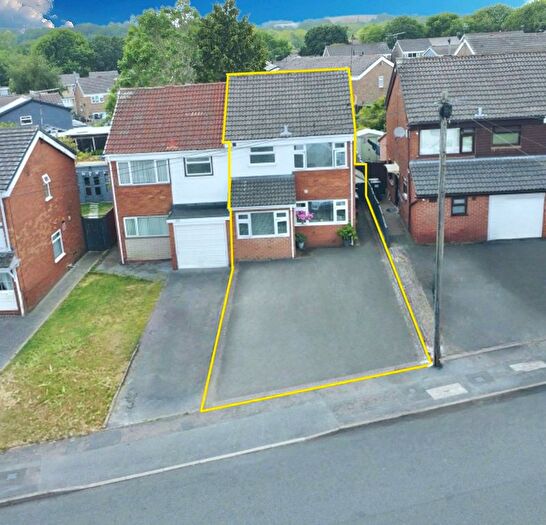
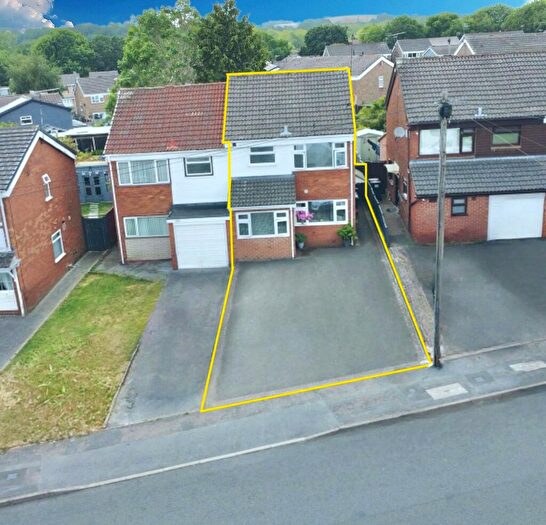
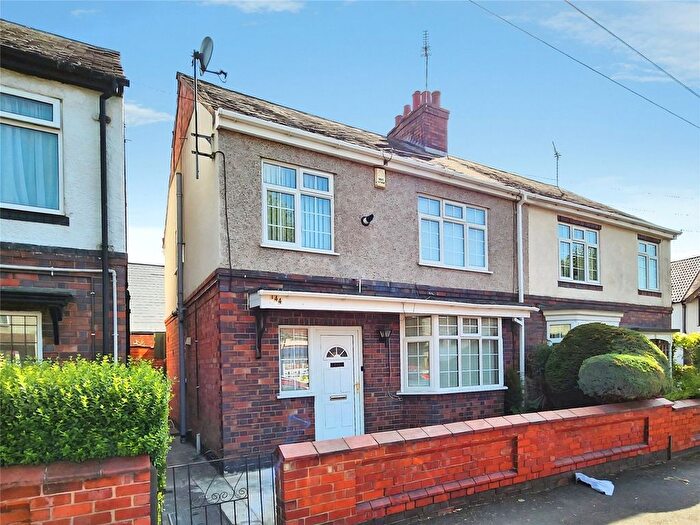
Properties for sale in Nuneaton
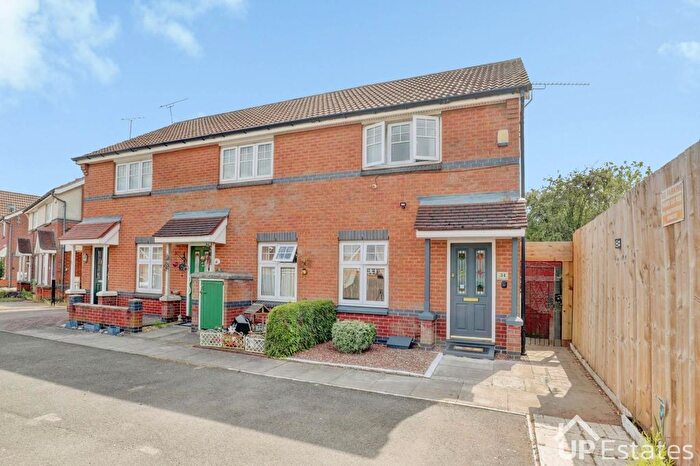

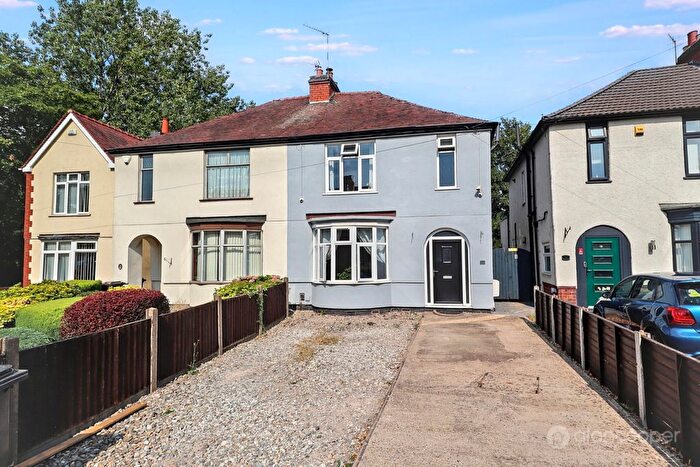
![]()
If you are looking to sell your house, let it out, or receive a property valuation, an expert can help you.
Click the button below to get started.


Neighbourhoods in Nuneaton
Navigate through our locations to find the location of your next house in Nuneaton, Warwickshire for sale or to rent.
Property price trends in Nuneaton
According to the latest Land Registry data, the average home in Nuneaton sold for £244,602 in 2026. That figure comes from a substantial record of 48,869 sales logged over the past 31 years.
Prices have moved up over the last three years. Compared with 2023, when the typical sale came in around £234,985, that's a rise of roughly 4.1%.
Looking back five years, average prices are up about 11.8% since 2021, a gain of around £25,780 in cash terms.
Zoom out to the past decade for the fuller picture. Back in 2016, homes here averaged £174,634, so the typical sold price has climbed about 40.1% since then, roughly 3.4% a year. Stretch the view to fifteen years and that annual pace edges up closer to 3.7%.
Frequently asked questions about Nuneaton
What is the average price for a property for sale in Nuneaton?
The average price for a property for sale in Nuneaton is £237,445. This amount is 31% lower than the average price in Warwickshire. There are more than 10,000 property listings for sale in Nuneaton.
What locations have the most expensive properties for sale in Nuneaton?
The locations with the most expensive properties for sale in Nuneaton are Wolvey And Shilton at an average of £417,285, St Nicolas at an average of £336,982 and Whitestone at an average of £318,525.
What locations have the most affordable properties for sale in Nuneaton?
The locations with the most affordable properties for sale in Nuneaton are Abbey at an average of £169,263, Wem Brook at an average of £174,344 and Atherstone South And Mancetter at an average of £184,433.
Which train stations are available in or near Nuneaton?
Some of the train stations available in or near Nuneaton are Nuneaton, Bermuda Park and Bedworth.
Property Price Paid in Nuneaton by Year
The average sold property price by year was:
| Year | Average Sold Price | Price Change |
Sold Properties
|
|---|---|---|---|
| 2026 | £244,602 | 1% |
86 Properties |
| 2025 | £242,546 | 3% |
1,240 Properties |
| 2024 | £234,634 | -0,1% |
1,399 Properties |
| 2023 | £234,985 | 0,4% |
1,223 Properties |
| 2022 | £233,935 | 6% |
1,579 Properties |
| 2021 | £218,822 | 2% |
1,824 Properties |
| 2020 | £214,984 | 6% |
1,561 Properties |
| 2019 | £202,023 | 2% |
1,979 Properties |
| 2018 | £197,943 | 8% |
1,962 Properties |
| 2017 | £182,803 | 4% |
1,759 Properties |
Property Price per Property Type in Nuneaton
Here you can find historic sold price data in order to help with your property search.
The average Property Paid Price for specific property types in the last three years are:
| Property Type | Average Sold Price | Sold Properties |
|---|---|---|
| Semi Detached House | £229,775.00 | 1,444 Semi Detached Houses |
| Terraced House | £171,918.00 | 1,179 Terraced Houses |
| Detached House | £350,091.00 | 1,065 Detached Houses |
| Flat | £115,770.00 | 260 Flats |
Transport in Nuneaton
Please see below transportation links in this area:
