
Houses for sale in B93 0BB, Netherwood Lane, Lapworth, Solihull
House Prices in B93 0BB, Netherwood Lane, Lapworth
Properties in B93 0BB have an average house price of £930k and had 1 Property Transaction within the last 3 years.¹ B93 0BB is a postcode in Netherwood Lane located in Lapworth, an area in Solihull, Warwickshire, with 3 households², where the most expensive property was sold for £930k.
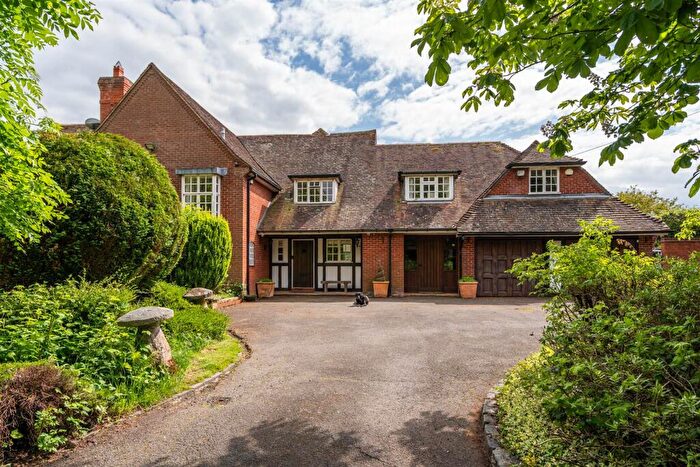
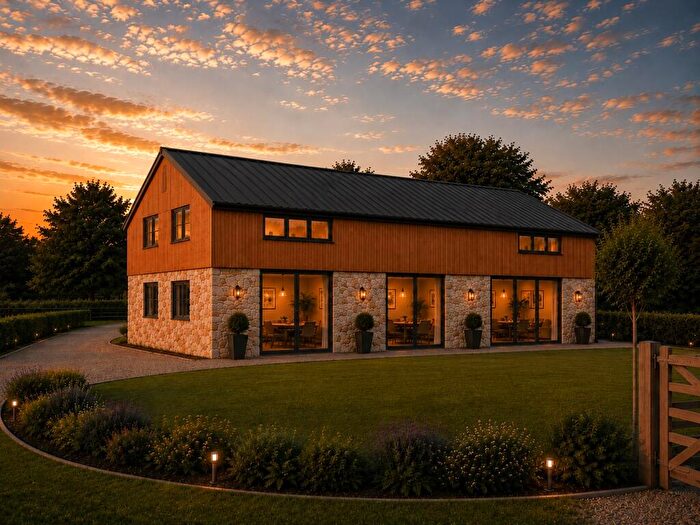
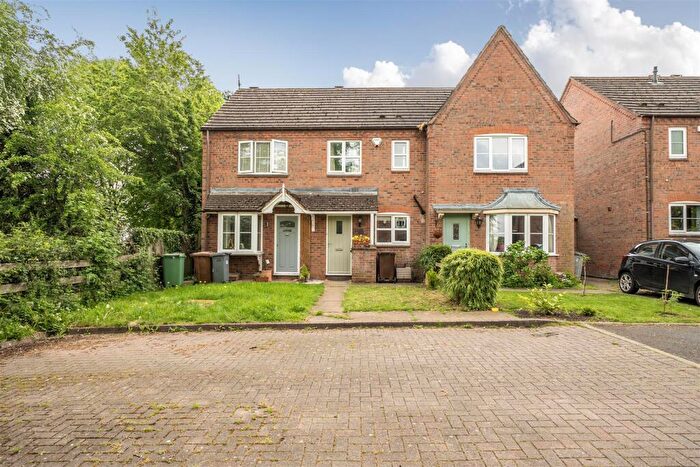
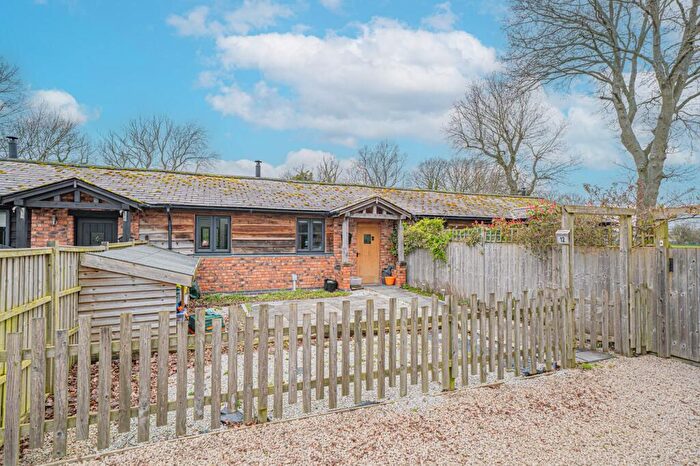
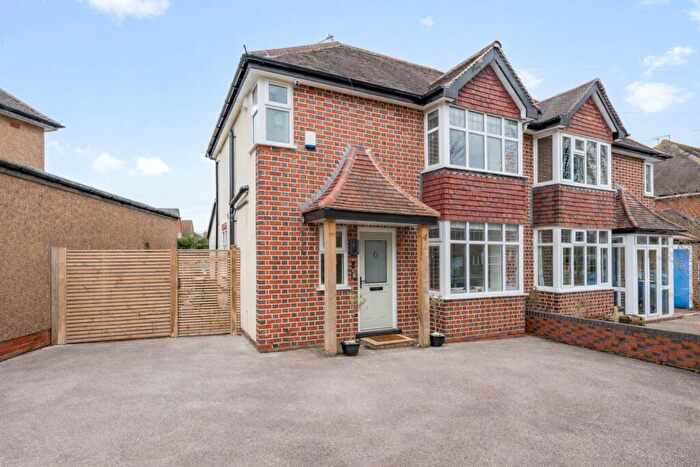
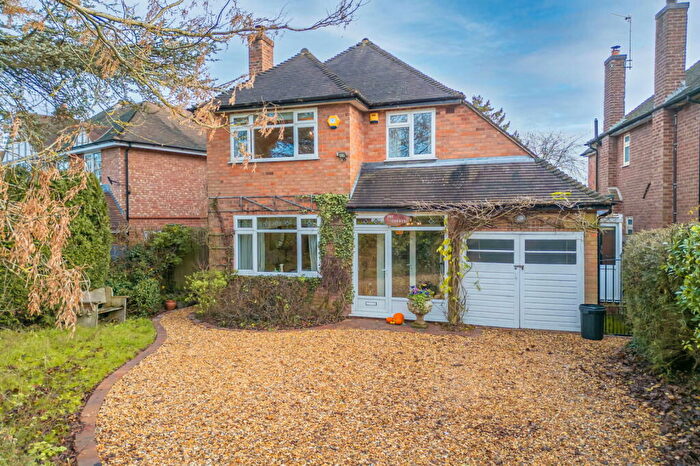
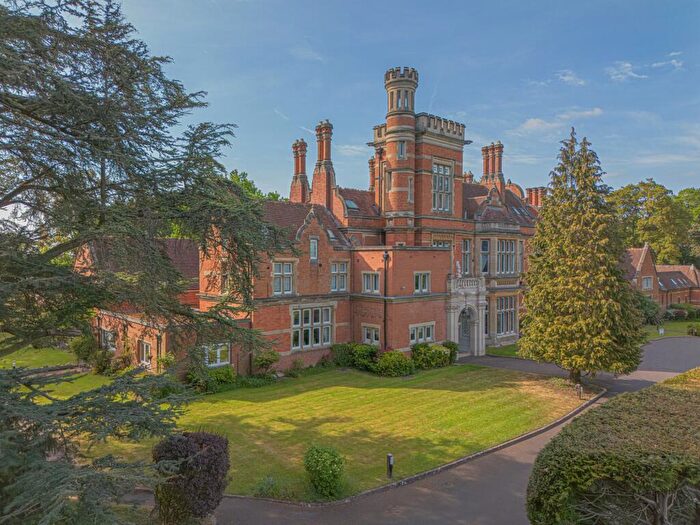
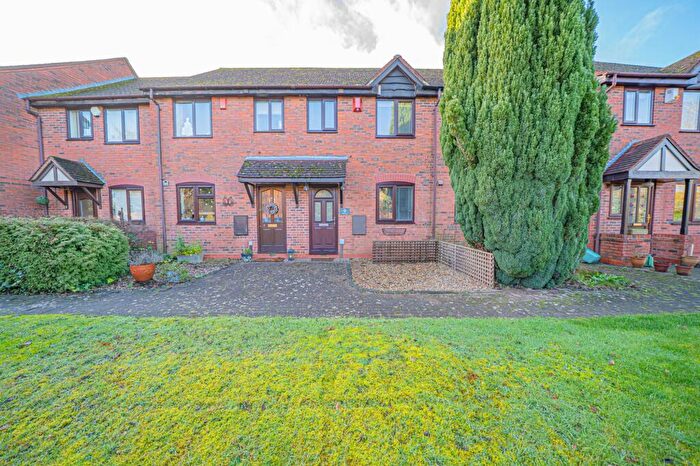
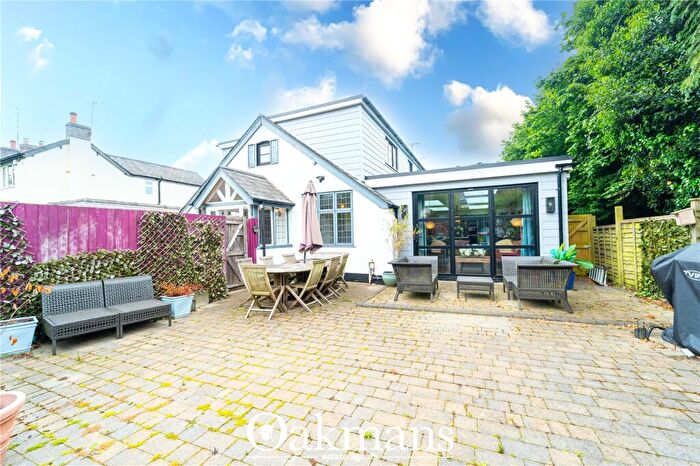
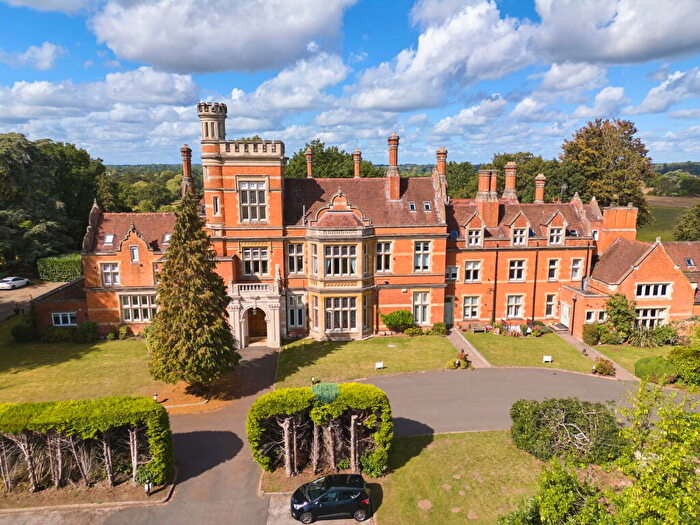
Properties for sale near B93 0BB, Netherwood Lane
![]()
If you are looking to sell your house, let it out, or receive a property valuation, an expert can help you.
Click the button below to get started.
Price Paid in Netherwood Lane, B93 0BB, Lapworth
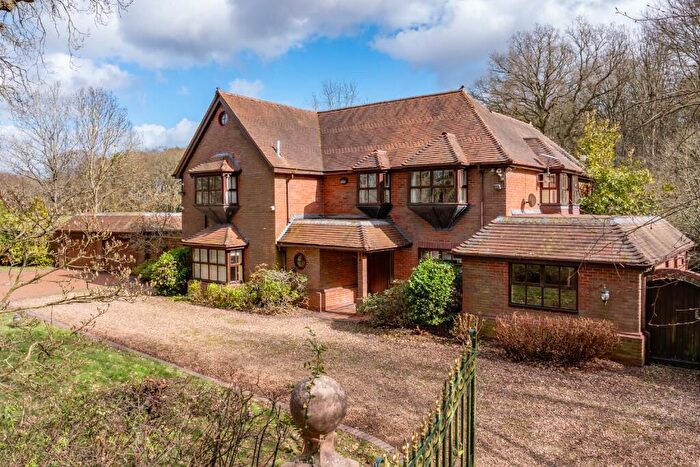
THE GRANARY Netherwood Lane, B93 0BB, Lapworth Solihull
Property THE GRANARY has been sold 1 time. The last time it was sold was in 05/12/2024 and the sold price was £930,000.00.
This detached house, sold as a freehold on 05/12/2024, is a 163 sqm detached house with an EPC rating of F.
| Date | Price | Property Type | Tenure | Classification |
|---|---|---|---|---|
| 05/12/2024 | £930,000.00 | Detached House | freehold | Established Building |
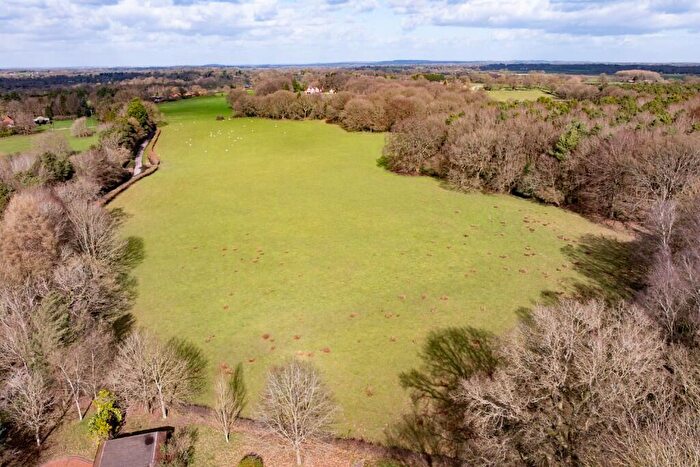
NETHERWOOD HEATH FARMHOUSE Netherwood Lane, B93 0BB, Lapworth Solihull
Property NETHERWOOD HEATH FARMHOUSE has been sold 1 time. The last time it was sold was in 09/12/2014 and the sold price was £1,150,000.00.
This is a Detached House which was sold as a freehold in 09/12/2014
| Date | Price | Property Type | Tenure | Classification |
|---|---|---|---|---|
| 09/12/2014 | £1,150,000.00 | Detached House | freehold | Established Building |
HOMER HOUSE Netherwood Lane, B93 0BB, Lapworth Solihull
Property HOMER HOUSE has been sold 1 time. The last time it was sold was in 18/07/2001 and the sold price was £560,000.00.
This is a Detached House which was sold as a freehold in 18/07/2001
| Date | Price | Property Type | Tenure | Classification |
|---|---|---|---|---|
| 18/07/2001 | £560,000.00 | Detached House | freehold | Established Building |
Property price trends in B93 0BB, Netherwood Lane
According to the latest Land Registry data, the average home in B93 0BB, Netherwood Lane sold for £930,000 in 2024. That figure comes from 3 sales logged over the past 23 years.
Zoom out to the past decade for the fuller picture. Back in 2014, homes here averaged £1,150,000, so the typical sold price has fallen about 19.1% since then, around 2.1% a year lower.
Property Price Paid in B93 0BB, Netherwood Lane by Year
The average sold property price by year was:
| Year | Average Sold Price | Price Change |
Sold Properties
|
|---|---|---|---|
| 2024 | £930,000 | -24% |
1 Property |
| 2014 | £1,150,000 | 51% |
1 Property |
| 2001 | £560,000 | - |
1 Property |
Property Price per Property Type in B93 0BB, Netherwood Lane
Here you can find historic sold price data in order to help with your property search.
The average Property Paid Price for specific property types in the last three years are:
| Property Type | Average Sold Price | Sold Properties |
|---|---|---|
| Detached House | £930,000.00 | 1 Detached House |
