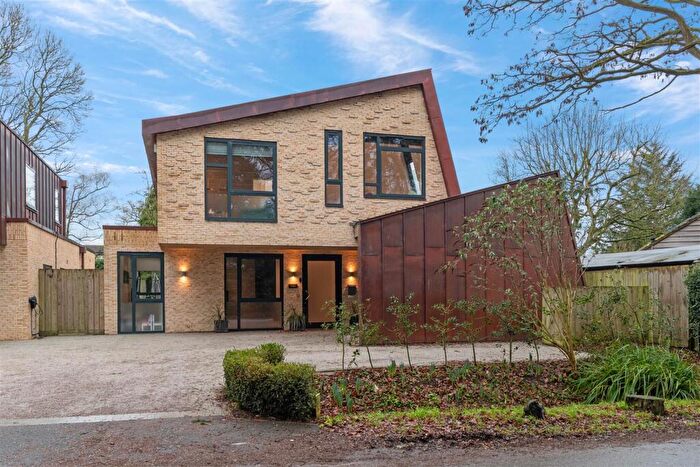
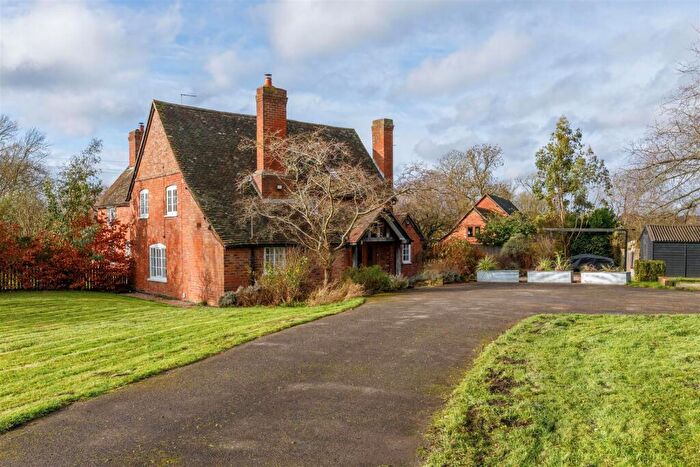
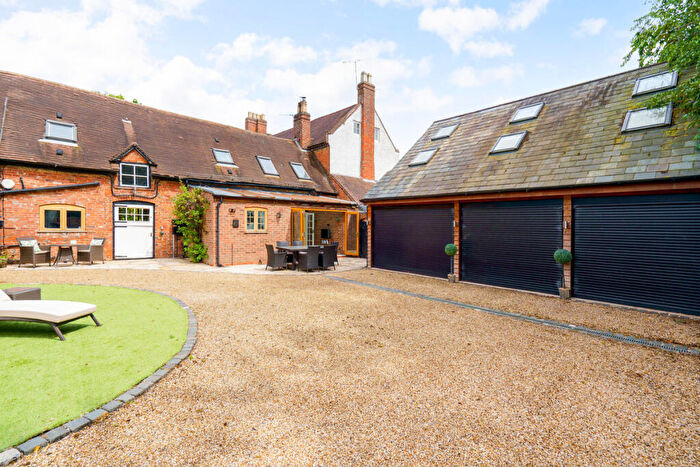
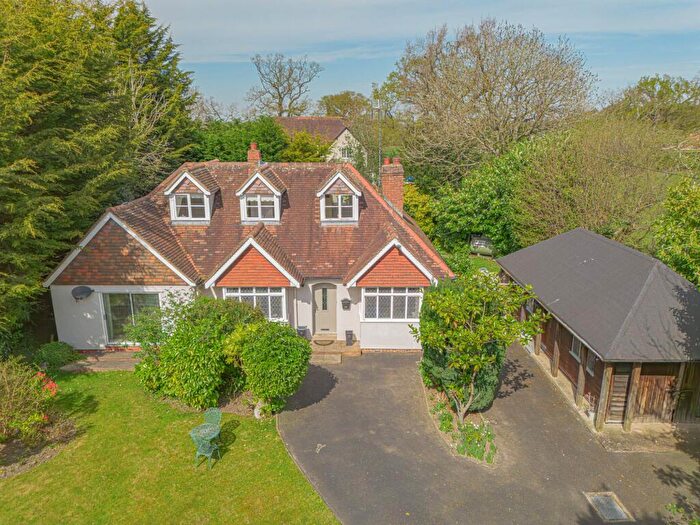
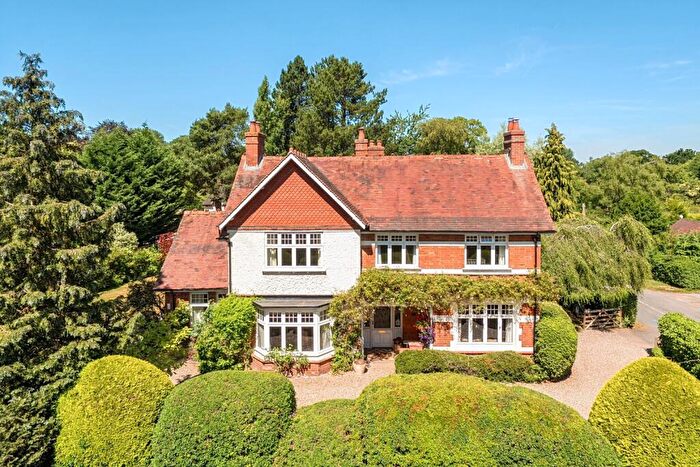
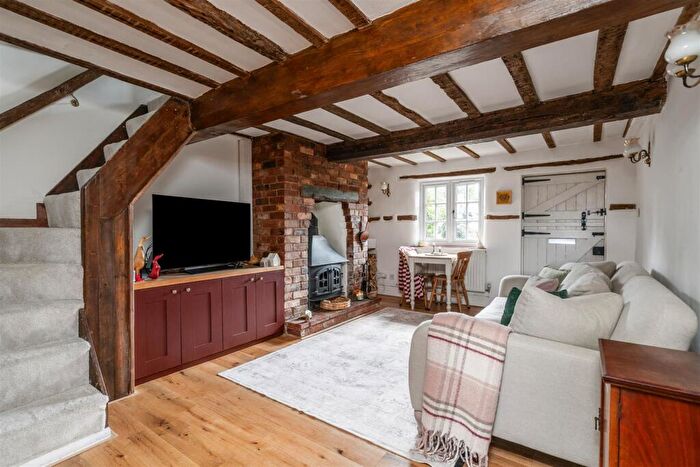
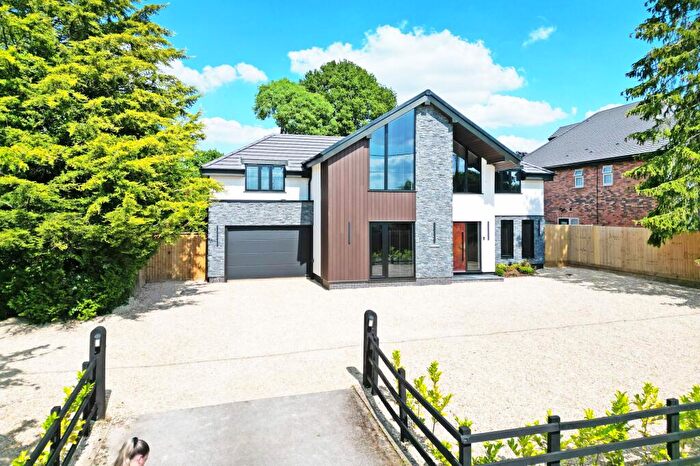
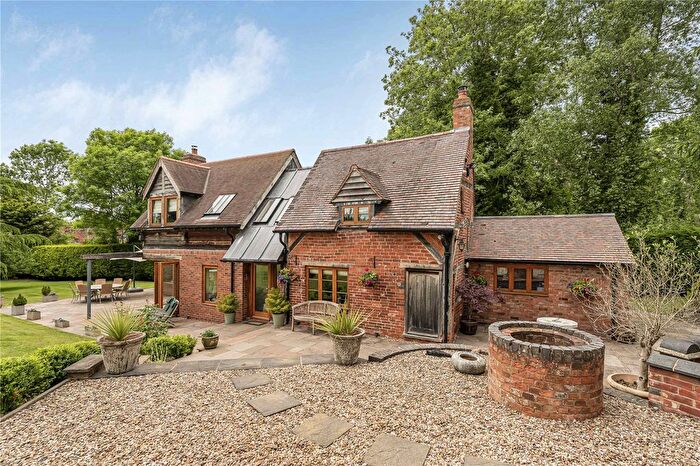
Houses for sale & to rent in Lapworth, Warwick
House Prices in Lapworth
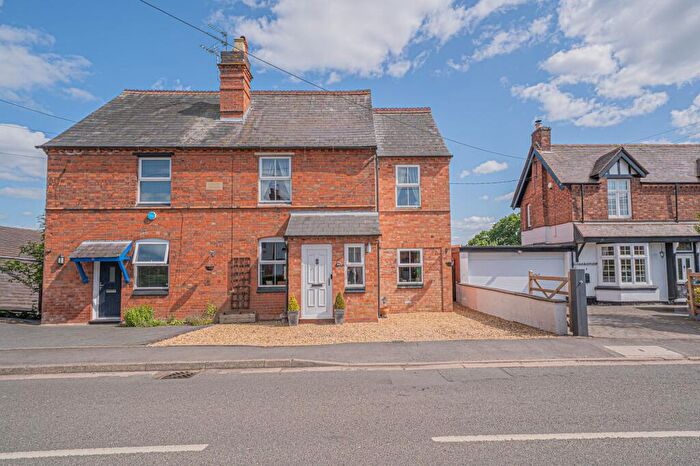
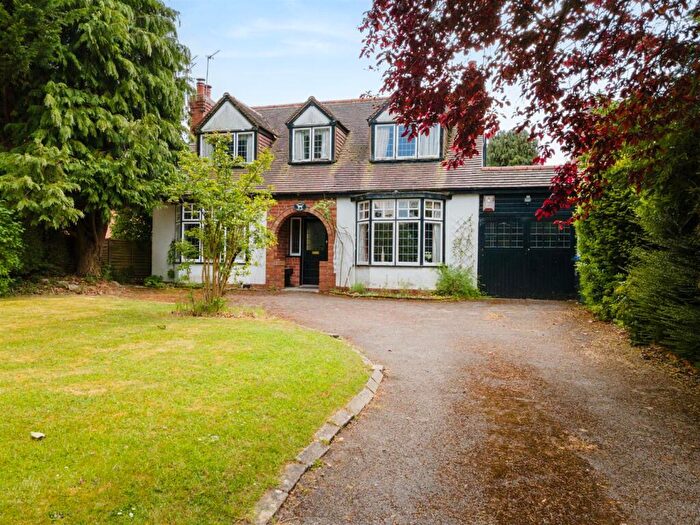
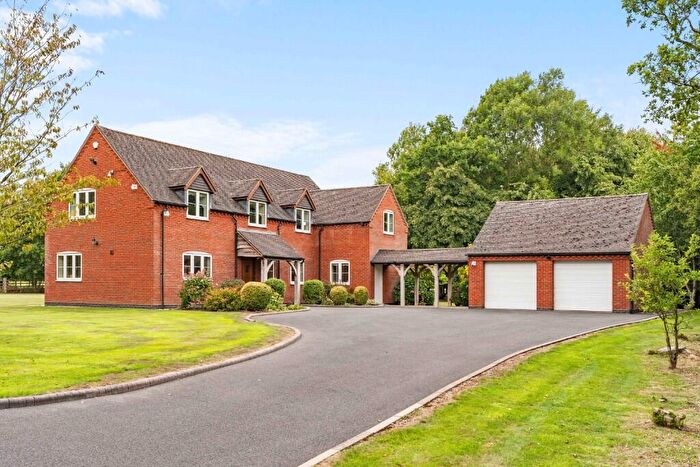
Properties in Lapworth have an average house price of £740,304.00 and had 14 Property Transactions within the last 3 years¹.
Lapworth is an area in Warwick, Warwickshire with 303 households², where the most expensive property was sold for £1,470,000.00.
Properties for sale in Lapworth
Previously listed properties in Lapworth
Roads and Postcodes in Lapworth
Navigate through our locations to find the location of your next house in Lapworth, Warwick for sale or to rent.
| Streets | Postcodes |
|---|---|
| Back Lane | CV35 7BD |
| Dicks Lane | CV35 7DN |
| Finwood Road | CV35 7DH CV35 7DJ CV35 7DL |
| High Cross Lane | CV35 7BE |
| Holywell | CV35 7BH CV35 7BJ |
| Lye Green | CV35 8LP CV35 8LR |
| Manor Lane | CV35 8NH |
| Mill Lane | CV35 7AE CV35 7DQ |
| Mousley End | CV35 7JG CV35 7JQ |
| Old Warwick Road | CV35 7AA CV35 7AB CV35 7AD CV35 7BS CV35 7BT CV35 7BU |
| Pinley | CV35 8NA |
| Pinley Green | CV35 8LU CV35 8LX CV35 8LZ CV35 8NF |
| Queens Drive | CV35 7DA |
| Shrewley Common | CV35 7AZ |
| St Lawrence Close | CV35 7AG |
| The Avenue | CV35 7BX CV35 7BY |
| CV35 7BG CV35 7DB |
Transport near Lapworth
- FAQ
- Price Paid By Year
- Property Type Price
Frequently asked questions about Lapworth
What is the average price for a property for sale in Lapworth?
The average price for a property for sale in Lapworth is £740,304. This amount is 84% higher than the average price in Warwick. There are 96 property listings for sale in Lapworth.
What streets have the most expensive properties for sale in Lapworth?
The streets with the most expensive properties for sale in Lapworth are High Cross Lane at an average of £822,500, Pinley at an average of £775,130 and The Avenue at an average of £672,500.
What streets have the most affordable properties for sale in Lapworth?
The streets with the most affordable properties for sale in Lapworth are Queens Drive at an average of £594,000 and Old Warwick Road at an average of £626,666.
Which train stations are available in or near Lapworth?
Some of the train stations available in or near Lapworth are Hatton, Lapworth and Claverdon.
Property Price Paid in Lapworth by Year
The average sold property price by year was:
| Year | Average Sold Price | Price Change |
Sold Properties
|
|---|---|---|---|
| 2025 | £818,333 | 29% |
3 Properties |
| 2024 | £581,500 | -52% |
6 Properties |
| 2023 | £884,052 | -20% |
5 Properties |
| 2022 | £1,065,000 | 19% |
8 Properties |
| 2021 | £857,518 | 12% |
11 Properties |
| 2020 | £757,200 | -3% |
10 Properties |
| 2019 | £778,333 | 3% |
3 Properties |
| 2018 | £752,000 | 9% |
7 Properties |
| 2017 | £685,000 | -6% |
4 Properties |
| 2016 | £726,911 | 20% |
9 Properties |
| 2015 | £584,166 | -2% |
6 Properties |
| 2014 | £596,500 | 8% |
13 Properties |
| 2013 | £548,857 | 49% |
7 Properties |
| 2012 | £278,188 | -43% |
6 Properties |
| 2011 | £398,000 | 39% |
8 Properties |
| 2010 | £244,666 | -131% |
6 Properties |
| 2009 | £565,166 | 55% |
6 Properties |
| 2008 | £252,375 | -69% |
4 Properties |
| 2007 | £426,307 | -16% |
13 Properties |
| 2006 | £495,192 | 32% |
14 Properties |
| 2005 | £336,833 | -58% |
9 Properties |
| 2004 | £531,113 | -12% |
11 Properties |
| 2003 | £593,781 | 26% |
18 Properties |
| 2002 | £439,272 | 26% |
11 Properties |
| 2001 | £325,285 | 35% |
14 Properties |
| 2000 | £211,812 | -85% |
8 Properties |
| 1999 | £390,954 | 29% |
11 Properties |
| 1998 | £276,812 | 20% |
8 Properties |
| 1997 | £220,219 | 4% |
7 Properties |
| 1996 | £210,888 | 28% |
9 Properties |
| 1995 | £152,500 | - |
6 Properties |
Property Price per Property Type in Lapworth
Here you can find historic sold price data in order to help with your property search.
The average Property Paid Price for specific property types in the last three years are:
| Property Type | Average Sold Price | Sold Properties |
|---|---|---|
| Semi Detached House | £660,130.00 | 2 Semi Detached Houses |
| Detached House | £891,555.00 | 9 Detached Houses |
| Terraced House | £340,000.00 | 3 Terraced Houses |

