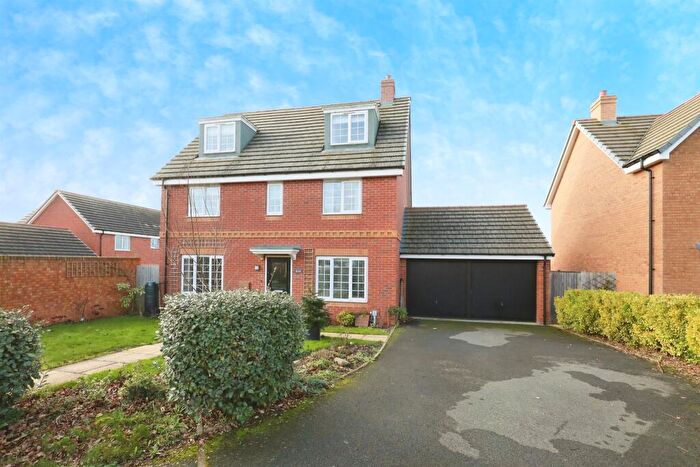
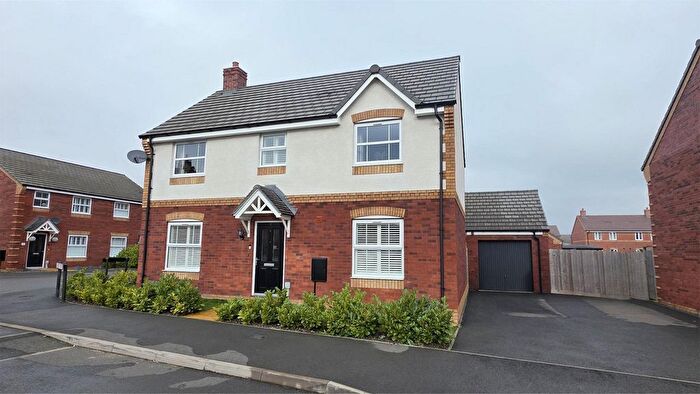
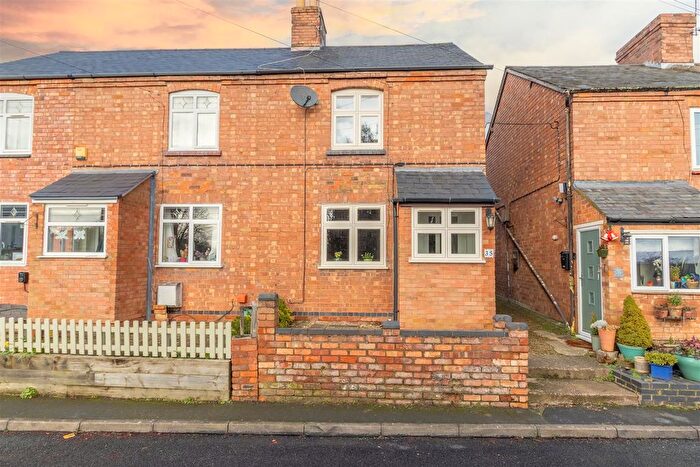
Houses for sale & to rent in Fenny Compton, Southam
House Prices in Fenny Compton
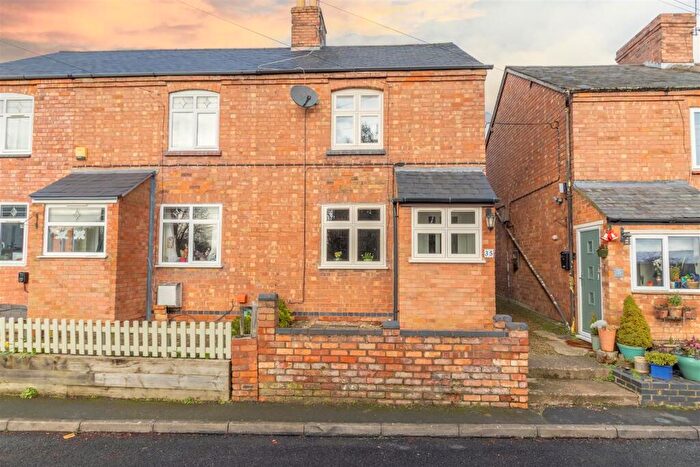
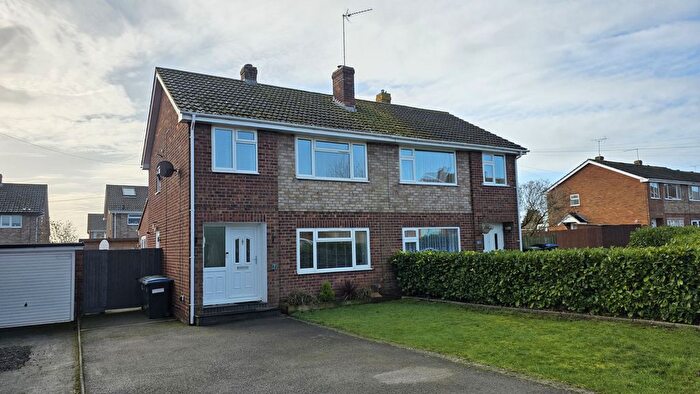
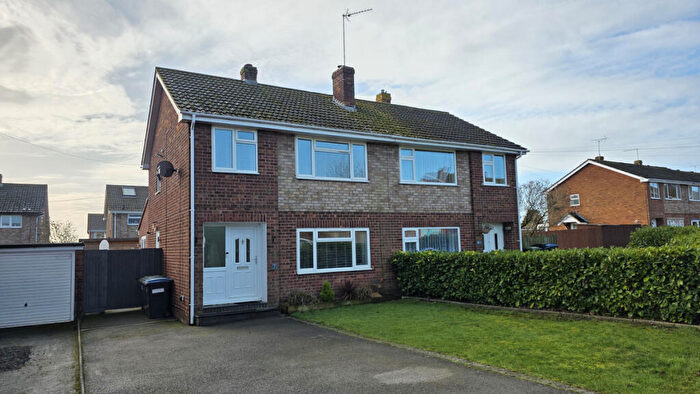
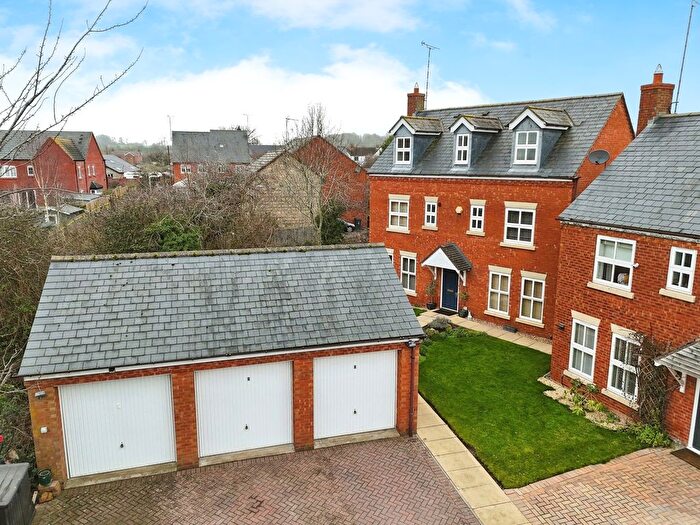
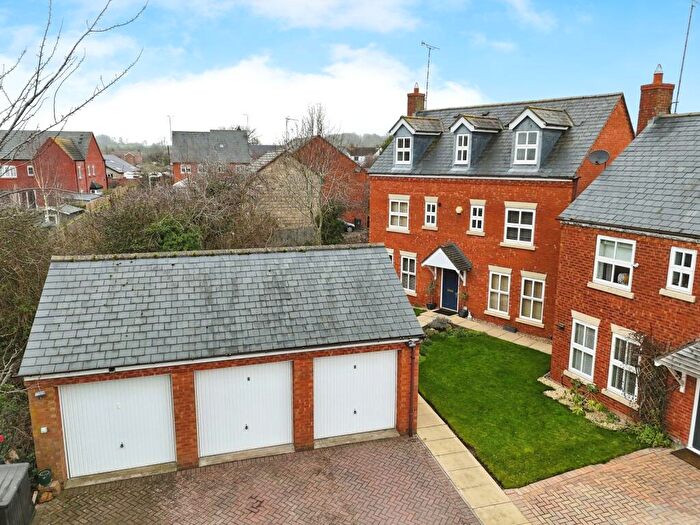
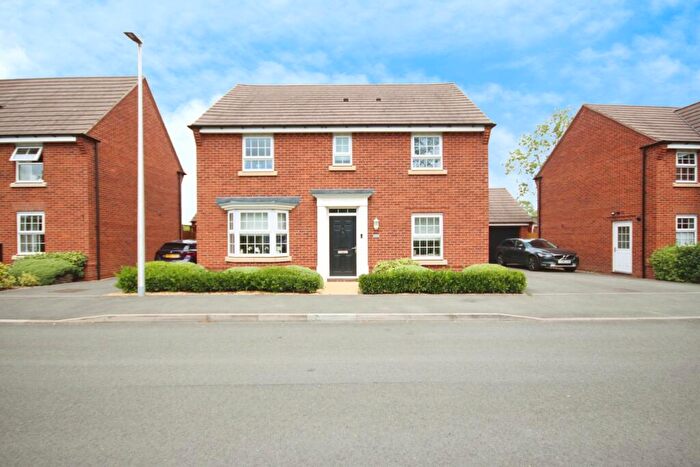
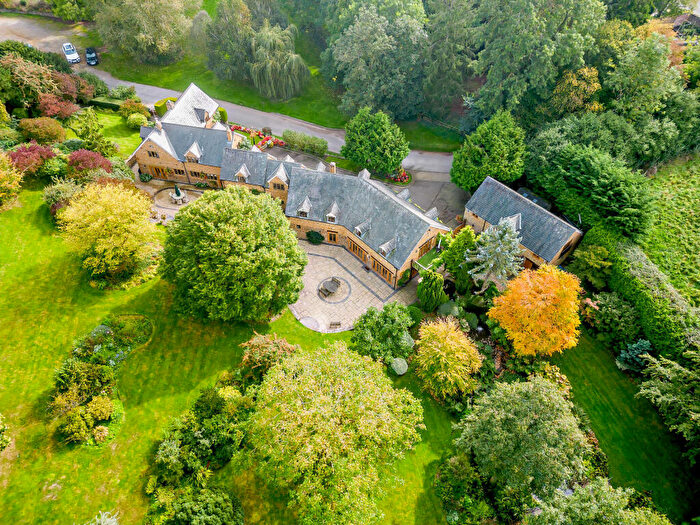
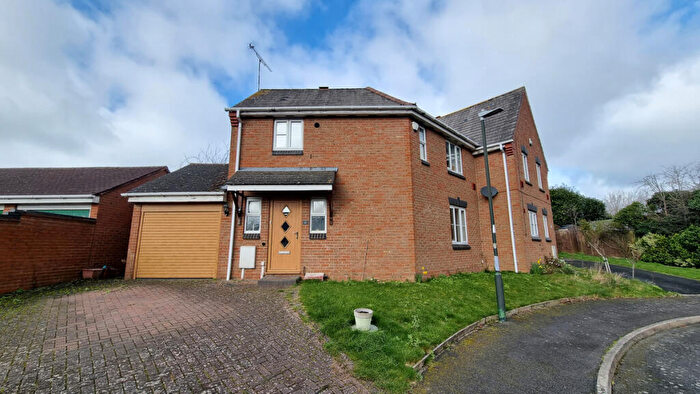
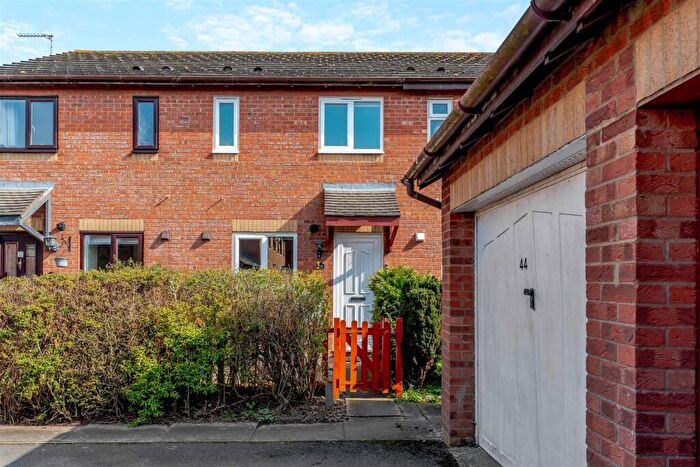
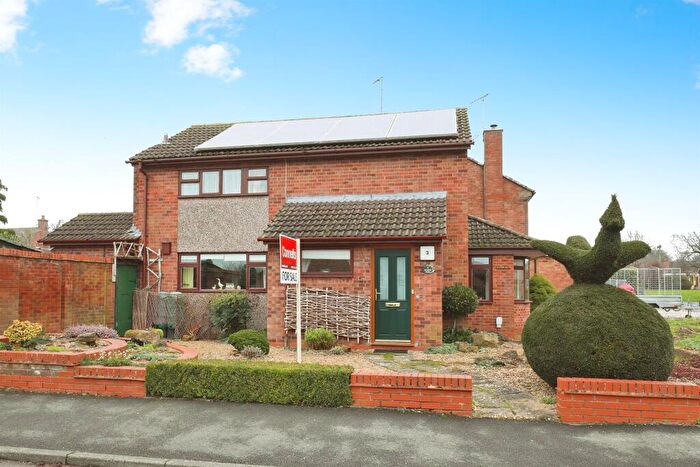
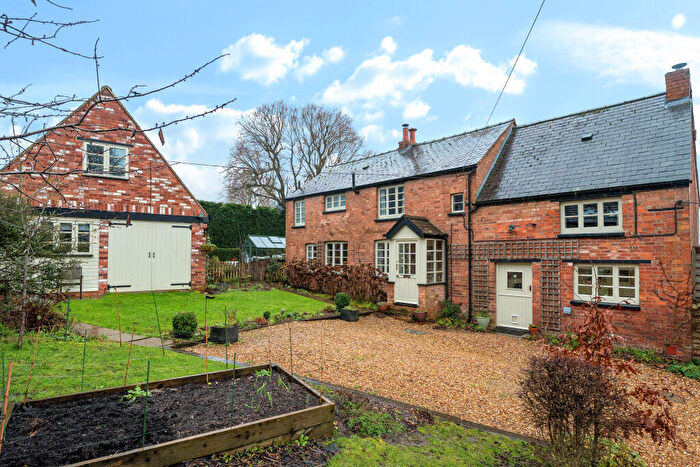
Properties in Fenny Compton have an average house price of £561,830.00 and had 59 Property Transactions within the last 3 years¹.
Fenny Compton is an area in Southam, Warwickshire with 785 households², where the most expensive property was sold for £1,750,000.00.
Properties for sale in Fenny Compton
Roads and Postcodes in Fenny Compton
Navigate through our locations to find the location of your next house in Fenny Compton, Southam for sale or to rent.
| Streets | Postcodes |
|---|---|
| Avon Carrow | CV47 2AR |
| Avon Dassett Road | CV47 2FW CV47 2XX |
| Berry Meadow | CV47 2YQ |
| Bradshaw Close | CV47 7RA |
| Bridge Lane | CV47 2DE |
| Bridge Street | CV47 2XY |
| Brook Street | CV47 2YH |
| Byfield Road | CV47 7RP |
| Church End | CV47 7SN |
| Church Street | CV47 2YE |
| Cotters Croft | CV47 2XS |
| Council Houses | CV47 2FR |
| Dassett Road | CV47 2AA |
| Dog Lane | CV47 2YD |
| Field Gate Lane | CV47 2WB |
| Grants Close | CV47 2YA |
| Hardwick Road | CV47 7RL |
| Hedges Close | CV47 2BE |
| Hellidon Road | CV47 7RN CV47 7RX |
| High Street | CV47 2FS CV47 2FT CV47 2XT CV47 2YG CV47 2YN |
| Hill View | CV47 2AJ |
| Holly Bush Lane | CV47 7RW |
| Keys Lane | CV47 7SA |
| Ladbroke Hill Lane | CV47 2BW |
| London End | CV47 7SL |
| Lower End | CV47 2AX CV47 7SP |
| Lower Terrace | CV47 2AU |
| Manor Court | CV47 2YX |
| Meadow Way | CV47 2WD |
| Memorial Road | CV47 2XU |
| Mill Lane | CV47 2YF |
| Northend Road | CV47 2YY CV47 2YZ |
| Park Close | CV47 2AW |
| Park Drive Cottages | CV47 2AN |
| Priors Court | CV47 7RH |
| School Lane | CV47 2BU CV47 2BX CV47 7RR |
| Shuckburgh Road | CV47 7RS |
| Southam Road | CV47 2BP CV47 7RQ |
| Squire Place | CV47 2YL |
| St Marys Close | CV47 7SW |
| Station Road | CV47 2XD CV47 2YW |
| The Holloway | CV47 7RG |
| The Slade | CV47 2YB |
| Thompsons Field | CV47 2BD |
| Turvins Meadow | CV47 7RZ |
| Vicarage Lane | CV47 7RT |
| Welsh Road | CV47 7SJ |
| Windmill Lane | CV47 2BN |
| CV47 2AE CV47 2AH CV47 2AL CV47 2AP CV47 2AS CV47 2AT CV47 2AY CV47 2BT CV47 2BY CV47 2DA CV47 2DF CV47 2XG CV47 2XH CV47 2XL CV47 7ST |
Transport near Fenny Compton
-
Banbury Station
-
Leamington Spa Station
-
Warwick Station
-
King's Sutton Station
-
Warwick Parkway Station
-
Long Buckby Station
-
Rugby Station
-
Stratford-Upon-Avon Station
- FAQ
- Price Paid By Year
- Property Type Price
Frequently asked questions about Fenny Compton
What is the average price for a property for sale in Fenny Compton?
The average price for a property for sale in Fenny Compton is £561,830. This amount is 52% higher than the average price in Southam. There are 2,065 property listings for sale in Fenny Compton.
What streets have the most expensive properties for sale in Fenny Compton?
The streets with the most expensive properties for sale in Fenny Compton are Vicarage Lane at an average of £1,135,000, The Slade at an average of £915,000 and Bridge Street at an average of £875,000.
What streets have the most affordable properties for sale in Fenny Compton?
The streets with the most affordable properties for sale in Fenny Compton are Grants Close at an average of £320,000, Northend Road at an average of £325,833 and Field Gate Lane at an average of £340,000.
Which train stations are available in or near Fenny Compton?
Some of the train stations available in or near Fenny Compton are Banbury, Leamington Spa and Warwick.
Property Price Paid in Fenny Compton by Year
The average sold property price by year was:
| Year | Average Sold Price | Price Change |
Sold Properties
|
|---|---|---|---|
| 2025 | £480,775 | -22% |
20 Properties |
| 2024 | £587,375 | -7% |
24 Properties |
| 2023 | £629,033 | 6% |
15 Properties |
| 2022 | £592,125 | 24% |
37 Properties |
| 2021 | £451,308 | 6% |
46 Properties |
| 2020 | £423,751 | -9% |
19 Properties |
| 2019 | £461,672 | 11% |
29 Properties |
| 2018 | £412,533 | -0,1% |
30 Properties |
| 2017 | £412,900 | -2% |
40 Properties |
| 2016 | £422,589 | 5% |
28 Properties |
| 2015 | £402,463 | 16% |
37 Properties |
| 2014 | £339,192 | -3% |
31 Properties |
| 2013 | £350,756 | -19% |
33 Properties |
| 2012 | £417,759 | 18% |
27 Properties |
| 2011 | £342,188 | -12% |
37 Properties |
| 2010 | £384,488 | 24% |
30 Properties |
| 2009 | £291,912 | -31% |
28 Properties |
| 2008 | £383,690 | 23% |
21 Properties |
| 2007 | £296,324 | -19% |
32 Properties |
| 2006 | £352,010 | 4% |
43 Properties |
| 2005 | £337,354 | 7% |
24 Properties |
| 2004 | £312,989 | 11% |
38 Properties |
| 2003 | £279,382 | 11% |
41 Properties |
| 2002 | £248,514 | 11% |
47 Properties |
| 2001 | £220,888 | 24% |
44 Properties |
| 2000 | £168,120 | 16% |
35 Properties |
| 1999 | £140,390 | -30% |
30 Properties |
| 1998 | £182,670 | 27% |
48 Properties |
| 1997 | £134,099 | 9% |
55 Properties |
| 1996 | £121,629 | 25% |
62 Properties |
| 1995 | £91,600 | - |
29 Properties |
Property Price per Property Type in Fenny Compton
Here you can find historic sold price data in order to help with your property search.
The average Property Paid Price for specific property types in the last three years are:
| Property Type | Average Sold Price | Sold Properties |
|---|---|---|
| Semi Detached House | £371,050.00 | 20 Semi Detached Houses |
| Detached House | £719,133.00 | 30 Detached Houses |
| Terraced House | £486,000.00 | 8 Terraced Houses |
| Flat | £265,000.00 | 1 Flat |

