
Houses for sale in Harbury, Southam
House Prices in Harbury
Properties in Harbury have an average house price of £364k and had 100 Property Transactions within the last 3 years¹.
Harbury is an area in Southam, Warwickshire with 920 households², where the most expensive property was sold for £1.6M.
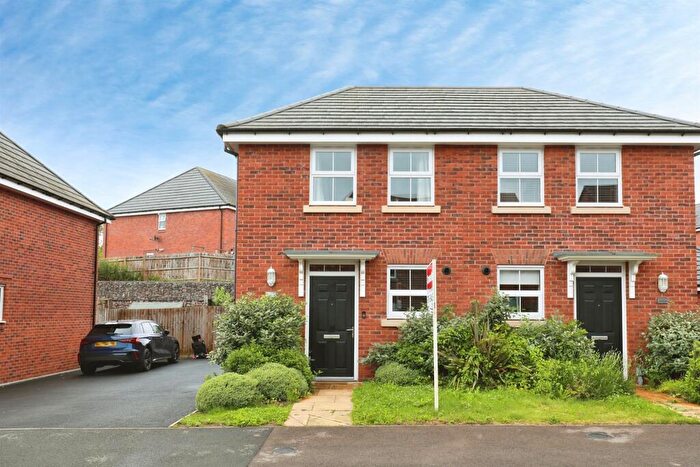
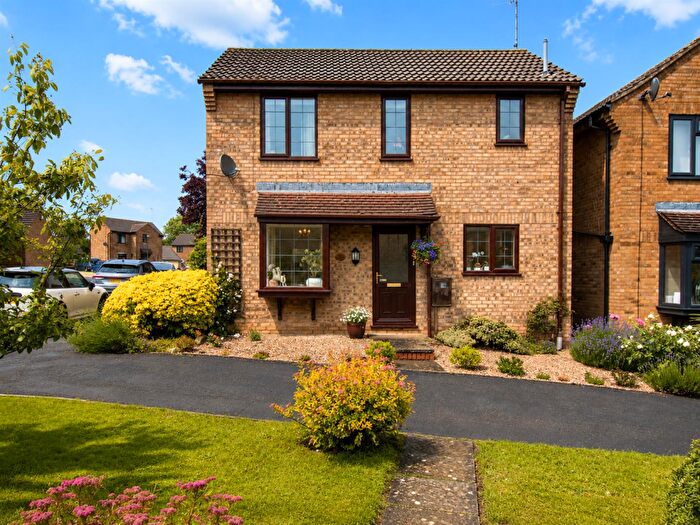
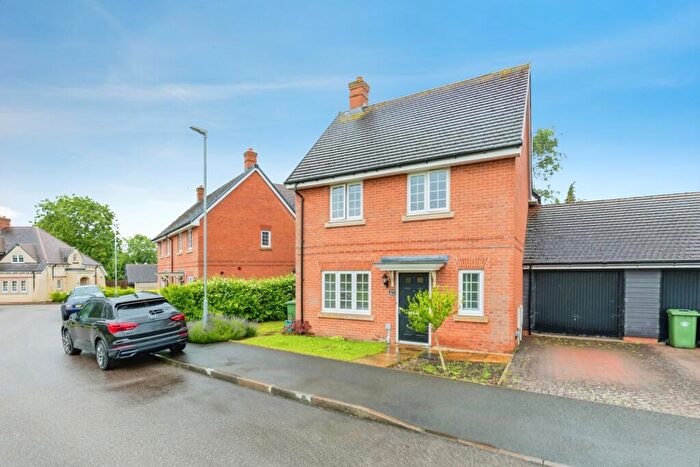
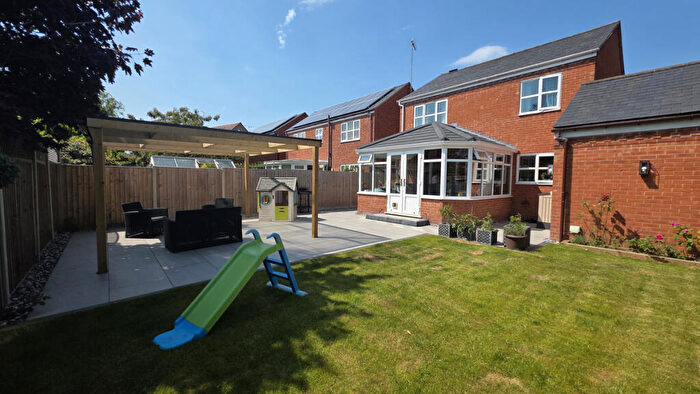
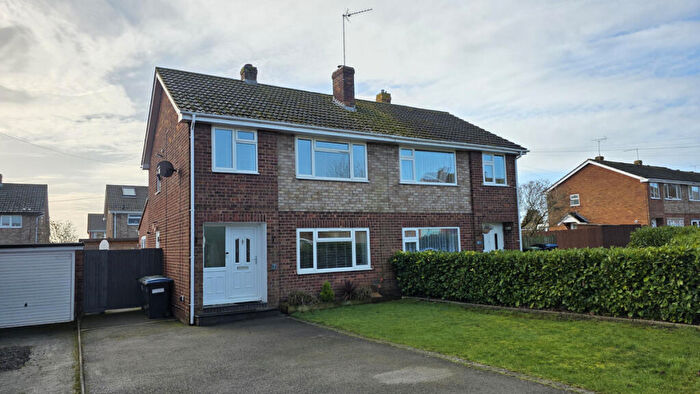
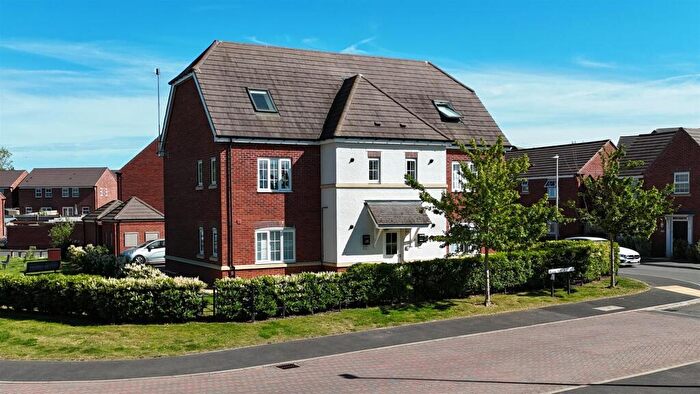
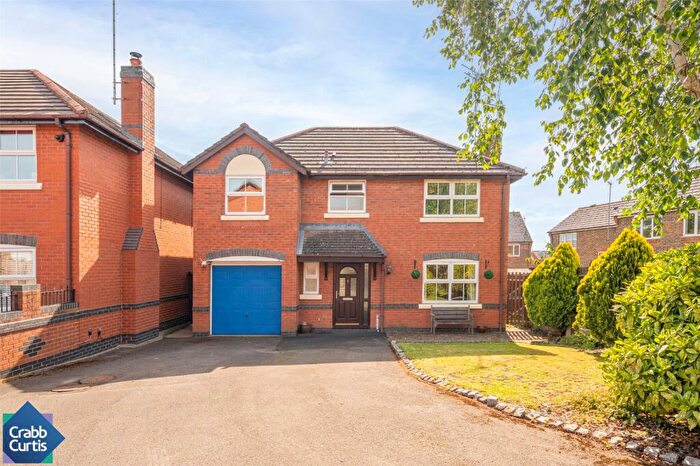
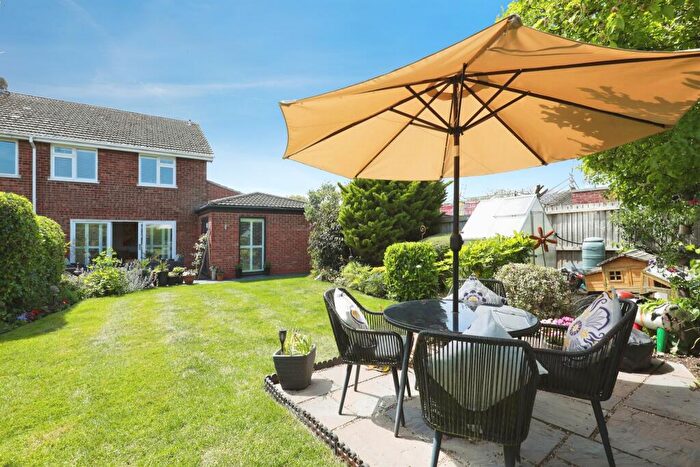
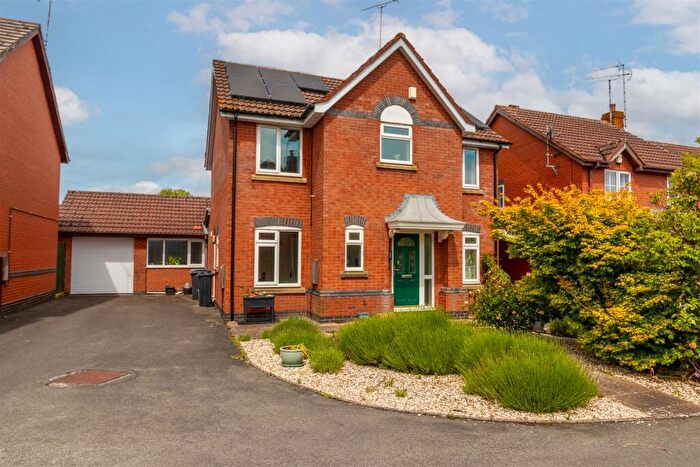
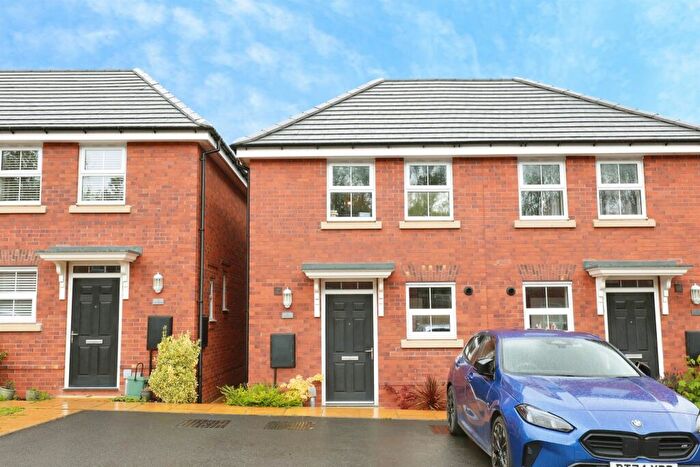
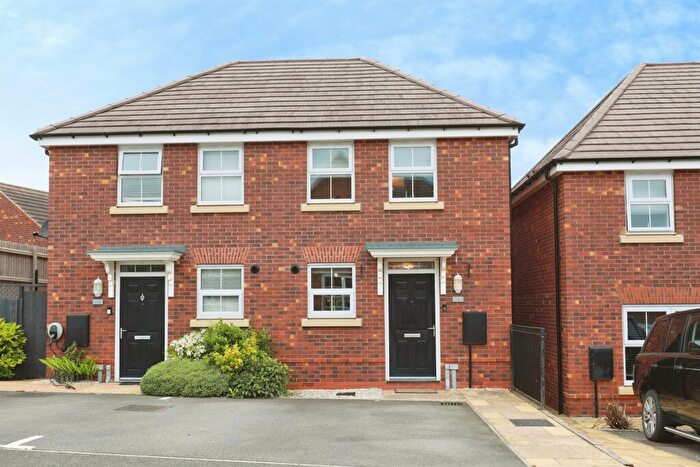
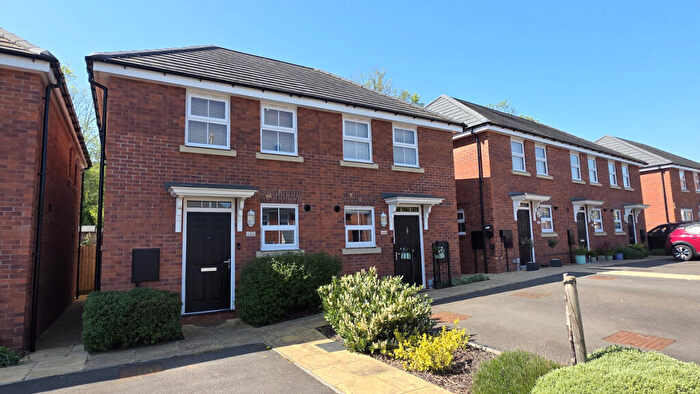
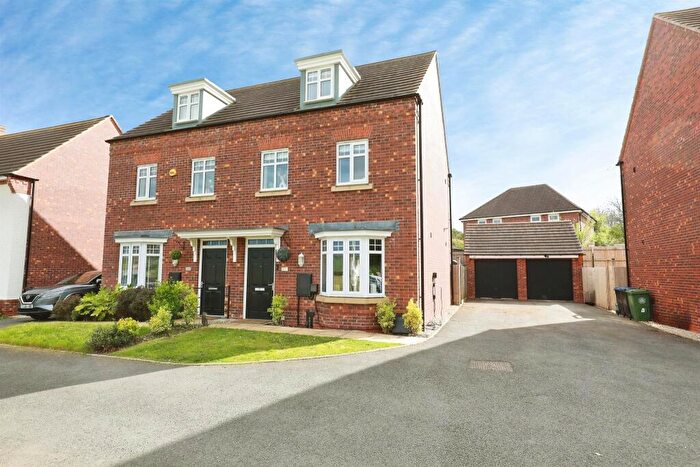
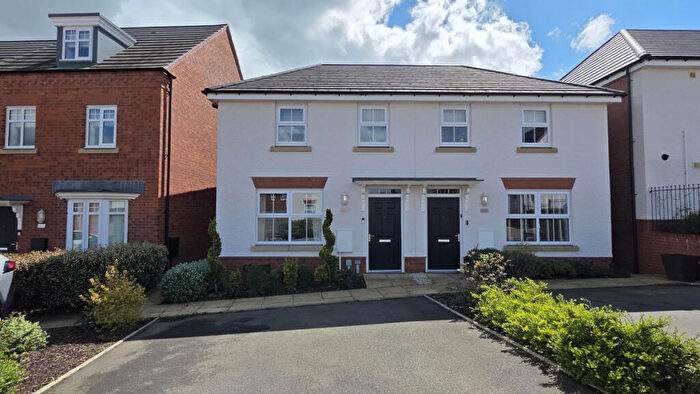
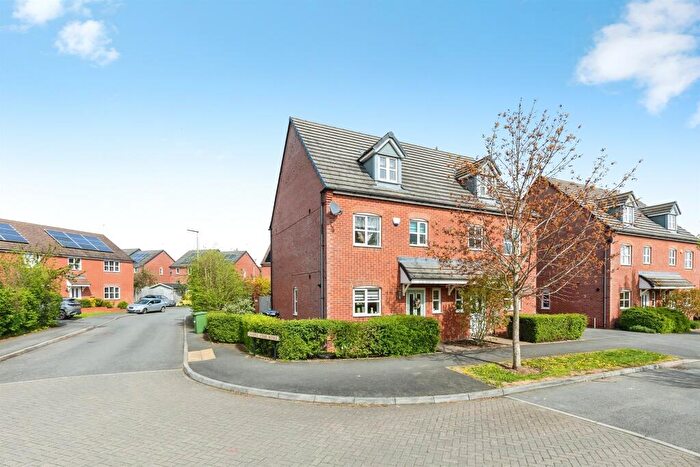
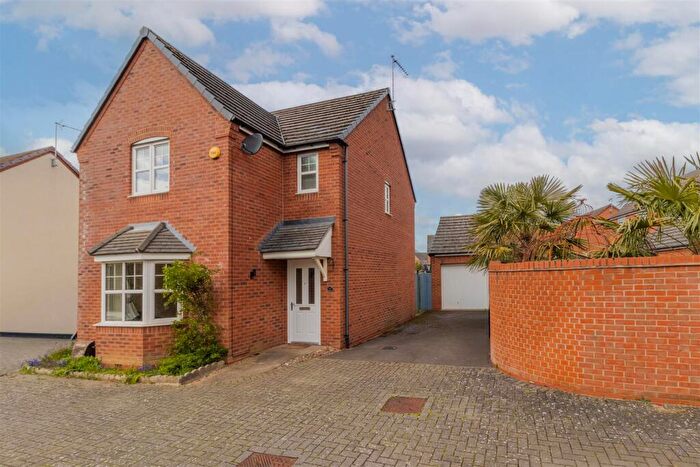
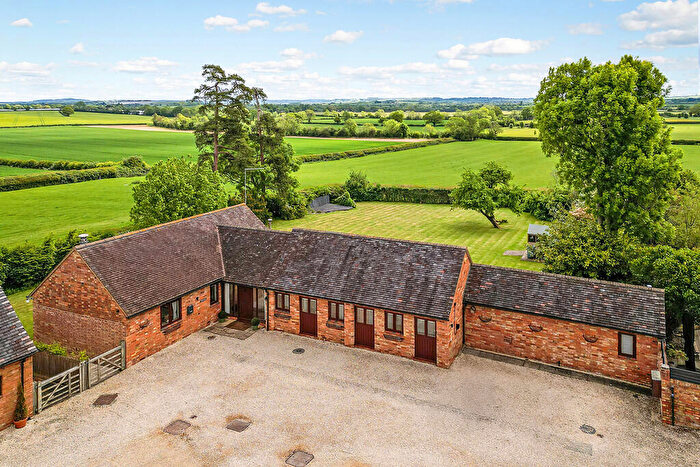
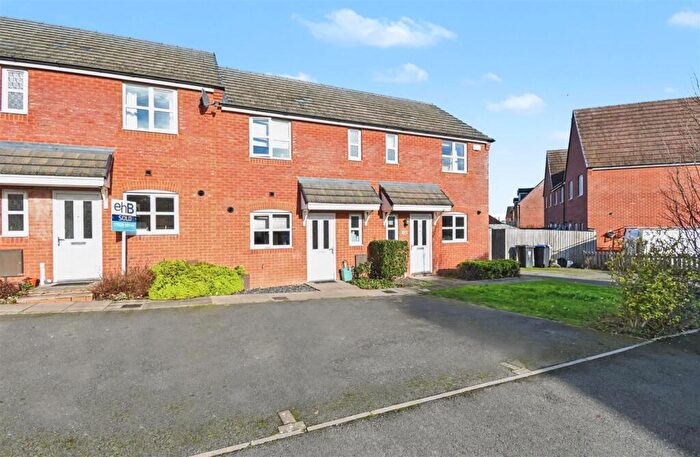
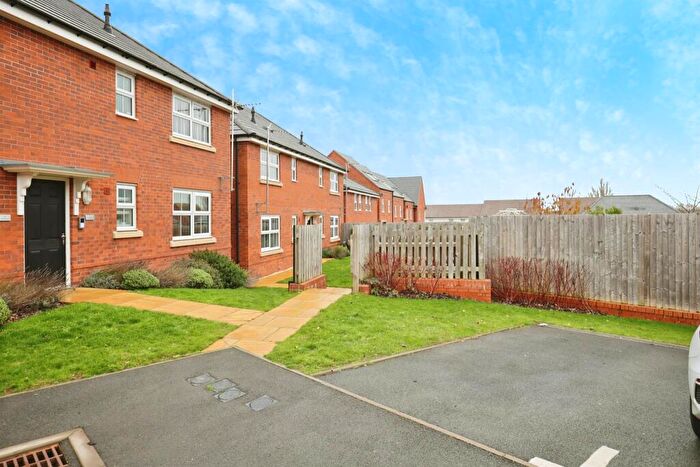
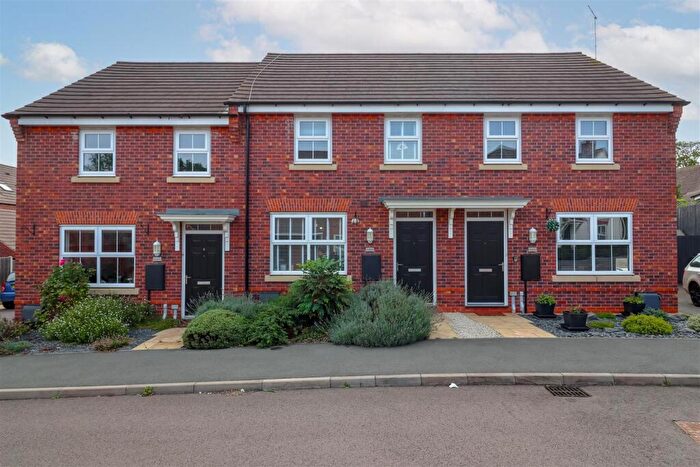
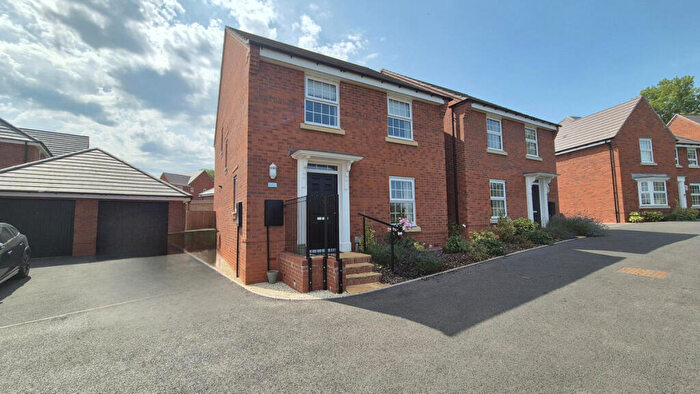
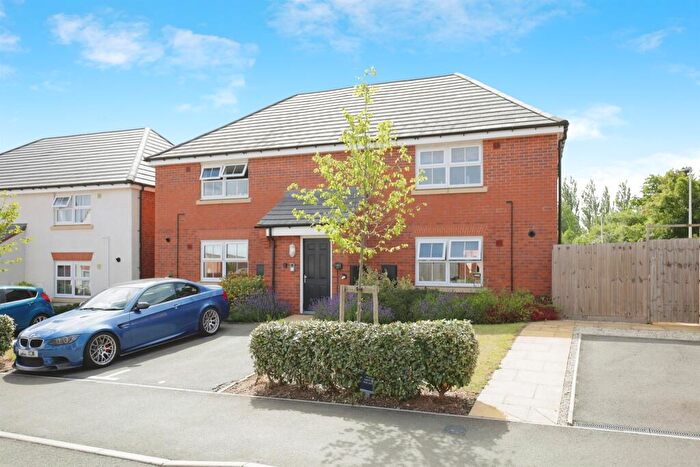
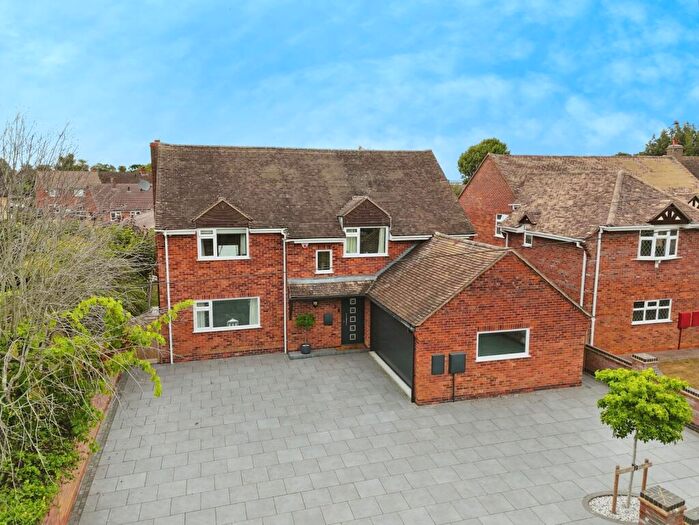
Properties for sale in Harbury
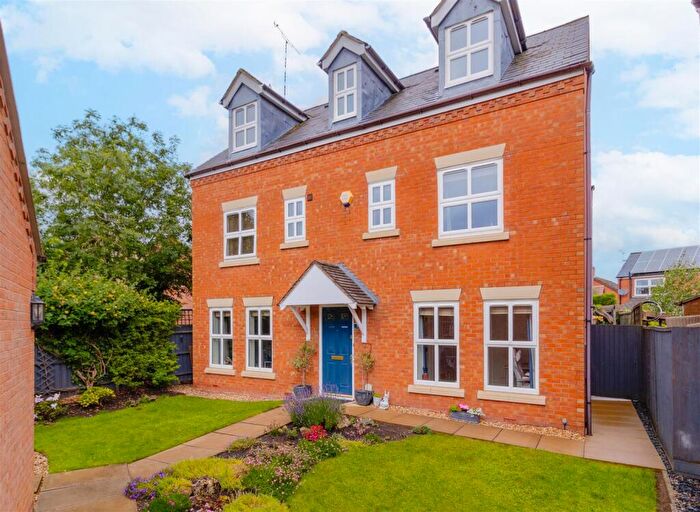
![]()
If you are looking to sell your house, let it out, or receive a property valuation, an expert can help you.
Click the button below to get started.
Roads and Postcodes in Harbury
Navigate through our locations to find the location of your next house in Harbury, Southam for sale or to rent.
| Streets | Postcodes |
|---|---|
| Bishops Gate | CV47 2UT |
| Butchers Close | CV47 2PX |
| Central Drive | CV47 2RJ |
| Chapel Street | CV47 2RB |
| Church Close | CV47 2QH |
| Cross Green Flats | CV47 2QR |
| Dadglow Road | CV47 2TG |
| Deppers Bridge | CV47 2SU CV47 2SX CV47 2SY |
| Fisher Road | CV47 2RE |
| Gaydon Road | CV47 2QN CV47 2QW CV47 2QX CV47 2QY CV47 2QZ CV47 2RD |
| Hambridge Road | CV47 2RH |
| High Street | CV47 2QA |
| Highfield Cottages | CV47 2SR |
| Hill View | CV47 2YS |
| Huckson Road | CV47 2TF |
| Ladbroke Road | CV47 2FG CV47 2RA CV47 2RL CV47 2RW CV47 2RY |
| Lakin Drive | CV47 2TE |
| Malt Shovel Court | CV47 2DR |
| Manor Road | CV47 2QJ |
| Mansions Close | CV47 2RF |
| Meadow Crofts | CV47 2QT |
| Mount Pleasant | CV47 2QE |
| Old Road | CV47 2RR CV47 2RS CV47 2RX |
| Orchard Close | CV47 2QS |
| Parrish Close | CV47 2YR |
| Plough Lane | CV47 2QG CV47 2QL |
| Poplar Road | CV47 2RG CV47 2RQ |
| Robins Lane | CV47 2EB |
| Rupert Kettle Drive | CV47 2PU |
| Scowcroft Drive | CV47 2YP |
| St Michaels Close | CV47 2QP |
| Starbold Road | CV47 2TQ |
| Station Road | CV47 2TA CV47 2QB CV47 2QD |
| The Greaves Way | CV47 2PY |
| The Spinney | CV47 2PZ |
| Weighbridge Drive | CV47 2EE |
| Wilcox Close | CV47 2YT |
| CV47 2ST CV47 2RU CV47 2SB CV47 2SS |
Property price trends in Harbury
According to the latest Land Registry data, the average home in Harbury sold for £335,000 in 2026. That figure comes from 1,294 sales logged over the past 31 years.
Prices have moved up over the last three years. Compared with 2023, when the typical sale came in around £327,976, that's a rise of roughly 2.1%.
Looking back five years, average prices are up about 4.3% since 2021, a gain of around £13,824 in cash terms.
Zoom out to the past decade for the fuller picture. Back in 2016, homes here averaged £292,744, so the typical sold price has climbed about 14.4% since then, roughly 1.4% a year. Stretch the view to fifteen years and that annual pace edges up closer to 2.9%.
Frequently asked questions about Harbury
What is the average price for a property for sale in Harbury?
The average price for a property for sale in Harbury is £363,699. This amount is 2% lower than the average price in Southam. There are 471 property listings for sale in Harbury.
What streets have the most expensive properties for sale in Harbury?
The streets with the most expensive properties for sale in Harbury are Plough Lane at an average of £1,600,000, High Street at an average of £653,000 and Weighbridge Drive at an average of £545,000.
What streets have the most affordable properties for sale in Harbury?
The streets with the most affordable properties for sale in Harbury are Cross Green Flats at an average of £157,000, The Spinney at an average of £225,000 and Bishops Gate at an average of £231,250.
Which train stations are available in or near Harbury?
Some of the train stations available in or near Harbury are Leamington Spa, Warwick and Warwick Parkway.
Property Price Paid in Harbury by Year
The average sold property price by year was:
| Year | Average Sold Price | Price Change |
Sold Properties
|
|---|---|---|---|
| 2026 | £335,000 | -16% |
5 Properties |
| 2025 | £387,273 | 6% |
36 Properties |
| 2024 | £364,884 | 10% |
38 Properties |
| 2023 | £327,976 | -9% |
21 Properties |
| 2022 | £356,127 | 10% |
36 Properties |
| 2021 | £321,176 | -2% |
43 Properties |
| 2020 | £328,842 | 7% |
46 Properties |
| 2019 | £304,512 | -9% |
40 Properties |
| 2018 | £332,303 | 18% |
47 Properties |
| 2017 | £270,911 | -8% |
34 Properties |
Property Price per Property Type in Harbury
Here you can find historic sold price data in order to help with your property search.
The average Property Paid Price for specific property types in the last three years are:
| Property Type | Average Sold Price | Sold Properties |
|---|---|---|
| Semi Detached House | £329,838.00 | 52 Semi Detached Houses |
| Detached House | £509,048.00 | 23 Detached Houses |
| Terraced House | £306,385.00 | 24 Terraced Houses |
| Flat | £157,000.00 | 1 Flat |
