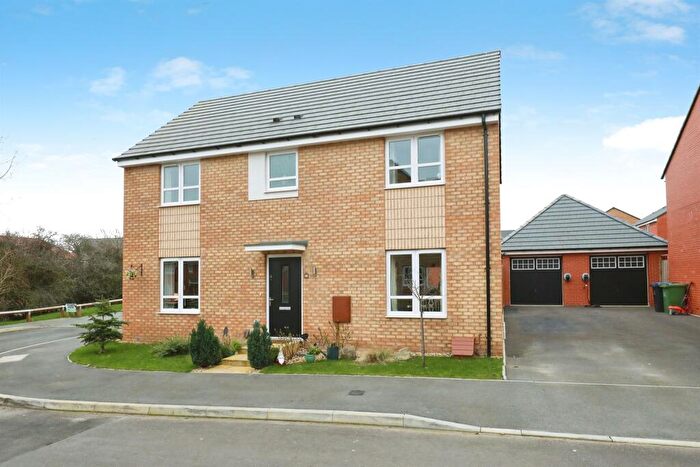
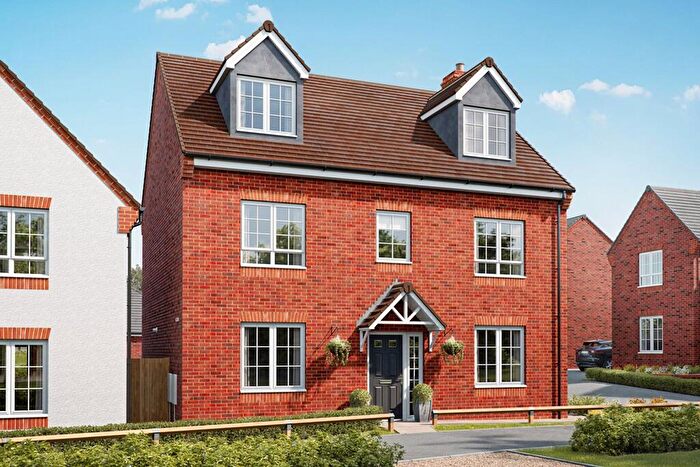
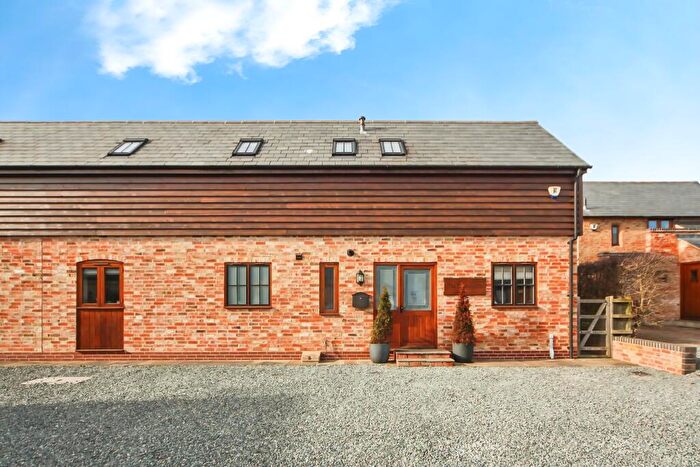
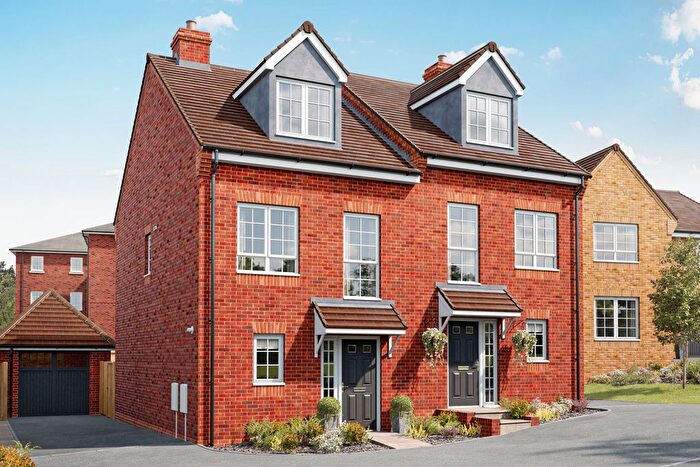
Houses for sale & to rent in Harbury, Leamington Spa
House Prices in Harbury
Properties in Harbury have an average house price of £442,685.00 and had 90 Property Transactions within the last 3 years¹.
Harbury is an area in Leamington Spa, Warwickshire with 1,002 households², where the most expensive property was sold for £1,100,000.00.
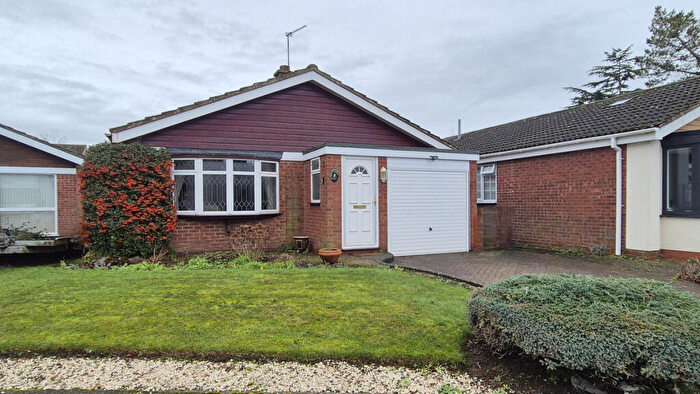
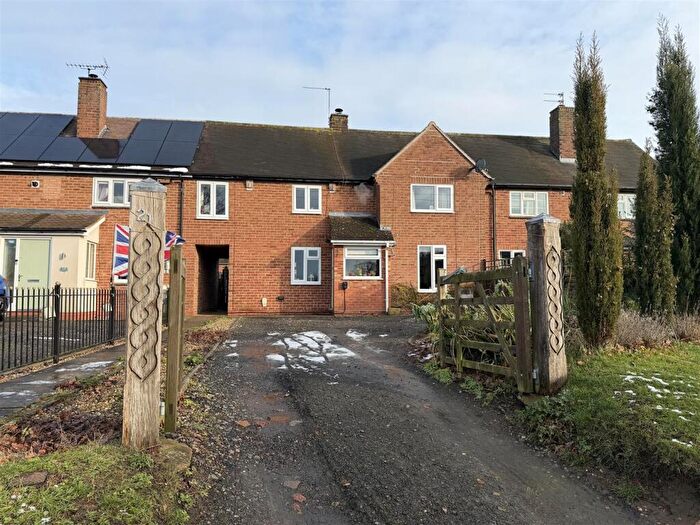
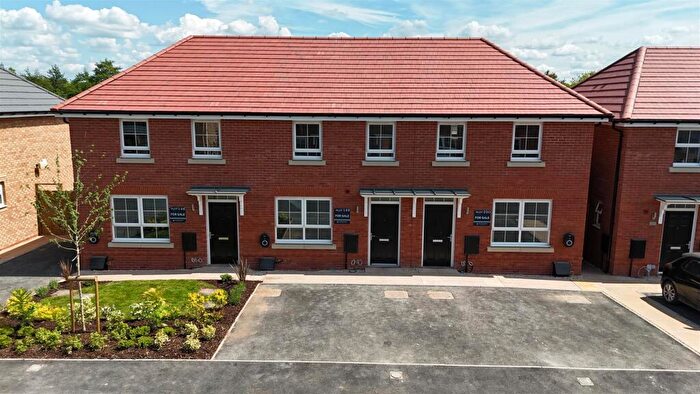
Properties for sale in Harbury
Roads and Postcodes in Harbury
Navigate through our locations to find the location of your next house in Harbury, Leamington Spa for sale or to rent.
| Streets | Postcodes |
|---|---|
| Binswood End | CV33 9LN |
| Bird Walk | CV33 9PW |
| Brooks Drive | CV33 9NT CV33 9NU |
| Bull Ring Farm Road | CV33 9HJ |
| Bush Heath Lane | CV33 9NF CV33 9NG |
| Bush Heath Road | CV33 9JH CV33 9NN CV33 9NW |
| Butt Lane | CV33 9JL |
| Chapel Street | CV33 9HT |
| Chesterton Road | CV33 9NH CV33 9NJ CV33 9NQ |
| Church Street | CV33 9EY |
| Church Terrace | CV33 9HL |
| Churchlands Business Park | CV33 9GX |
| Constance Drive | CV33 9JA |
| Crown Close | CV33 9HF |
| Crown Street | CV33 9HE |
| Dickens Road | CV33 9LU |
| Dove House Lane | CV33 9HD |
| Drinkwater Close | CV33 9GY |
| Farley Avenue | CV33 9LX |
| Farm Close | CV33 9LL |
| Farm Street | CV33 9LR CV33 9LS |
| Fosse Way | CV31 1XH CV33 9JX CV33 9SR CV31 1XL CV33 9JY CV33 9JZ |
| Fox Close | CV33 9JU |
| Frances Road | CV33 9JG |
| Hall Lane | CV33 9HG |
| Harbury Lane | CV33 9JR |
| Hawtin End | CV33 9PT |
| Heber Drive | CV33 9NA |
| Henrys Place | CV33 9UN |
| Hereburgh Way | CV33 9NR |
| High Street | CV33 9HW |
| Hillside | CV33 9EU |
| Honiwell Close | CV33 9LY |
| Ivy Lane | CV33 9HN |
| Knightlow Way | CV33 9NB |
| Leycester Close | CV33 9LP |
| Mackley Way | CV33 9NP |
| Manor Orchard | CV33 9LZ |
| Manor Road | CV33 9HY |
| Margaret Close | CV33 9JB |
| Marston Field | CV33 9UA |
| Middle Road | CV33 9JN |
| Mill Lane | CV33 9HP |
| Mill Street | CV33 9HR CV33 9HS |
| Neales Close | CV33 9JQ |
| Overs Grove | CV33 9PN |
| Park Lane | CV33 9HX |
| Park Lane Terrace | CV33 9HU |
| Penelope Close | CV33 9JD |
| Percival Drive | CV33 9GZ |
| Pineham Avenue | CV33 9JF |
| Pirie Close | CV33 9JT |
| Queens Close | CV33 9JJ |
| Rainbow Crescent | CV33 9PS |
| Ridgley Way | CV33 9NS |
| South Parade | CV33 9HZ CV33 9JE |
| Sutcliffe Drive | CV33 9LT |
| Temple End | CV33 9NE |
| The Beeches | CV33 9LW |
| The Bull Ring | CV33 9EZ CV33 9FA |
| The Green | CV33 9LE |
| The Old Gated Road | CV33 9LD |
| The Pound | CV33 9HH |
| Treens Close | CV33 9EX |
| Ufton Fields | CV33 9NX CV33 9NY |
| Valiant Close | CV33 9UF |
| Vicarage Lane | CV33 9HA CV33 9HB |
| Wagstaffe Close | CV33 9ND |
| Windmill Hill Lane | CV33 9LB |
| CV33 9HQ CV33 9LA CV33 9LG CV33 9LH CV33 9LQ CV33 9NL |
Transport near Harbury
- FAQ
- Price Paid By Year
- Property Type Price
Frequently asked questions about Harbury
What is the average price for a property for sale in Harbury?
The average price for a property for sale in Harbury is £442,685. This amount is 13% higher than the average price in Leamington Spa. There are 1,736 property listings for sale in Harbury.
What streets have the most expensive properties for sale in Harbury?
The streets with the most expensive properties for sale in Harbury are The Pound at an average of £865,000, Butt Lane at an average of £851,075 and Vicarage Lane at an average of £730,000.
What streets have the most affordable properties for sale in Harbury?
The streets with the most affordable properties for sale in Harbury are Leycester Close at an average of £170,000, Farm Street at an average of £180,000 and Park Lane Terrace at an average of £236,500.
Which train stations are available in or near Harbury?
Some of the train stations available in or near Harbury are Leamington Spa, Warwick and Warwick Parkway.
Property Price Paid in Harbury by Year
The average sold property price by year was:
| Year | Average Sold Price | Price Change |
Sold Properties
|
|---|---|---|---|
| 2025 | £472,558 | 7% |
27 Properties |
| 2024 | £438,806 | 5% |
38 Properties |
| 2023 | £416,320 | -17% |
25 Properties |
| 2022 | £487,642 | 2% |
41 Properties |
| 2021 | £479,182 | 23% |
62 Properties |
| 2020 | £368,112 | -2% |
36 Properties |
| 2019 | £376,120 | -30% |
37 Properties |
| 2018 | £489,495 | 22% |
47 Properties |
| 2017 | £381,891 | -5% |
70 Properties |
| 2016 | £401,447 | 4% |
33 Properties |
| 2015 | £387,204 | 27% |
32 Properties |
| 2014 | £282,730 | -18% |
41 Properties |
| 2013 | £334,129 | -12% |
41 Properties |
| 2012 | £372,676 | 21% |
29 Properties |
| 2011 | £293,637 | 4% |
33 Properties |
| 2010 | £280,831 | -0,1% |
35 Properties |
| 2009 | £281,118 | -5% |
25 Properties |
| 2008 | £295,750 | -2% |
18 Properties |
| 2007 | £301,238 | 9% |
40 Properties |
| 2006 | £274,063 | 3% |
47 Properties |
| 2005 | £264,775 | 6% |
34 Properties |
| 2004 | £249,347 | 15% |
54 Properties |
| 2003 | £213,161 | 3% |
39 Properties |
| 2002 | £206,745 | 24% |
48 Properties |
| 2001 | £156,407 | 7% |
39 Properties |
| 2000 | £146,135 | -3% |
57 Properties |
| 1999 | £149,982 | 11% |
60 Properties |
| 1998 | £133,200 | 4% |
52 Properties |
| 1997 | £127,418 | 33% |
72 Properties |
| 1996 | £85,819 | -12% |
39 Properties |
| 1995 | £95,793 | - |
23 Properties |
Property Price per Property Type in Harbury
Here you can find historic sold price data in order to help with your property search.
The average Property Paid Price for specific property types in the last three years are:
| Property Type | Average Sold Price | Sold Properties |
|---|---|---|
| Semi Detached House | £389,232.00 | 28 Semi Detached Houses |
| Detached House | £539,189.00 | 45 Detached Houses |
| Terraced House | £281,856.00 | 16 Terraced Houses |
| Flat | £170,000.00 | 1 Flat |

