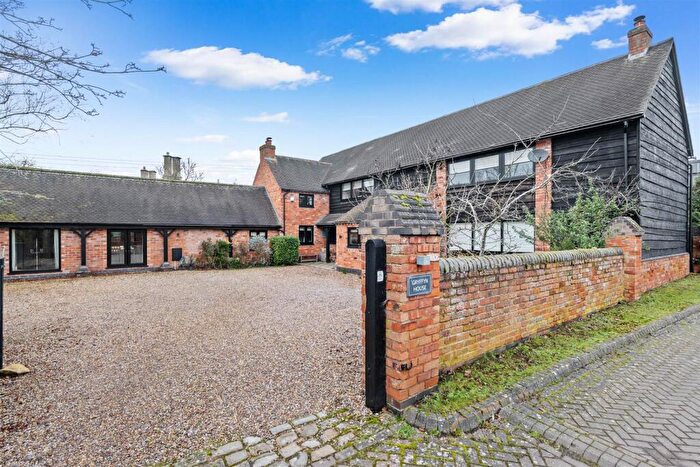
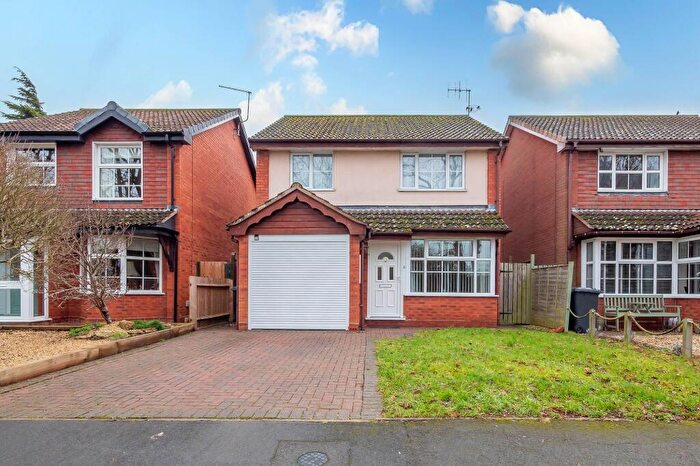
Houses for sale & to rent in Quinton, Stratford-upon-avon
House Prices in Quinton
Properties in Quinton have an average house price of £395,410.00 and had 114 Property Transactions within the last 3 years¹.
Quinton is an area in Stratford-upon-avon, Warwickshire with 1,026 households², where the most expensive property was sold for £2,000,000.00.
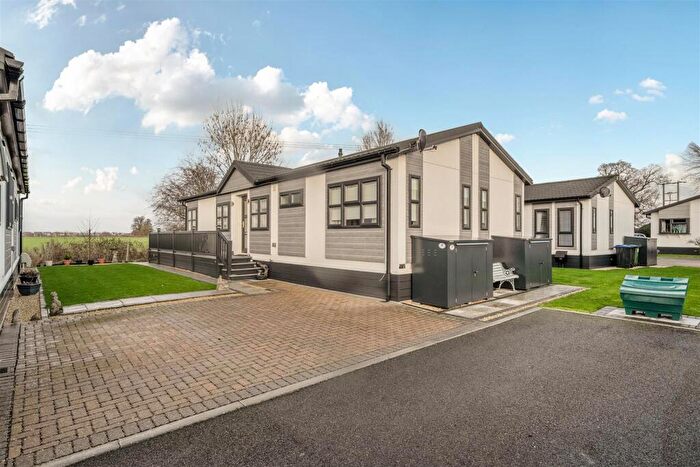
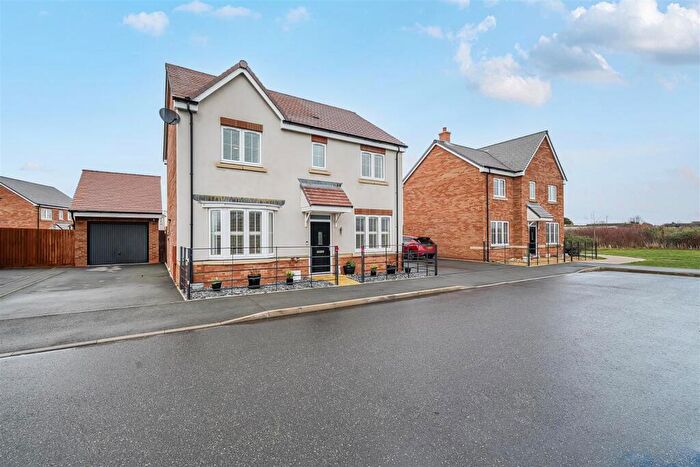
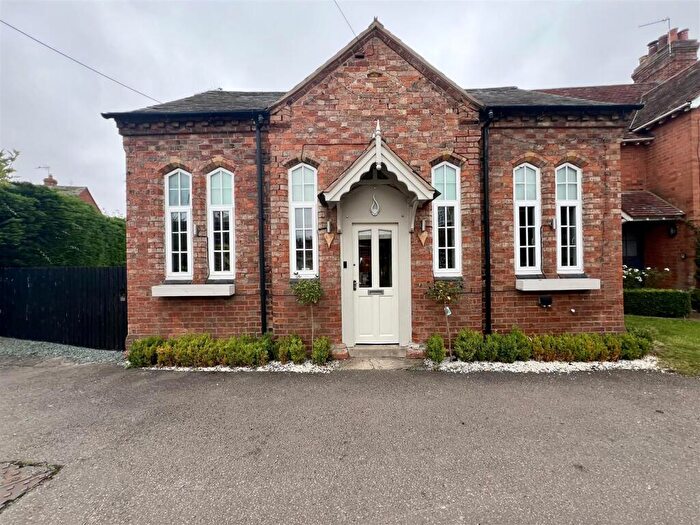
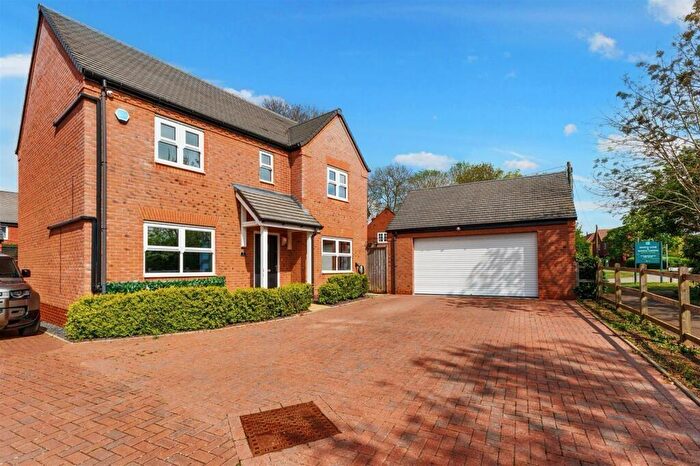
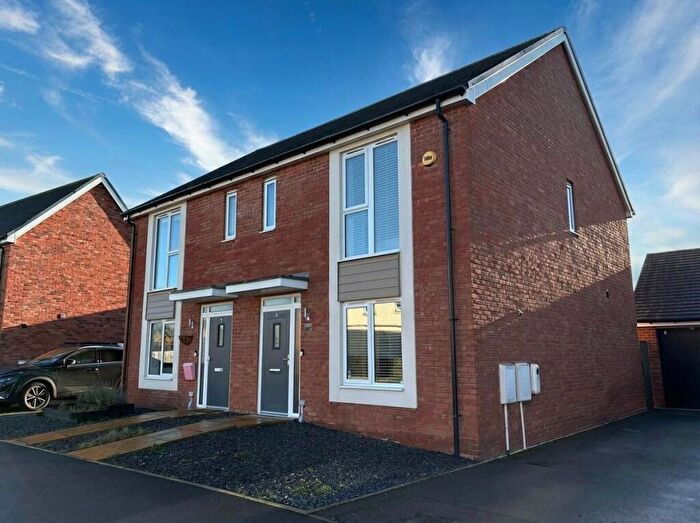
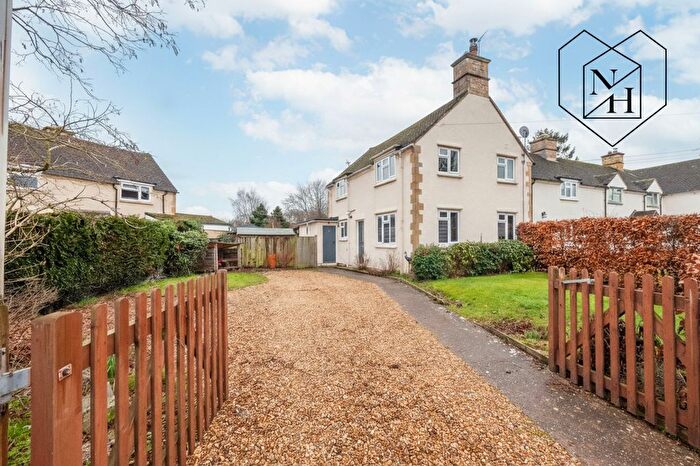
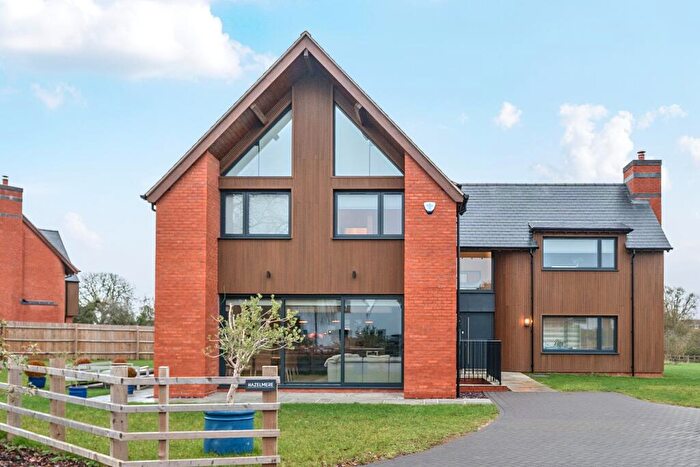
Properties for sale in Quinton
Roads and Postcodes in Quinton
Navigate through our locations to find the location of your next house in Quinton, Stratford-upon-avon for sale or to rent.
| Streets | Postcodes |
|---|---|
| Abney Road | CV37 8WJ |
| Albert Close | CV37 8WE |
| Aylstone Close | CV37 8TE |
| Back Lane | CV37 8SF |
| Banning Corner | CV37 8RT |
| Bastyan Avenue | CV37 8SW |
| Bicester Road | CV37 8YB |
| Box Bush Cottages | CV37 8RF |
| Camberley Way | CV37 8WY |
| Campden Road | CV37 8LJ CV37 8LL CV37 8LP |
| Carters View | CV37 8TG |
| Chatham Road | CV37 8WG CV37 8WH |
| College Farm Drive | CV37 8TD |
| Corfield Drive | CV37 8TL |
| Dobbie Road | CV37 8SU |
| Dorsington Road | CV37 8RW |
| Edmonds Close | CV37 8ST |
| Friday Street | CV37 8SQ |
| Goose Lane | CV37 8SY CV37 8SZ CV37 8TA |
| Gundulf Road | CV37 8WX |
| Hill Lane | CV37 8TB |
| Hopkins Field | CV37 8QY |
| Jacksons Orchard | CV37 8RU |
| Lilac Avenue | CV37 8US |
| Madras Road | CV37 8WT |
| Magdalen Close | CV37 8RZ |
| Maple Court | CV37 8WF |
| Meon Hill | CV37 8QT |
| Millfield Close | CV37 8TF |
| New Row | CV37 8SL |
| Norton Drive | CV37 8TH |
| Park Lane | CV37 8SP |
| Pear Tree Close | CV37 8RE |
| Pinfold Grange | CV37 8LS |
| Poland Avenue | CV37 8QU |
| Ravelin Close | CV37 8WN |
| Richborough Road | CV37 8WW |
| Rideau Road | CV37 8WR |
| Rochester Close | CV37 8WS |
| Rumer Close | CV37 8RB |
| Sapper Close | CV37 8WU |
| St Swithins Drive | CV37 8SB |
| Station Road | CV37 8RP |
| Stileman Close | CV37 8SR |
| Stileman Corner | CV37 8QZ |
| Sweet Knowle | CV37 8NR |
| Sycamore Court | CV37 8WL |
| Taylors Lane | CV37 8LG |
| Thackeray Close | CV37 8SS |
| The Brickall | CV37 8QL |
| The Close | CV37 8SE |
| The Firs | CV37 8TJ |
| The Fordway | CV37 8QP |
| The Green | CV37 8RJ |
| The Orchard | CV37 8PJ |
| The Rookery | CV37 8GH |
| Turnpike Drive | CV37 8QS |
| Ubique Avenue | CV37 8WQ |
| Village Cottages | CV37 8SH |
| Walnut Walk | CV37 8UU |
| Welford Road | CV37 8RA CV37 8RH |
| Wellington Avenue | CV37 8WD CV37 8WB |
| Wyre Lane | CV37 8RQ |
| CV37 8NB CV37 8NE CV37 8NG CV37 8NH CV37 8NL CV37 8RD CV37 8RG CV37 8RL CV37 8RY CV37 8SG CV37 8SJ CV37 8SX CV37 8LF CV37 8LH CV37 8LQ CV37 8NT CV37 8SA CV37 8SD CV37 8UQ |
Transport near Quinton
-
Honeybourne Station
-
Stratford-Upon-Avon Station
-
Stratford Pkway Station
-
Wilmcote Station
-
Bearley Station
-
Evesham Station
-
Moreton-In-Marsh Station
-
Wootton Wawen Station
- FAQ
- Price Paid By Year
- Property Type Price
Frequently asked questions about Quinton
What is the average price for a property for sale in Quinton?
The average price for a property for sale in Quinton is £395,410. This amount is 11% lower than the average price in Stratford-upon-avon. There are 1,671 property listings for sale in Quinton.
What streets have the most expensive properties for sale in Quinton?
The streets with the most expensive properties for sale in Quinton are Meon Hill at an average of £1,225,000, Dobbie Road at an average of £820,000 and The Rookery at an average of £772,500.
What streets have the most affordable properties for sale in Quinton?
The streets with the most affordable properties for sale in Quinton are Bastyan Avenue at an average of £109,250, The Orchard at an average of £184,000 and St Swithins Drive at an average of £194,500.
Which train stations are available in or near Quinton?
Some of the train stations available in or near Quinton are Honeybourne, Stratford-Upon-Avon and Stratford Pkway.
Property Price Paid in Quinton by Year
The average sold property price by year was:
| Year | Average Sold Price | Price Change |
Sold Properties
|
|---|---|---|---|
| 2025 | £309,196 | -56% |
31 Properties |
| 2024 | £481,067 | 20% |
37 Properties |
| 2023 | £384,611 | 18% |
46 Properties |
| 2022 | £314,820 | -12% |
52 Properties |
| 2021 | £352,321 | 3% |
64 Properties |
| 2020 | £343,372 | 4% |
62 Properties |
| 2019 | £329,843 | 3% |
66 Properties |
| 2018 | £320,574 | 5% |
74 Properties |
| 2017 | £303,248 | 12% |
58 Properties |
| 2016 | £266,022 | -19% |
85 Properties |
| 2015 | £315,838 | 22% |
126 Properties |
| 2014 | £245,322 | -10% |
104 Properties |
| 2013 | £270,768 | -11% |
35 Properties |
| 2012 | £299,294 | 11% |
37 Properties |
| 2011 | £267,140 | 14% |
25 Properties |
| 2010 | £230,820 | 5% |
42 Properties |
| 2009 | £218,886 | -6% |
34 Properties |
| 2008 | £231,995 | -7% |
24 Properties |
| 2007 | £247,084 | -4% |
57 Properties |
| 2006 | £257,114 | 21% |
59 Properties |
| 2005 | £203,577 | -4% |
44 Properties |
| 2004 | £211,775 | 4% |
113 Properties |
| 2003 | £204,025 | 25% |
98 Properties |
| 2002 | £153,144 | -5% |
67 Properties |
| 2001 | £160,898 | 10% |
103 Properties |
| 2000 | £144,152 | 22% |
79 Properties |
| 1999 | £112,548 | 7% |
50 Properties |
| 1998 | £105,143 | 13% |
46 Properties |
| 1997 | £91,923 | 13% |
39 Properties |
| 1996 | £79,710 | -26% |
32 Properties |
| 1995 | £100,153 | - |
29 Properties |
Property Price per Property Type in Quinton
Here you can find historic sold price data in order to help with your property search.
The average Property Paid Price for specific property types in the last three years are:
| Property Type | Average Sold Price | Sold Properties |
|---|---|---|
| Semi Detached House | £293,873.00 | 30 Semi Detached Houses |
| Detached House | £547,911.00 | 56 Detached Houses |
| Terraced House | £216,475.00 | 20 Terraced Houses |
| Flat | £156,000.00 | 8 Flats |


