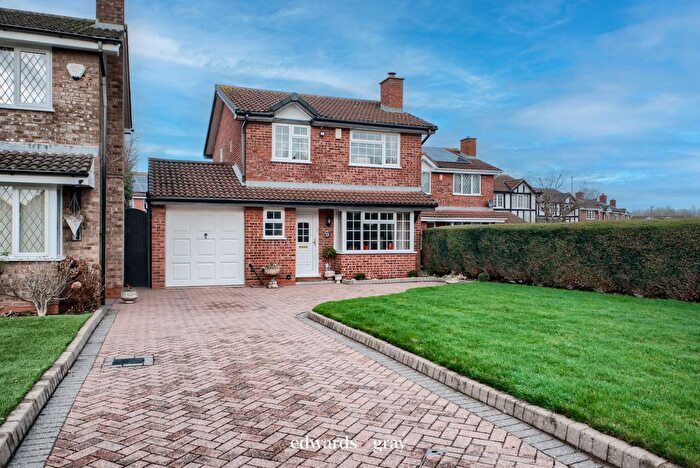
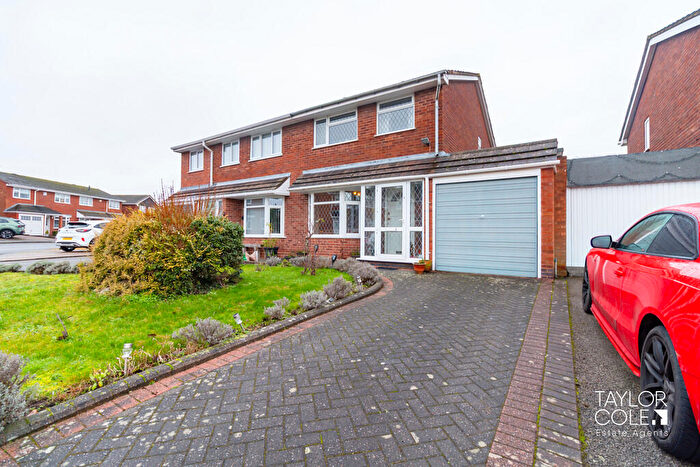
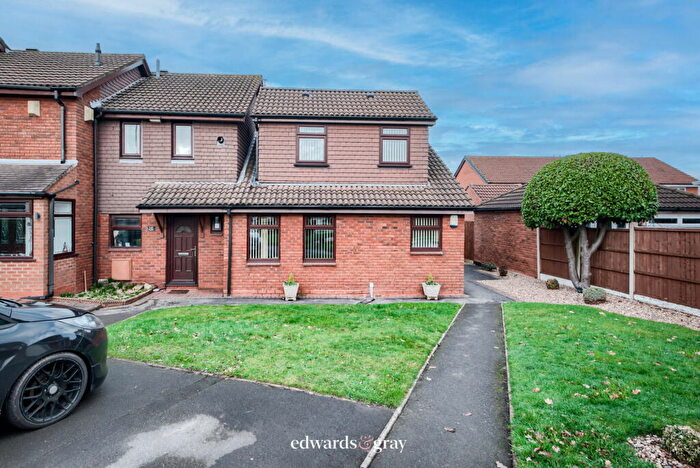
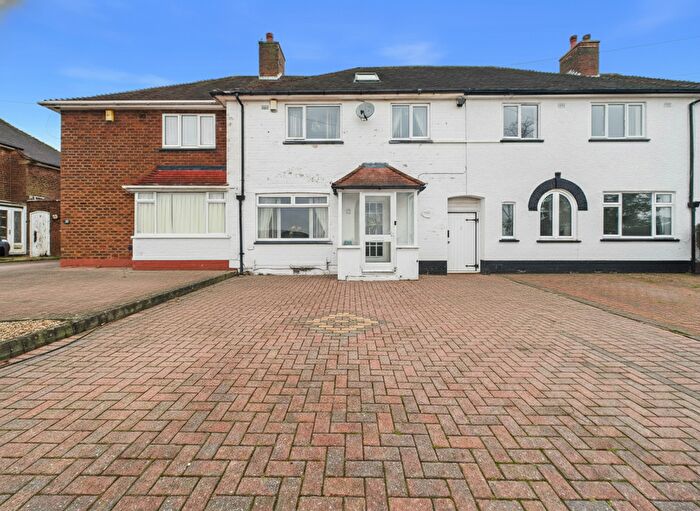
Houses for sale & to rent in Curdworth, Sutton Coldfield
House Prices in Curdworth
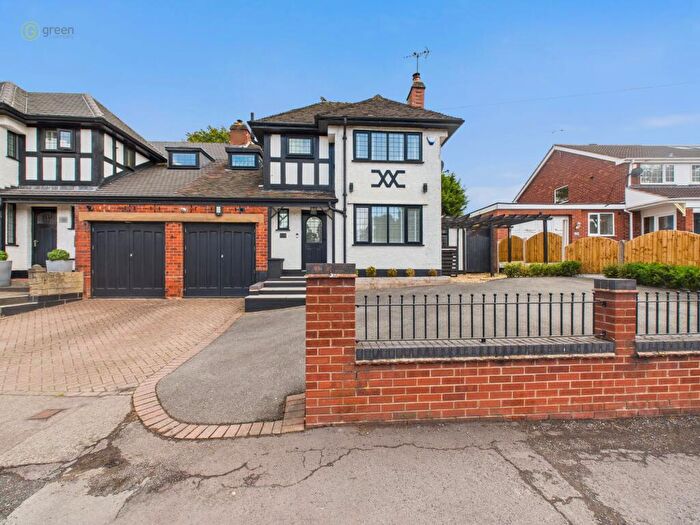
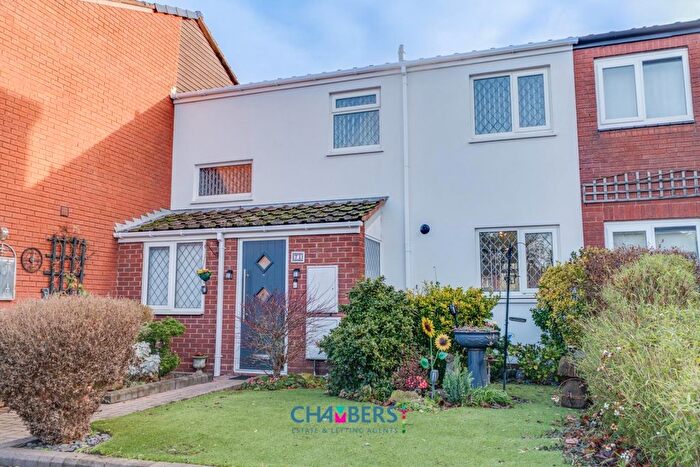
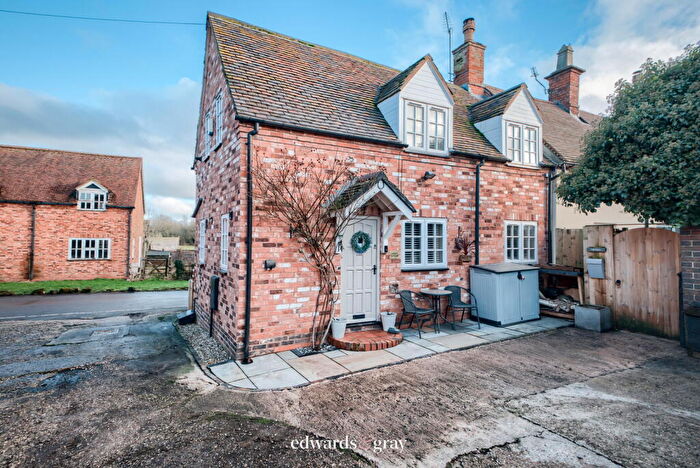
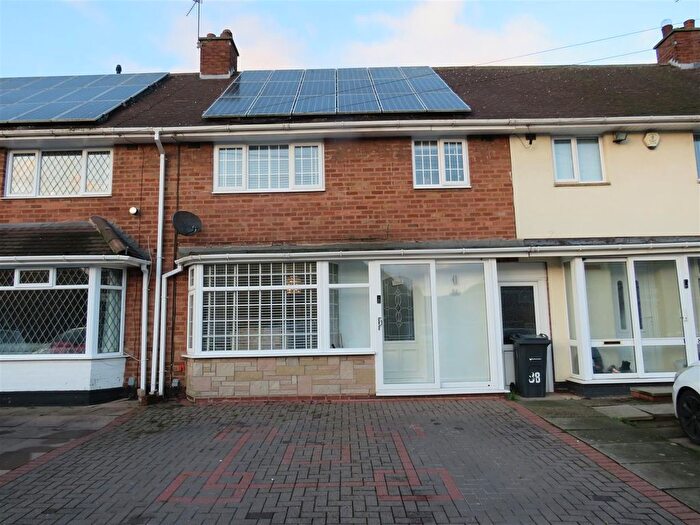
Properties in Curdworth have an average house price of £407,120.00 and had 55 Property Transactions within the last 3 years¹.
Curdworth is an area in Sutton Coldfield, Warwickshire with 754 households², where the most expensive property was sold for £975,000.00.
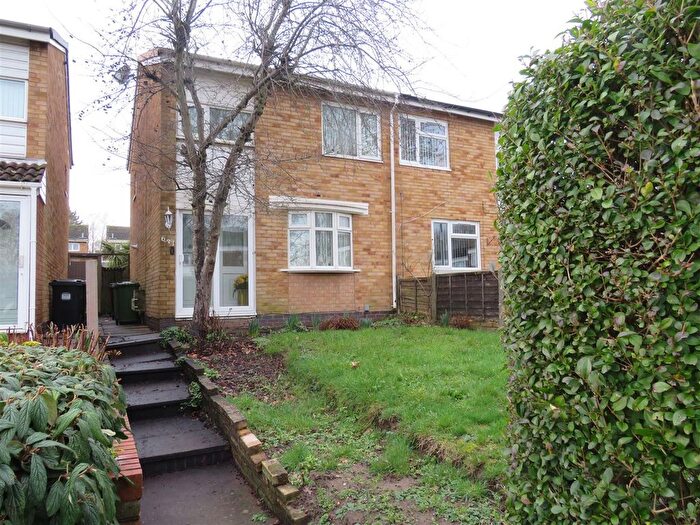
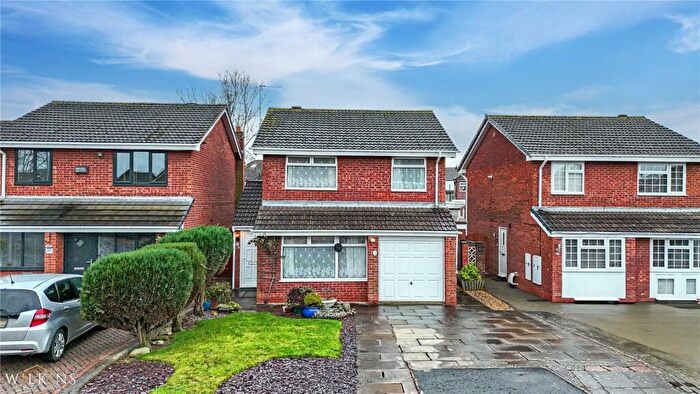
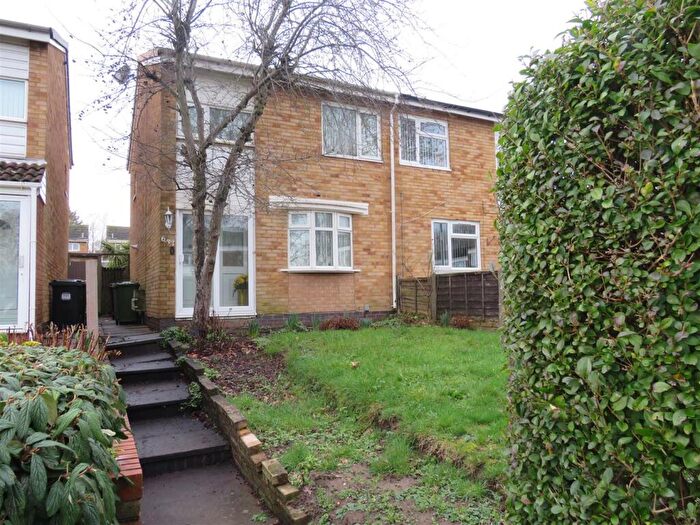
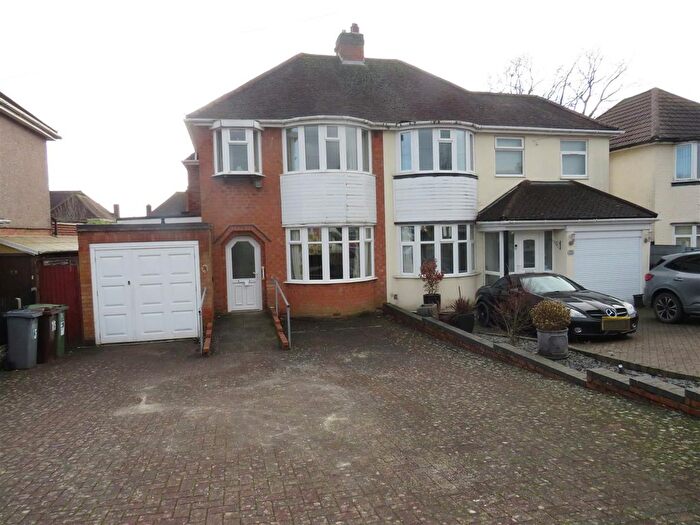
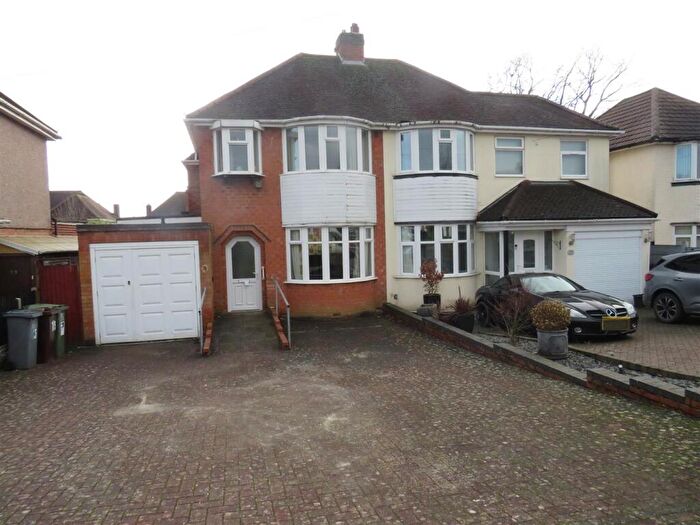
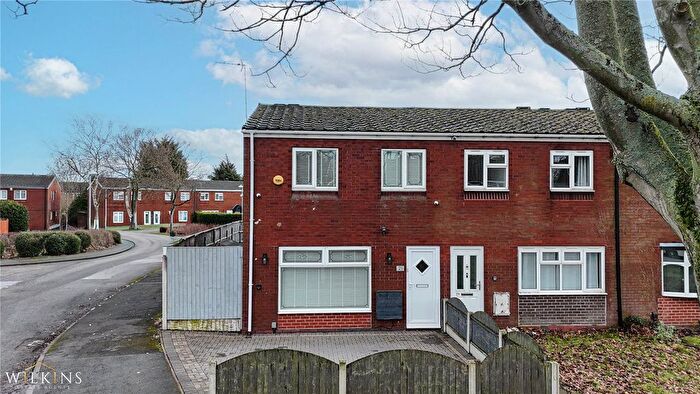
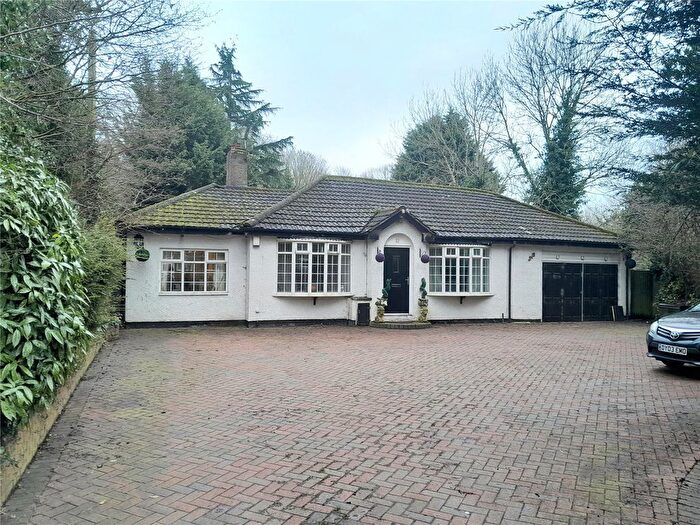
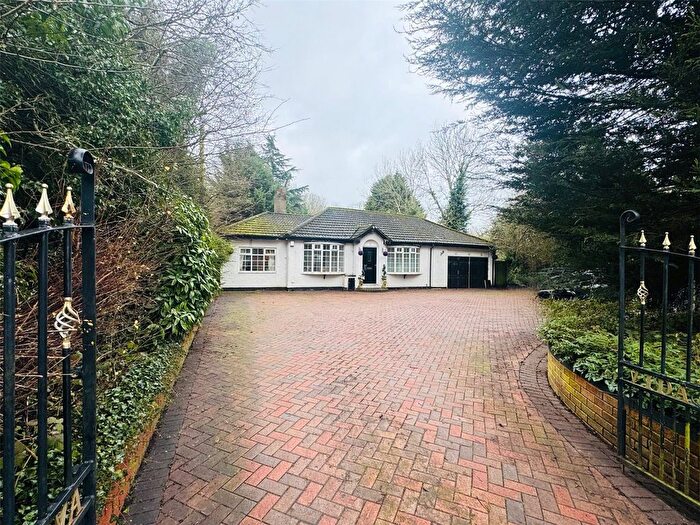
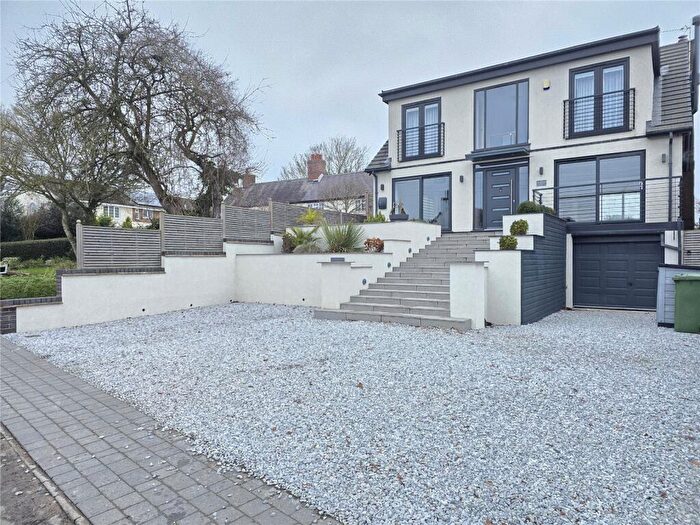
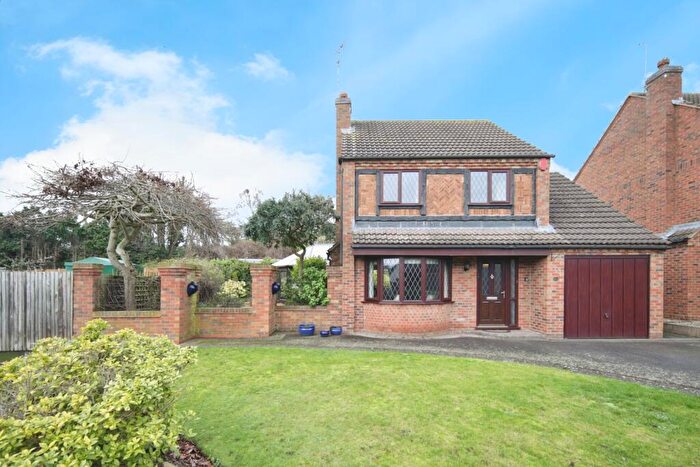
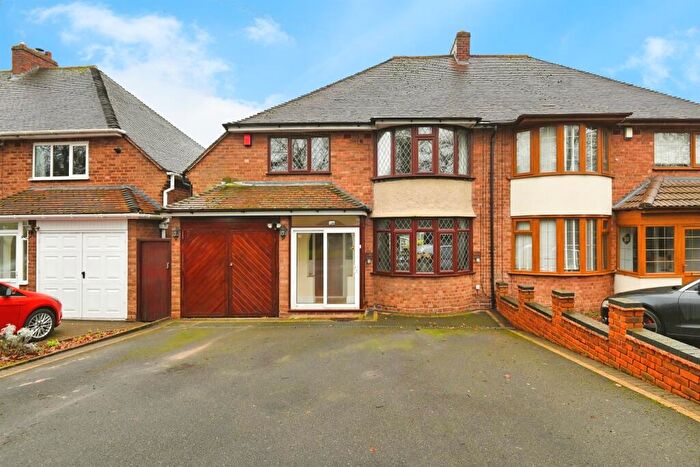
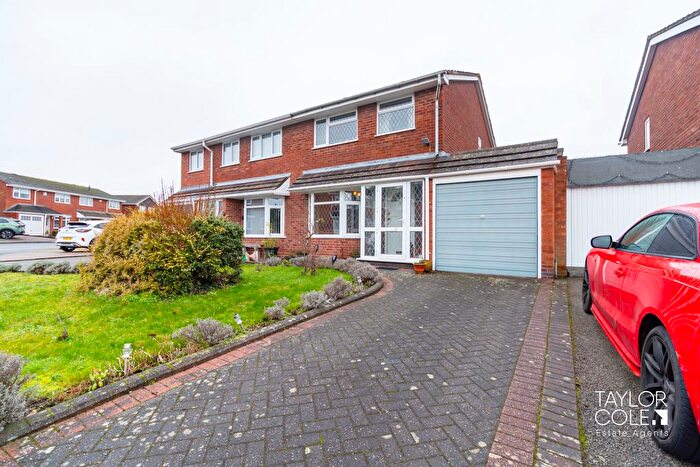
Properties for sale in Curdworth
Roads and Postcodes in Curdworth
Navigate through our locations to find the location of your next house in Curdworth, Sutton Coldfield for sale or to rent.
| Streets | Postcodes |
|---|---|
| Beehive Lane | B76 9HG |
| Birmingham Road | B76 0BN |
| Blackgreaves Lane | B76 0DA |
| Bodymoor Heath | B76 0EE |
| Bodymoor Heath Lane | B76 0DX B76 0DZ B76 0EA B76 0EQ B76 9JF B76 9JG B76 0DY B76 9JB |
| Breeden Drive | B76 9HJ B76 9HL |
| Bulls Lane | B76 9QL |
| Canalside | B76 9EQ |
| Canalside Cottages | B76 0EF B76 9JE |
| Chantry Industrial Estate | B76 9EF |
| Cheatles Bridge Business Park | B76 9AF |
| Church Lane | B76 0BJ B76 9EY B76 9QD B76 9QH |
| Coleshill Road | B76 9ET B76 9EX B76 9HA B76 9HH B76 9HP |
| Collets Brook | B75 6LA |
| Coton Road | B76 0DN |
| Cuttle Mill Lane | B76 9PU |
| Dog Lane | B76 9JD |
| Dunton Lane | B76 9QA |
| Dunton Park | B76 9EB |
| Fair View Industrial Estate | B76 9EE |
| Farthing Lane | B76 9HE B76 9HF |
| Glebe Fields | B76 9ES |
| Grove Lane | B76 9PH B76 9PJ B76 9PQ |
| Hams Lane | B76 0BL |
| Haunch Lane | B76 0BX B76 0BY |
| Hill Lane | B75 6LE B75 6LF |
| Holly Lane | B76 9PB B76 9PD |
| Holt Villas | B76 9DU |
| Kingsbury Road | B76 0DE B76 0DF B76 0DH B76 0DP B76 0DT B76 0DW B76 9DR B76 9DT B76 9EP B76 0BA B76 0DS B76 9DS B76 0DU B76 0EB |
| Lichfield Road | B76 9PL B76 9PP B76 0BB B76 0BD B76 9EN B76 9PR B76 9PT B76 9PW |
| Lock House Lane | B76 0DG |
| London Road | B75 5SA B75 6JY B75 6JZ |
| Marsh Lane | B76 0AA |
| Newlands Lane | B76 0BE B76 0BR |
| Oaklands | B76 9HD |
| Orchard Close | B76 9DX |
| Paddys Row | B76 0BS |
| Ryefield Lane | B76 9PY |
| Sandpits Close | B76 9EZ |
| School Lane | B76 0BW |
| St Nicholas Walk | B76 9EU |
| Tamworth Road | B75 5RX B76 9PS B76 9PX |
| The Gravel | B76 9QB |
| The Gravel North | B76 9QR |
| The Green | B76 0BP |
| The Mount | B76 9HR |
| The Paddock | B76 9HB |
| Wishaw Lane | B76 9DY B76 9EA B76 9EL |
| Withy Hill Road | B75 6JU |
Transport near Curdworth
-
Water Orton Station
-
Coleshill Parkway Station
-
Sutton Coldfield Station
-
Wylde Green Station
-
Chester Road Station
-
Four Oaks Station
-
Erdington Station
-
Wilnecote Station
- FAQ
- Price Paid By Year
- Property Type Price
Frequently asked questions about Curdworth
What is the average price for a property for sale in Curdworth?
The average price for a property for sale in Curdworth is £407,120. There are 3,252 property listings for sale in Curdworth.
What streets have the most expensive properties for sale in Curdworth?
The streets with the most expensive properties for sale in Curdworth are Bodymoor Heath Lane at an average of £975,000, Glebe Fields at an average of £515,000 and Kingsbury Road at an average of £492,400.
What streets have the most affordable properties for sale in Curdworth?
The streets with the most affordable properties for sale in Curdworth are Hams Lane at an average of £130,000, Farthing Lane at an average of £203,333 and Breeden Drive at an average of £279,500.
Which train stations are available in or near Curdworth?
Some of the train stations available in or near Curdworth are Water Orton, Coleshill Parkway and Sutton Coldfield.
Property Price Paid in Curdworth by Year
The average sold property price by year was:
| Year | Average Sold Price | Price Change |
Sold Properties
|
|---|---|---|---|
| 2025 | £386,840 | -6% |
11 Properties |
| 2024 | £408,395 | -3% |
30 Properties |
| 2023 | £420,321 | 1% |
14 Properties |
| 2022 | £416,982 | 2% |
28 Properties |
| 2021 | £408,184 | 11% |
38 Properties |
| 2020 | £363,395 | 11% |
24 Properties |
| 2019 | £322,373 | -20% |
23 Properties |
| 2018 | £387,082 | 7% |
34 Properties |
| 2017 | £359,770 | -6% |
25 Properties |
| 2016 | £380,675 | 17% |
20 Properties |
| 2015 | £316,130 | 7% |
23 Properties |
| 2014 | £294,176 | 19% |
17 Properties |
| 2013 | £238,772 | -8% |
20 Properties |
| 2012 | £258,315 | 3% |
19 Properties |
| 2011 | £249,819 | 8% |
13 Properties |
| 2010 | £231,078 | -8% |
16 Properties |
| 2009 | £248,662 | -20% |
12 Properties |
| 2008 | £297,614 | -4% |
25 Properties |
| 2007 | £310,657 | 22% |
35 Properties |
| 2006 | £243,021 | 10% |
23 Properties |
| 2005 | £217,999 | -9% |
34 Properties |
| 2004 | £237,065 | 15% |
29 Properties |
| 2003 | £200,982 | 34% |
44 Properties |
| 2002 | £133,627 | -18% |
34 Properties |
| 2001 | £157,637 | 16% |
31 Properties |
| 2000 | £132,958 | 6% |
25 Properties |
| 1999 | £124,833 | 17% |
31 Properties |
| 1998 | £103,433 | -3% |
33 Properties |
| 1997 | £106,279 | 22% |
32 Properties |
| 1996 | £83,045 | -6% |
32 Properties |
| 1995 | £88,120 | - |
17 Properties |
Property Price per Property Type in Curdworth
Here you can find historic sold price data in order to help with your property search.
The average Property Paid Price for specific property types in the last three years are:
| Property Type | Average Sold Price | Sold Properties |
|---|---|---|
| Semi Detached House | £349,320.00 | 16 Semi Detached Houses |
| Detached House | £502,537.00 | 27 Detached Houses |
| Terraced House | £269,500.00 | 12 Terraced Houses |

