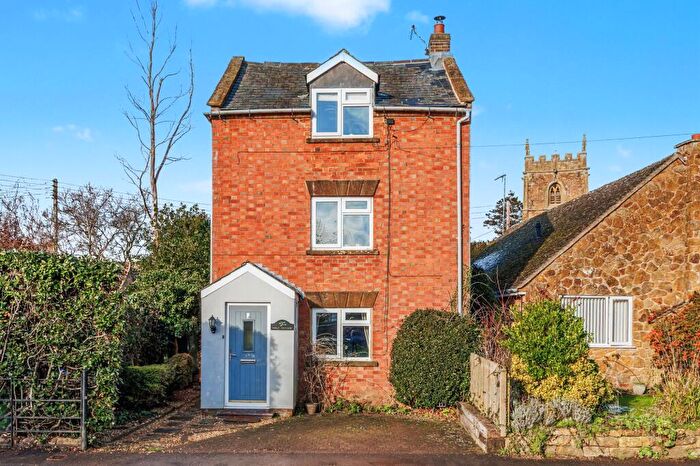
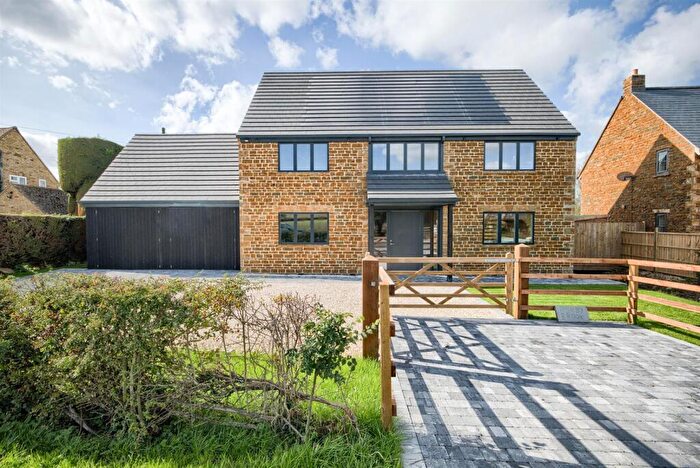
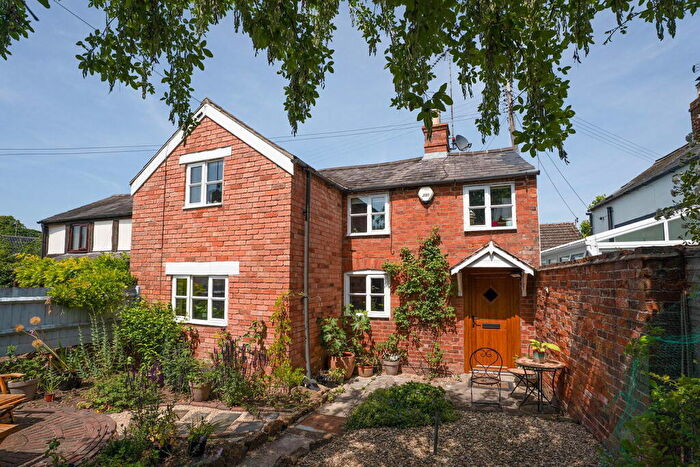
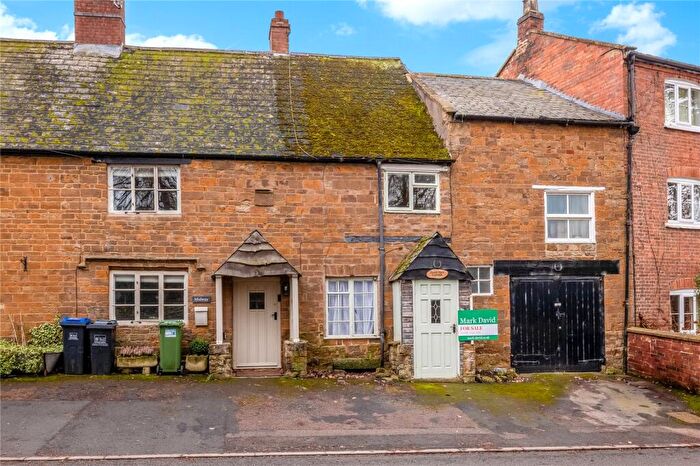
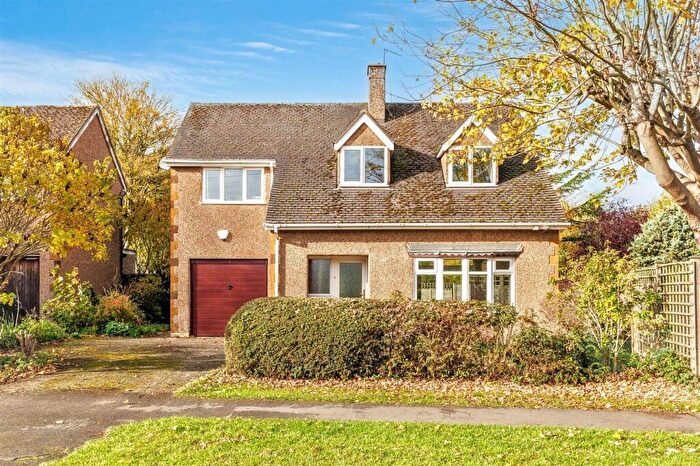
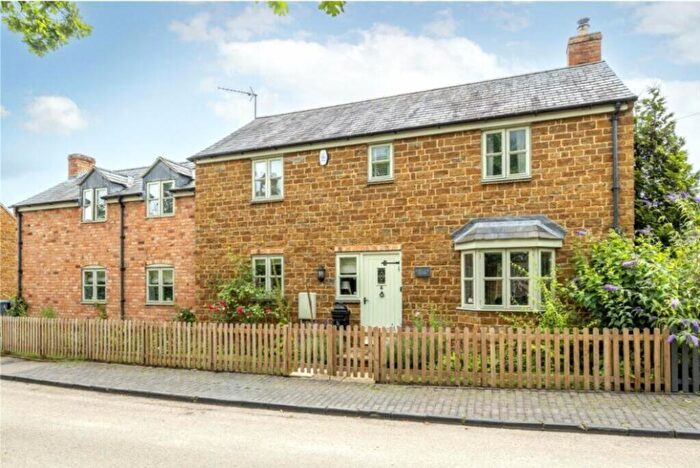
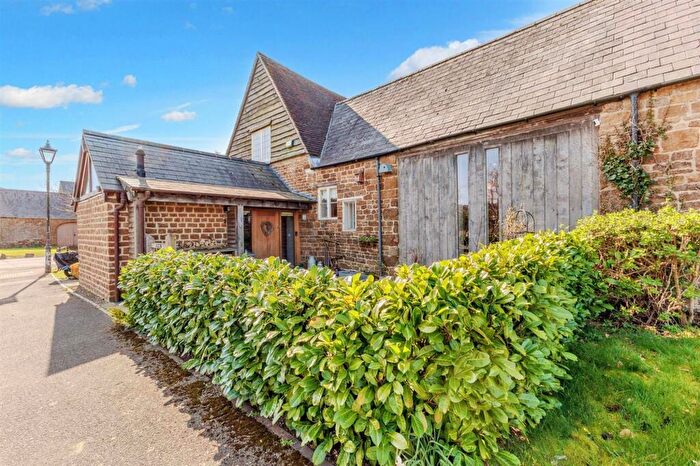
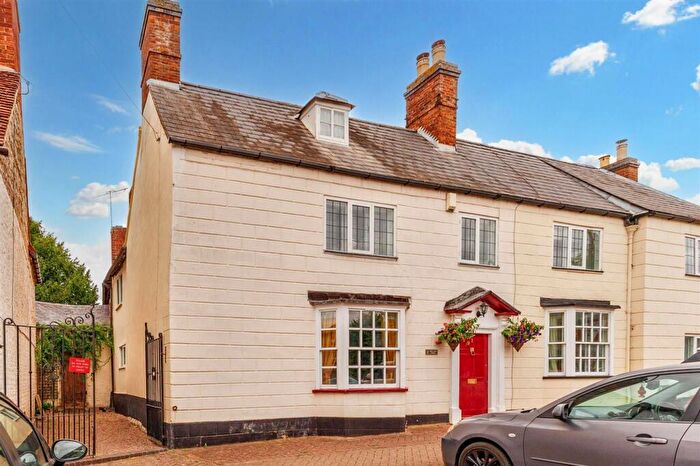
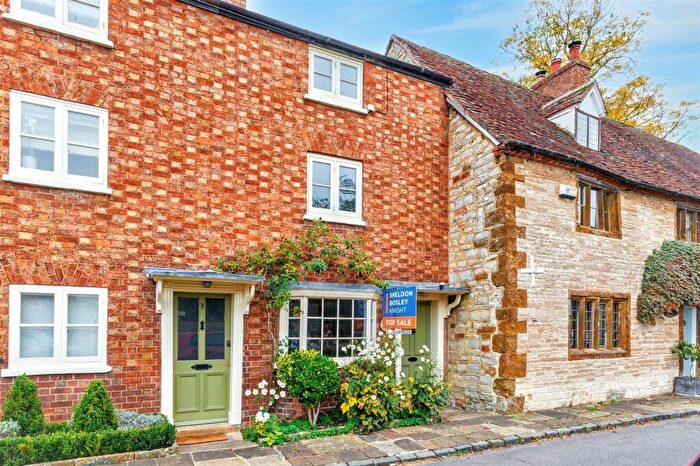
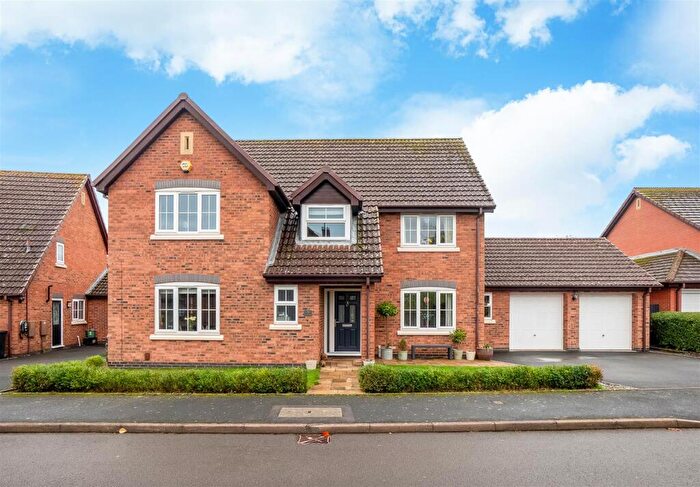
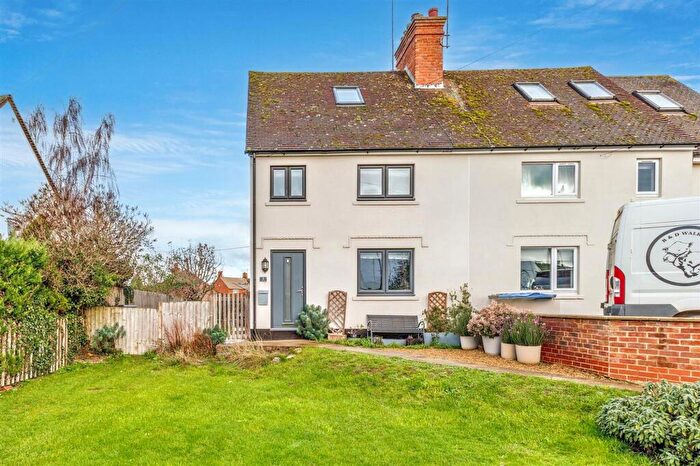
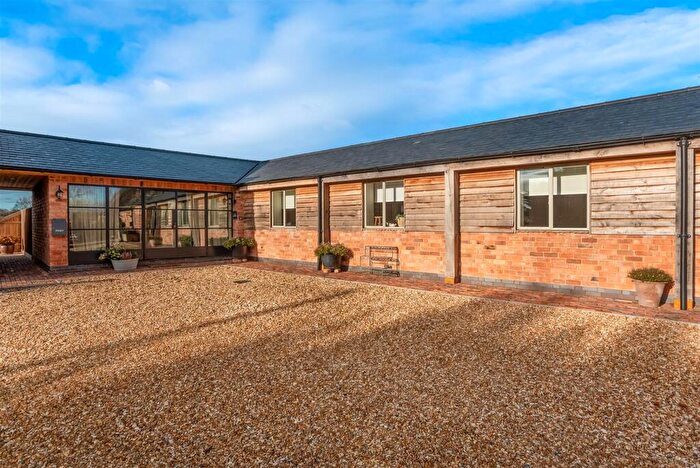
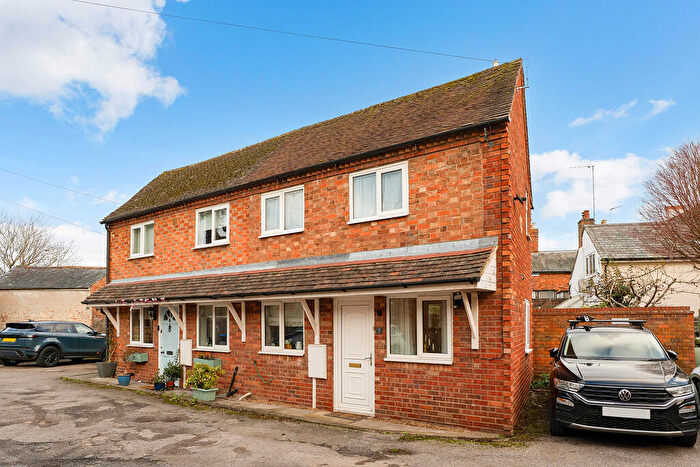
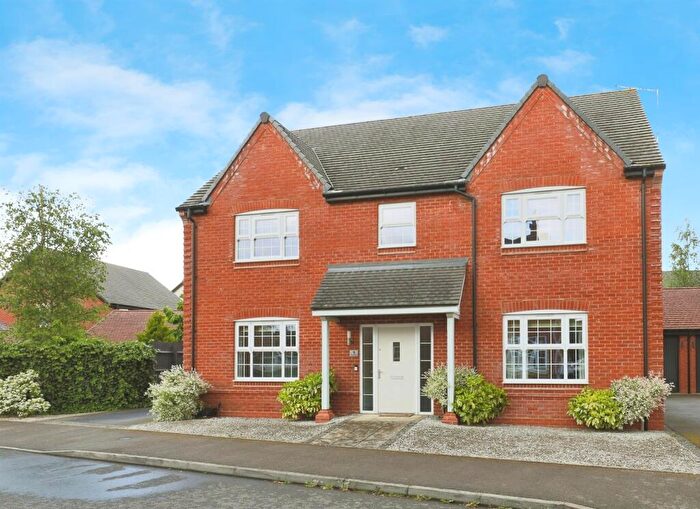
Houses for sale & to rent in Vale Of The Red Horse, Warwick
House Prices in Vale Of The Red Horse
Properties in Vale Of The Red Horse have an average house price of £594,728.00 and had 66 Property Transactions within the last 3 years¹.
Vale Of The Red Horse is an area in Warwick, Warwickshire with 798 households², where the most expensive property was sold for £1,795,000.00.
Properties for sale in Vale Of The Red Horse
Roads and Postcodes in Vale Of The Red Horse
Navigate through our locations to find the location of your next house in Vale Of The Red Horse, Warwick for sale or to rent.
| Streets | Postcodes |
|---|---|
| Avon Avenue | CV35 0SP |
| Avon Way | CV35 0ST |
| Back Lane | CV35 0QN CV35 0SJ |
| Baldwins Lane | CV35 0TX |
| Banbury Road | CV35 0PA CV35 0PB CV35 0PG |
| Bank Close | CV35 0NL |
| Bank View | CV35 0NQ |
| Beech Road | CV35 0QS |
| Bridge Road | CV35 0ND |
| Bunkers Hill | CV35 0QH |
| Church Farm Court | CV35 0TE |
| Epwell Road | CV35 0TN |
| Green Lane | CV35 0RB |
| Homestalls Meadow | CV35 0PZ |
| Jeffs Close | CV35 0TQ |
| Kiblers Lane | CV35 0PS |
| Kineton Road | CV35 0PH |
| Main Street | CV35 0QR CV35 0QT CV35 0SE CV35 0SF CV35 0SR CV35 0SW CV35 0TJ |
| Malletts Close | CV35 0SY |
| Middleton Close | CV35 0SQ CV35 0SS |
| Old Tree Cottages | CV35 0TB |
| Old Tree Lane | CV35 0TF |
| Oxhill | CV35 0RH |
| Oxhill Bridle Road | CV35 0QB |
| Oxhill Road | CV35 0SX |
| Parke Row | CV35 0TA |
| Peacock Cottages | CV35 0QU |
| Peacock Lane | CV35 0SG |
| Pillerton Road | CV35 0NH |
| Poolgate | CV35 0TS |
| Priory Lane | CV35 0PR |
| Rouse Lane | CV35 0NZ |
| Saddledon Street | CV35 0SH |
| Sandpits Close | CV35 0TU |
| Sandpits Road | CV35 0SZ |
| School Cottages | CV35 0QA |
| Shenington Road | CV35 0TG |
| Shennington Road | CV35 0TH |
| Smarts Lane | CV35 0TT |
| Stratford Road | CV35 0DX |
| The Acre | CV35 0PT |
| The Green | CV35 0SN |
| The Leys | CV35 0QX |
| The Old Coach Yard | CV35 0TR |
| The Sett | CV35 0RE |
| The Square | CV35 0SL |
| Town Ground | CV35 0NN |
| Tysoe Road | CV35 0BS CV35 0DY CV35 0RD |
| Verney Close | CV35 0NP |
| Walton Lane | CV35 0PJ |
| Watery Lane | CV35 0QP |
| Welchman Place | CV35 0SU |
| Whatcote Road | CV35 0RA |
| Windmill Way | CV35 0SB |
| CV35 0BN CV35 0BW CV35 0BY CV35 0BZ CV35 0NE CV35 0NG CV35 0PQ CV35 0QF CV35 0QJ |
Transport near Vale Of The Red Horse
-
Banbury Station
-
Stratford-Upon-Avon Station
-
Stratford Pkway Station
-
Moreton-In-Marsh Station
-
Leamington Spa Station
-
King's Sutton Station
-
Warwick Station
-
Wilmcote Station
-
Warwick Parkway Station
-
Honeybourne Station
- FAQ
- Price Paid By Year
- Property Type Price
Frequently asked questions about Vale Of The Red Horse
What is the average price for a property for sale in Vale Of The Red Horse?
The average price for a property for sale in Vale Of The Red Horse is £594,728. This amount is 49% higher than the average price in Warwick. There are 347 property listings for sale in Vale Of The Red Horse.
What streets have the most expensive properties for sale in Vale Of The Red Horse?
The streets with the most expensive properties for sale in Vale Of The Red Horse are Tysoe Road at an average of £1,236,500, Oxhill Bridle Road at an average of £951,875 and Oxhill at an average of £946,764.
What streets have the most affordable properties for sale in Vale Of The Red Horse?
The streets with the most affordable properties for sale in Vale Of The Red Horse are Middleton Close at an average of £297,857, Beech Road at an average of £368,000 and Kiblers Lane at an average of £395,000.
Which train stations are available in or near Vale Of The Red Horse?
Some of the train stations available in or near Vale Of The Red Horse are Banbury, Stratford-Upon-Avon and Stratford Pkway.
Property Price Paid in Vale Of The Red Horse by Year
The average sold property price by year was:
| Year | Average Sold Price | Price Change |
Sold Properties
|
|---|---|---|---|
| 2025 | £568,454 | -18% |
11 Properties |
| 2024 | £671,032 | 24% |
31 Properties |
| 2023 | £508,210 | -41% |
24 Properties |
| 2022 | £716,464 | 27% |
38 Properties |
| 2021 | £520,491 | 7% |
34 Properties |
| 2020 | £485,194 | 3% |
26 Properties |
| 2019 | £469,591 | 19% |
30 Properties |
| 2018 | £380,808 | -29% |
35 Properties |
| 2017 | £491,500 | 25% |
30 Properties |
| 2016 | £369,416 | 6% |
36 Properties |
| 2015 | £345,460 | -13% |
38 Properties |
| 2014 | £389,006 | 9% |
40 Properties |
| 2013 | £352,057 | 4% |
27 Properties |
| 2012 | £338,037 | 2% |
24 Properties |
| 2011 | £330,496 | -15% |
14 Properties |
| 2010 | £379,811 | 11% |
27 Properties |
| 2009 | £339,663 | 3% |
24 Properties |
| 2008 | £328,296 | 6% |
15 Properties |
| 2007 | £310,037 | -2% |
37 Properties |
| 2006 | £316,831 | -2% |
33 Properties |
| 2005 | £323,375 | 2% |
24 Properties |
| 2004 | £317,609 | 6% |
29 Properties |
| 2003 | £297,426 | 23% |
19 Properties |
| 2002 | £227,705 | 8% |
36 Properties |
| 2001 | £209,300 | 1% |
37 Properties |
| 2000 | £206,850 | 5% |
30 Properties |
| 1999 | £196,417 | 21% |
35 Properties |
| 1998 | £155,995 | 13% |
46 Properties |
| 1997 | £136,012 | 1% |
31 Properties |
| 1996 | £134,125 | 14% |
39 Properties |
| 1995 | £115,223 | - |
28 Properties |
Property Price per Property Type in Vale Of The Red Horse
Here you can find historic sold price data in order to help with your property search.
The average Property Paid Price for specific property types in the last three years are:
| Property Type | Average Sold Price | Sold Properties |
|---|---|---|
| Semi Detached House | £362,666.00 | 12 Semi Detached Houses |
| Detached House | £711,656.00 | 42 Detached Houses |
| Terraced House | £417,541.00 | 12 Terraced Houses |

