
Houses for sale in Warwick, Warwickshire
House Prices in Warwick
Properties in Warwick have an average house price of £401k and had 2,749 Property Transactions within the last 3 years.¹
Warwick is an area in Warwickshire with 26,972 households², where the most expensive property was sold for £6.21M.
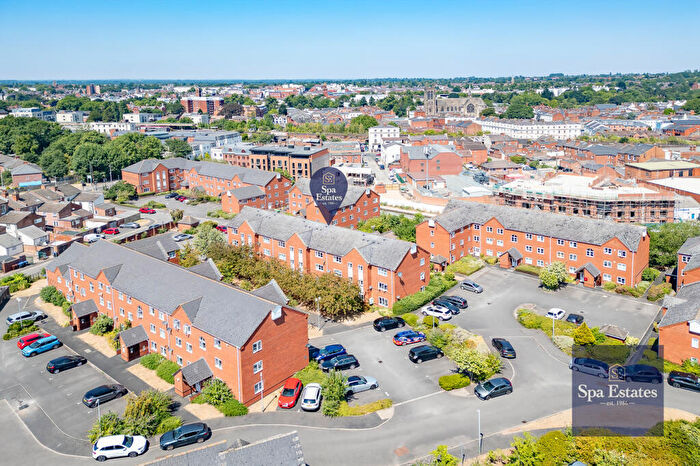
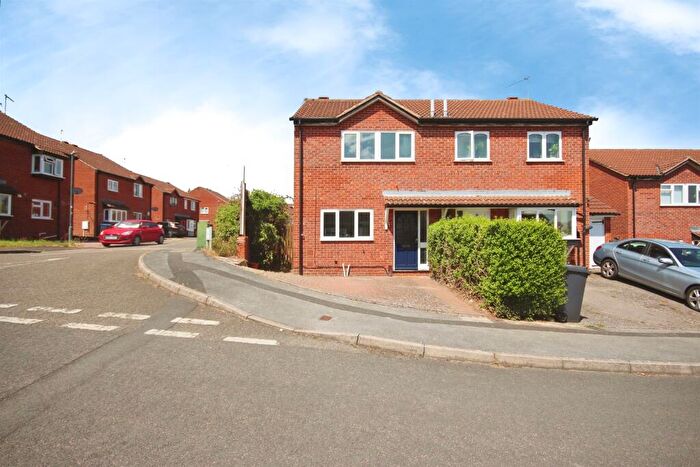
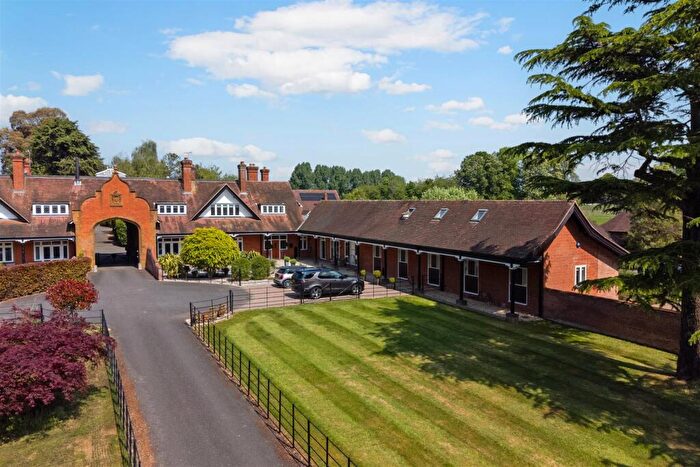
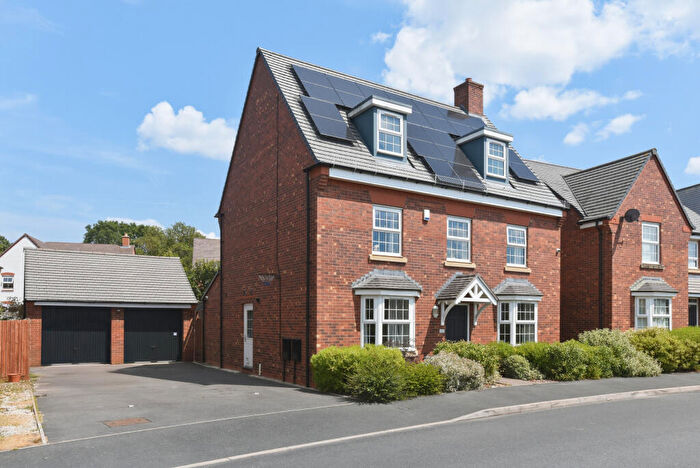
Properties for sale in Warwick
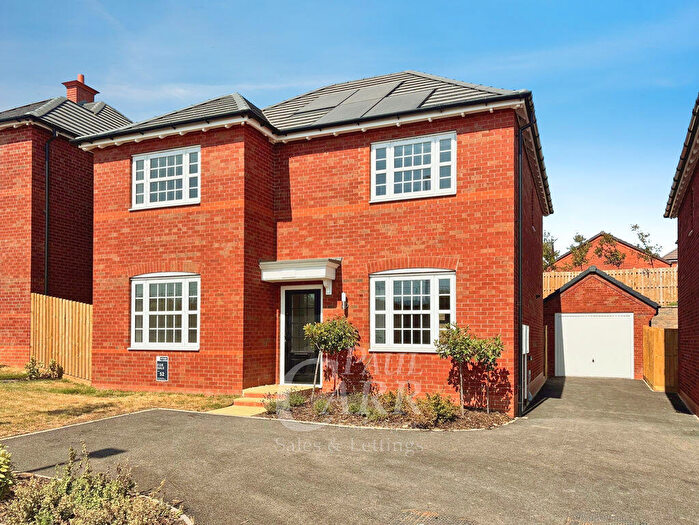
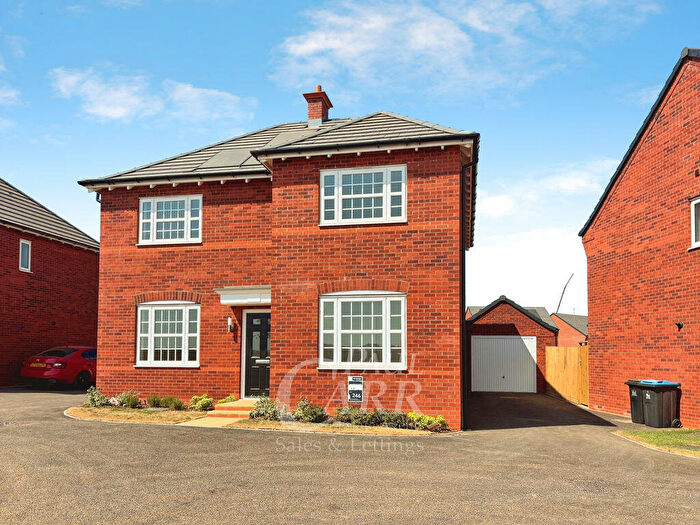
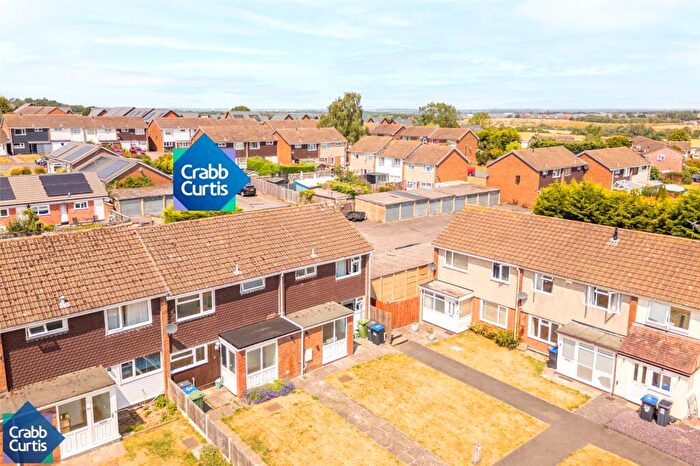
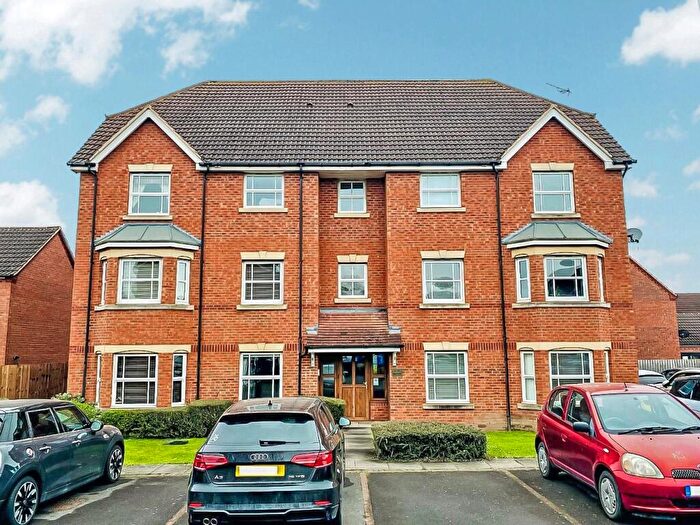
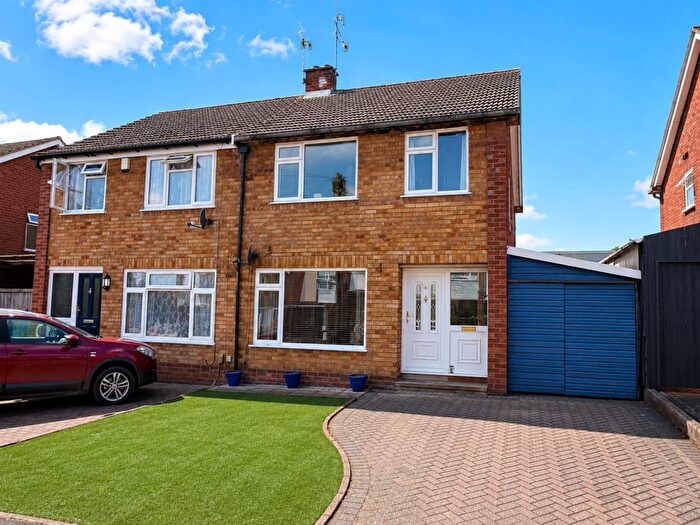
![]()
If you are looking to sell your house, let it out, or receive a property valuation, an expert can help you.
Click the button below to get started.


Neighbourhoods in Warwick
Navigate through our locations to find the location of your next house in Warwick, Warwickshire for sale or to rent.
- Bishops Tachbrook
- Budbrooke
- Burton Dassett
- Claverdon
- Ettington
- Harbury
- Kineton
- Lapworth
- Leek Wootton
- Snitterfield
- Southam
- Vale Of The Red Horse
- Warwick North
- Warwick South
- Warwick West
- Wellesbourne
- Whitnash
- Warwick Saltisford
- Warwick Aylesford
- Warwick Myton & Heathcote
- Warwick All Saints & Woodloes
- Cubbington & Leek Wootton
- Leamington Brunswick
- Bishop's Itchington
- Red Horse
- Brailes & Compton
- Kenilworth Abbey & Arden
- Wellesbourne East
- Wellesbourne West
- Wellesbourne North & Rural
- Gaydon, Kineton & Upper Lighthorne
- Tysoe
- Wellesbourne East & Rural
- Wellesbourne South
Property price trends in Warwick
According to the latest Land Registry data, the average home in Warwick sold for £432,723 in 2026. That figure comes from a substantial record of 36,174 sales logged over the past 31 years.
Prices have continued to climb over the last three years. Compared with 2023, when the typical sale came in around £402,438, that's a rise of roughly 7.5%.
Looking back five years, average prices are up about 12.5% since 2021, a gain of around £48,084 in cash terms.
Zoom out to the past decade for the fuller picture. Back in 2016, homes here averaged £341,521, so the typical sold price has climbed about 26.7% since then, roughly 2.4% a year. Stretch the view to fifteen years and that annual pace edges up closer to 4%.
Frequently asked questions about Warwick
What is the average price for a property for sale in Warwick?
The average price for a property for sale in Warwick is £400,872. This amount is 17% higher than the average price in Warwickshire. There are more than 10,000 property listings for sale in Warwick.
What locations have the most expensive properties for sale in Warwick?
The locations with the most expensive properties for sale in Warwick are Claverdon at an average of £748,127, Harbury at an average of £746,500 and Red Horse at an average of £720,500.
What locations have the most affordable properties for sale in Warwick?
The locations with the most affordable properties for sale in Warwick are Warwick All Saints & Woodloes at an average of £250,093, Warwick North at an average of £304,990 and Warwick West at an average of £311,198.
Which train stations are available in or near Warwick?
Some of the train stations available in or near Warwick are Warwick, Warwick Parkway and Leamington Spa.
Property Price Paid in Warwick by Year
The average sold property price by year was:
| Year | Average Sold Price | Price Change |
Sold Properties
|
|---|---|---|---|
| 2026 | £432,723 | 8% |
65 Properties |
| 2025 | £396,313 | -1% |
893 Properties |
| 2024 | £401,616 | -0,2% |
978 Properties |
| 2023 | £402,438 | -3% |
813 Properties |
| 2022 | £413,742 | 7% |
1,031 Properties |
| 2021 | £384,639 | 4% |
1,355 Properties |
| 2020 | £367,529 | 3% |
992 Properties |
| 2019 | £355,729 | 3% |
1,173 Properties |
| 2018 | £346,115 | -0,3% |
1,327 Properties |
| 2017 | £347,093 | 2% |
1,307 Properties |
Property Price per Property Type in Warwick
Here you can find historic sold price data in order to help with your property search.
The average Property Paid Price for specific property types in the last three years are:
| Property Type | Average Sold Price | Sold Properties |
|---|---|---|
| Semi Detached House | £352,975.00 | 680 Semi Detached Houses |
| Terraced House | £325,819.00 | 701 Terraced Houses |
| Detached House | £588,228.00 | 921 Detached Houses |
| Flat | £205,407.00 | 447 Flats |
Transport in Warwick
Please see below transportation links in this area:
