
Houses for sale & to rent in Whitnash, Warwick
House Prices in Whitnash
Properties in Whitnash have an average house price of £414k and had 21 Property Transactions within the last 3 years¹.
Whitnash is an area in Warwick, Warwickshire with 280 households², where the most expensive property was sold for £723k.
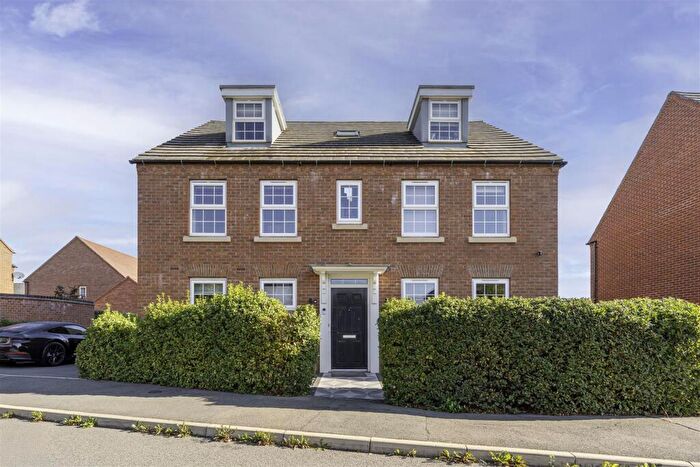
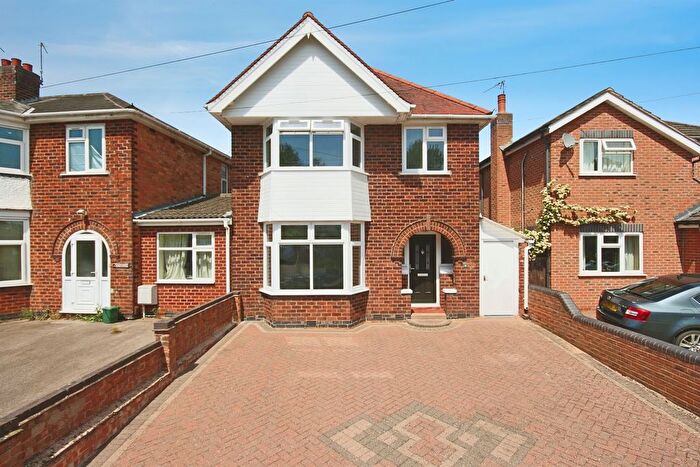
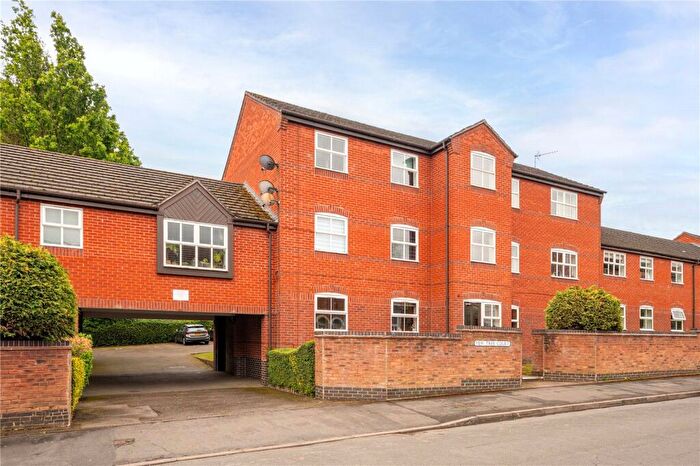
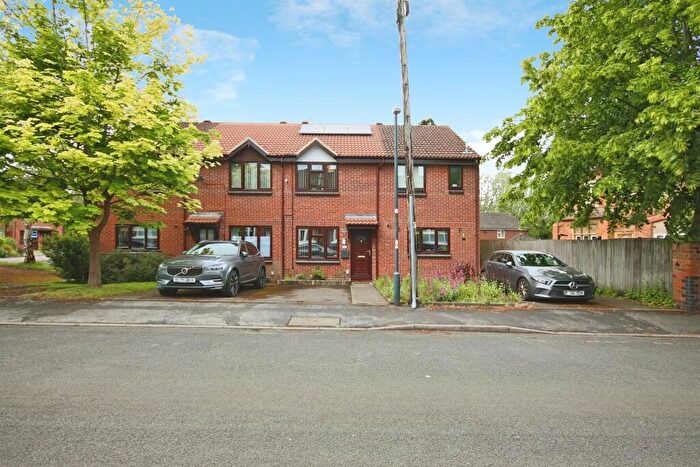
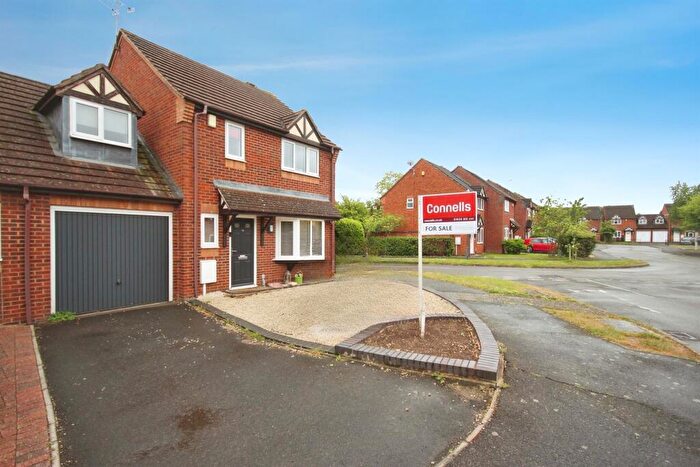
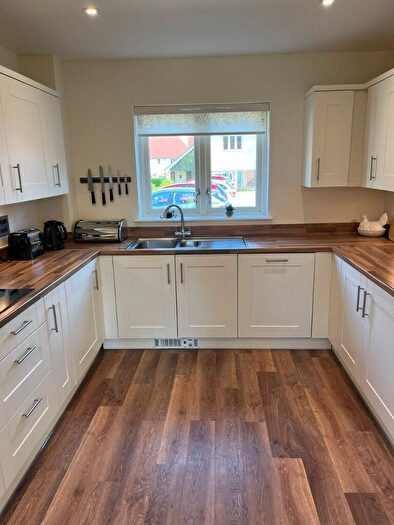
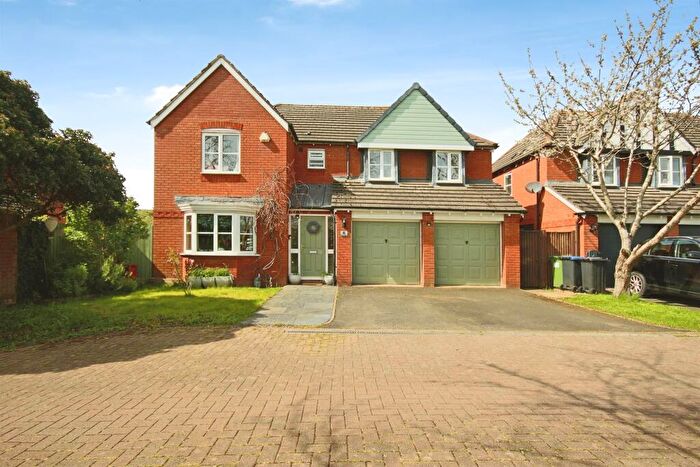
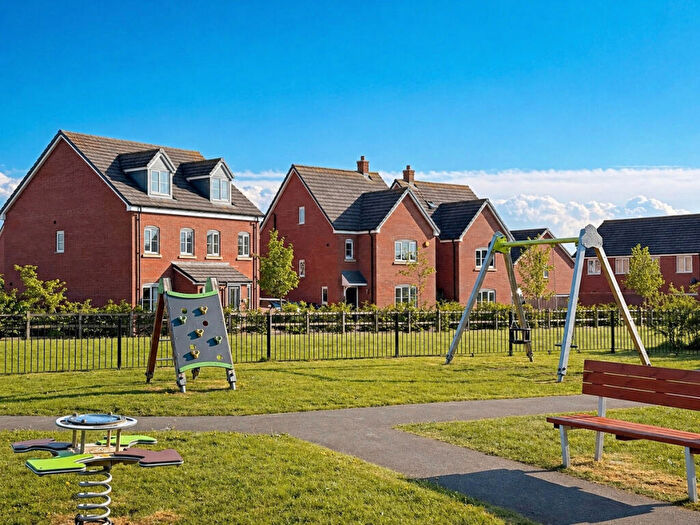
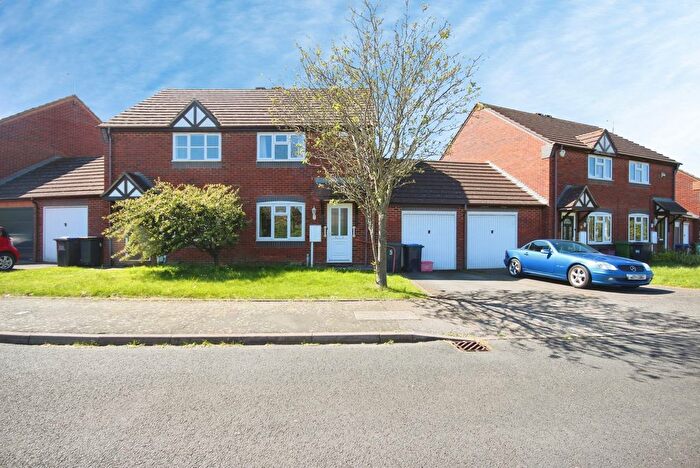
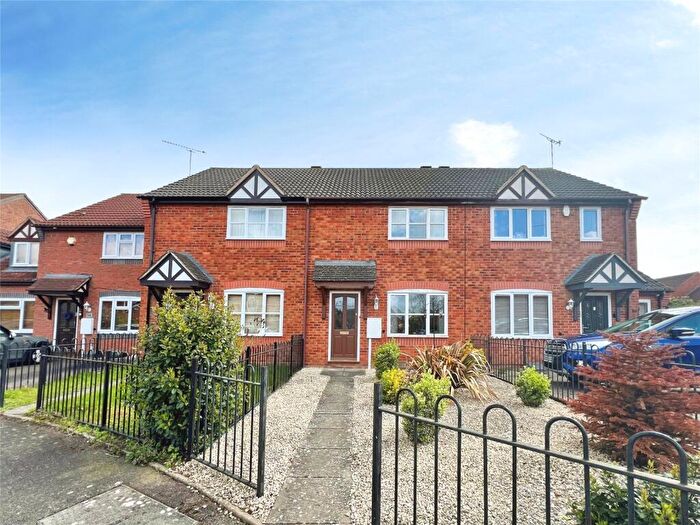
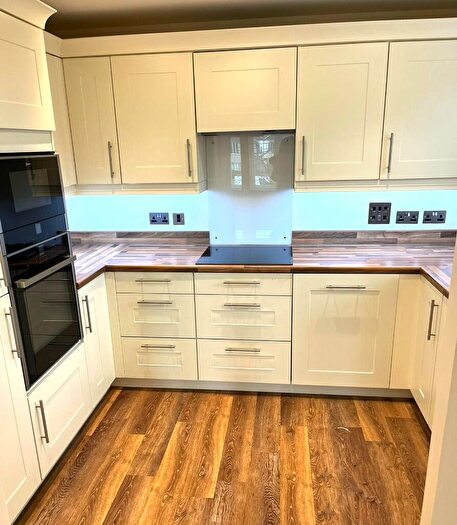
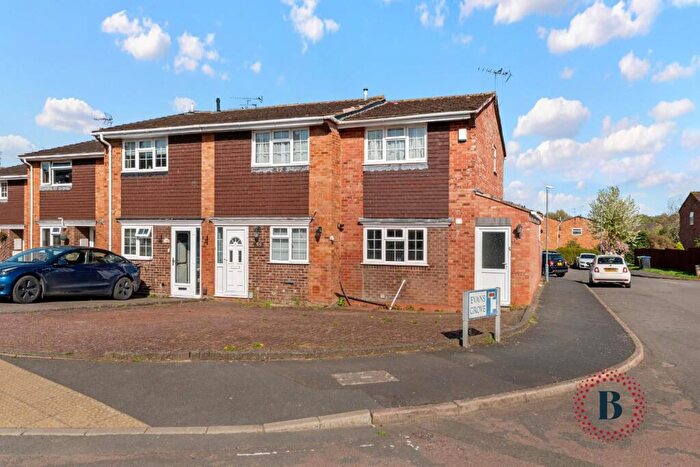
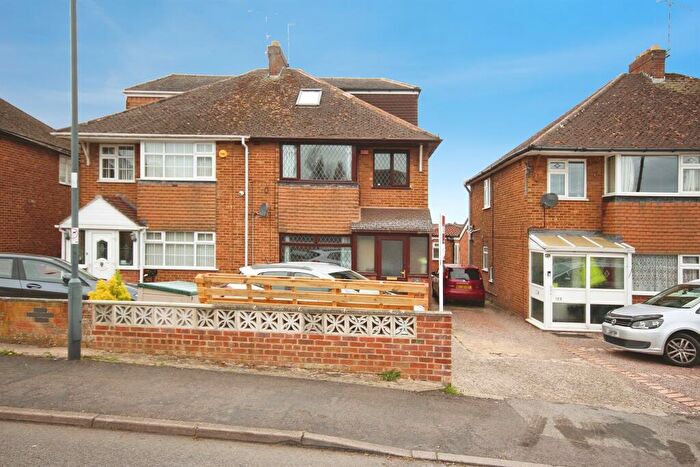
Properties for sale in Whitnash
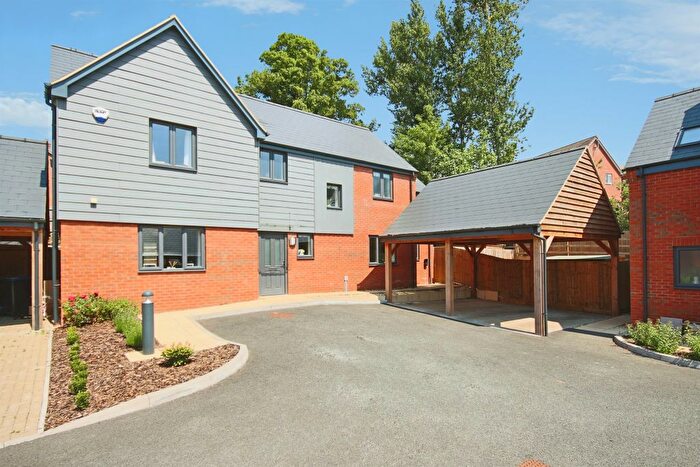
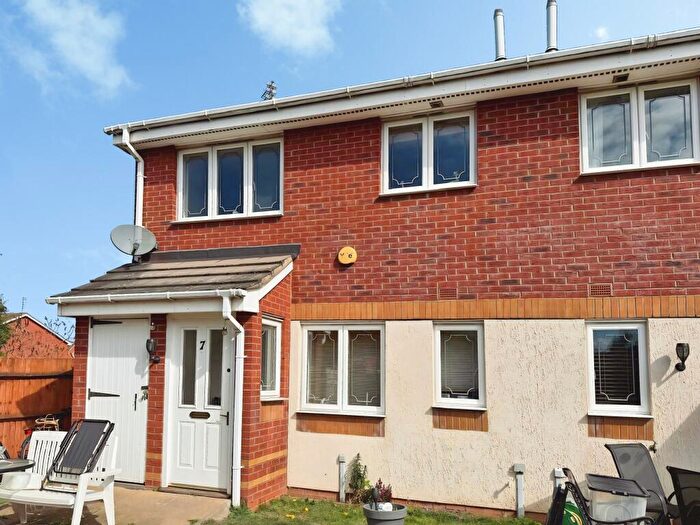
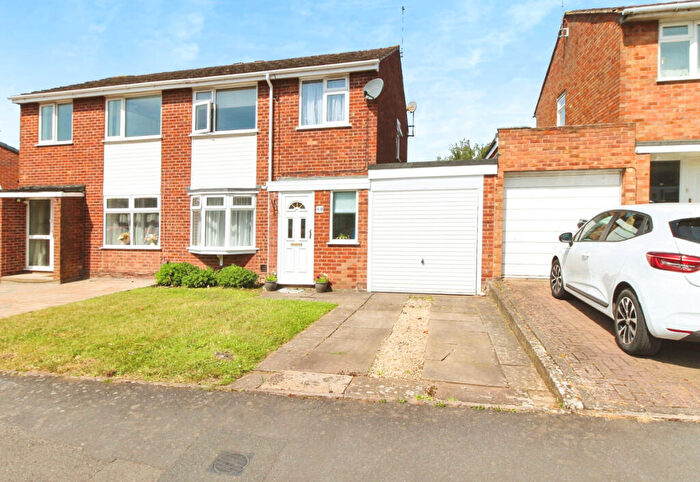
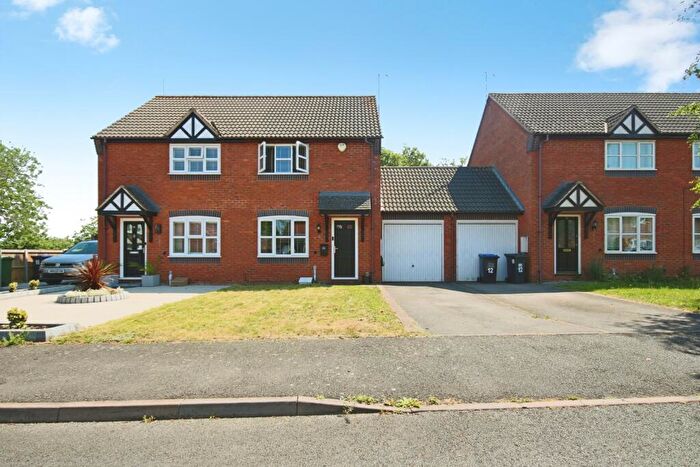
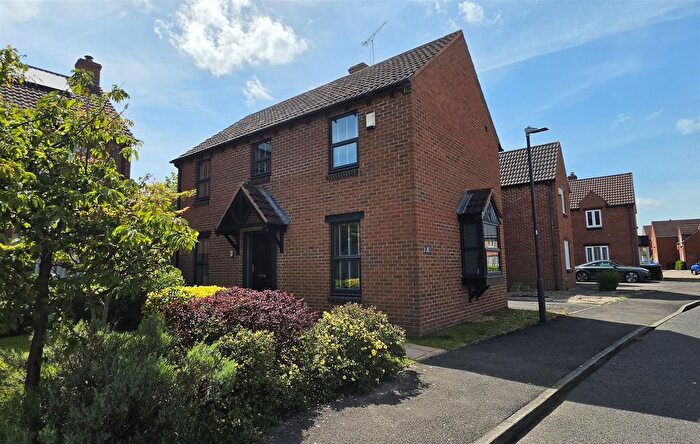
![]()
If you are looking to sell your house, let it out, or receive a property valuation, an expert can help you.
Click the button below to get started.

Roads and Postcodes in Whitnash
Navigate through our locations to find the location of your next house in Whitnash, Warwick for sale or to rent.
| Streets | Postcodes |
|---|---|
| Banquo Approach | CV34 6GB |
| Eglamour Way | CV34 6GE |
| Juliet Drive | CV34 6GN |
| Patience Grove | CV34 6GG |
| Peto Grove | CV34 6GT |
| Priam Circus | CV34 6GF |
| Rambures Close | CV34 6GW |
| Sir Toby Belch Drive | CV34 6GP |
| Troilus Court | CV34 6EZ |
Transport near Whitnash

- FAQ
- Price Paid By Year
- Property Type Price
Frequently asked questions about Whitnash
What is the average price for a property for sale in Whitnash?
The average price for a property for sale in Whitnash is £413,702. This amount is 3% higher than the average price in Warwick. There are 837 property listings for sale in Whitnash.
What streets have the most expensive properties for sale in Whitnash?
The streets with the most expensive properties for sale in Whitnash are Juliet Drive at an average of £507,062 and Rambures Close at an average of £389,999.
What streets have the most affordable properties for sale in Whitnash?
The streets with the most affordable properties for sale in Whitnash are Sir Toby Belch Drive at an average of £370,000 and Banquo Approach at an average of £383,500.
Which train stations are available in or near Whitnash?
Some of the train stations available in or near Whitnash are Leamington Spa, Warwick and Warwick Parkway.
Property Price Paid in Whitnash by Year
The average sold property price by year was:
| Year | Average Sold Price | Price Change |
Sold Properties
|
|---|---|---|---|
| 2026 | £675,000 | 42% |
1 Property |
| 2025 | £389,000 | -18% |
5 Properties |
| 2024 | £458,415 | 20% |
6 Properties |
| 2023 | £368,583 | 5% |
9 Properties |
| 2022 | £348,888 | 2% |
9 Properties |
| 2021 | £340,632 | 18% |
16 Properties |
| 2020 | £278,749 | -41% |
2 Properties |
| 2019 | £393,250 | 22% |
4 Properties |
| 2018 | £307,463 | 1% |
11 Properties |
| 2017 | £304,850 | -0,2% |
10 Properties |
| 2016 | £305,573 | -1% |
13 Properties |
| 2015 | £310,001 | 9% |
14 Properties |
| 2014 | £280,871 | 7% |
16 Properties |
| 2013 | £259,931 | 29% |
8 Properties |
| 2012 | £184,687 | -24% |
8 Properties |
| 2011 | £229,540 | -39% |
11 Properties |
| 2010 | £320,049 | 16% |
9 Properties |
| 2009 | £269,820 | -1% |
10 Properties |
| 2008 | £271,333 | -2% |
6 Properties |
| 2007 | £277,925 | 15% |
20 Properties |
| 2006 | £236,623 | 11% |
23 Properties |
| 2005 | £209,810 | -15% |
22 Properties |
| 2004 | £240,739 | 20% |
19 Properties |
| 2003 | £191,761 | -7% |
63 Properties |
| 2002 | £205,777 | 25% |
78 Properties |
| 2001 | £155,087 | - |
58 Properties |
Property Price per Property Type in Whitnash
Here you can find historic sold price data in order to help with your property search.
The average Property Paid Price for specific property types in the last three years are:
| Property Type | Average Sold Price | Sold Properties |
|---|---|---|
| Semi Detached House | £397,500.00 | 2 Semi Detached Houses |
| Terraced House | £361,349.00 | 10 Terraced Houses |
| Flat | £165,000.00 | 1 Flat |
| Detached House | £514,281.00 | 8 Detached Houses |