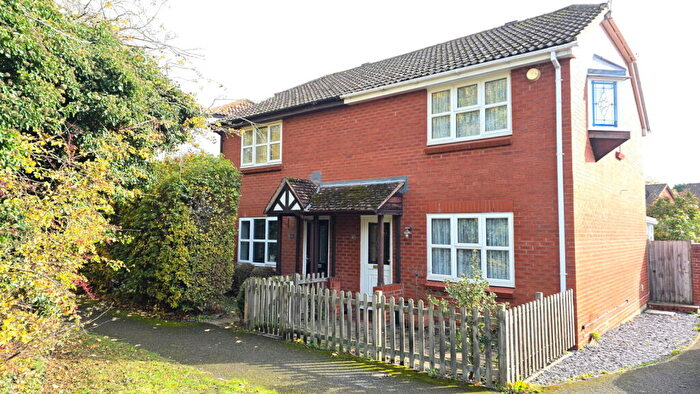
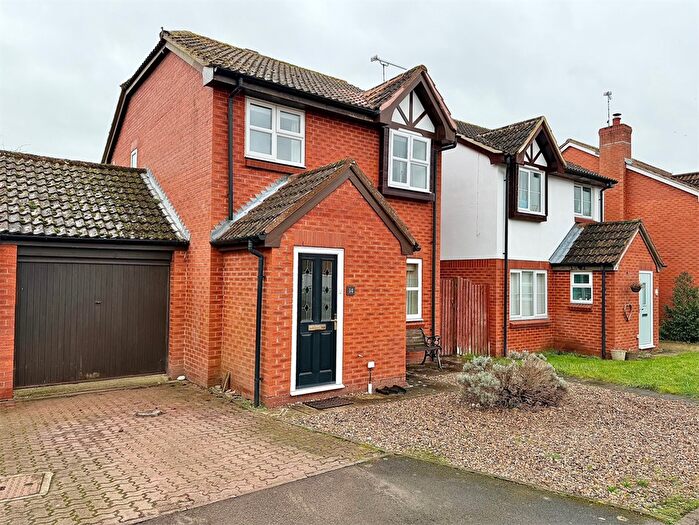
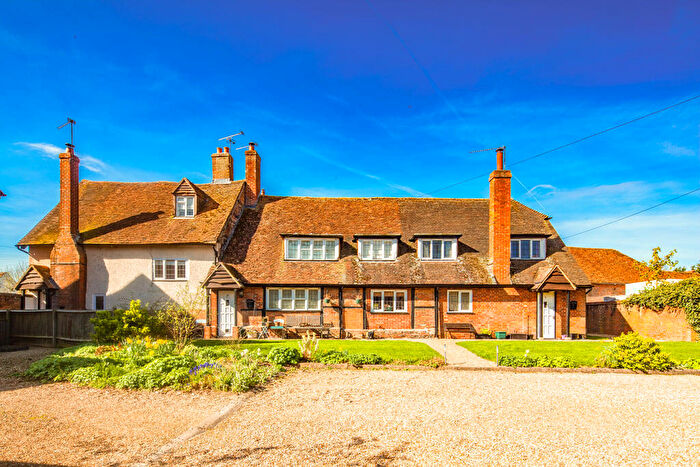
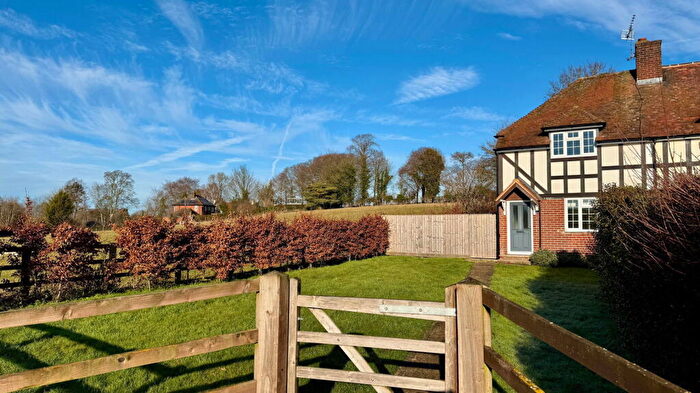
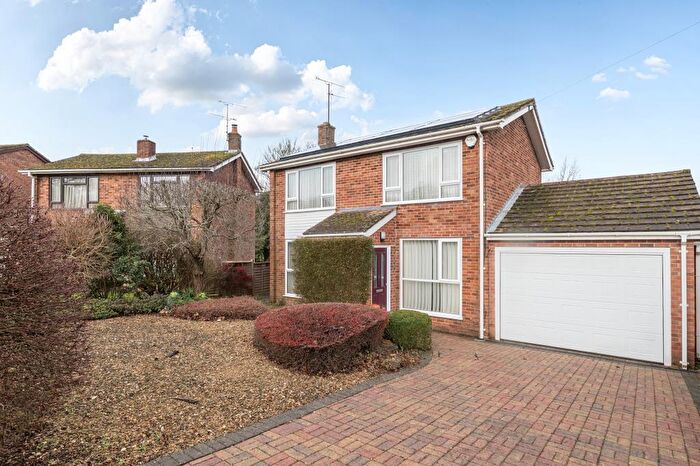
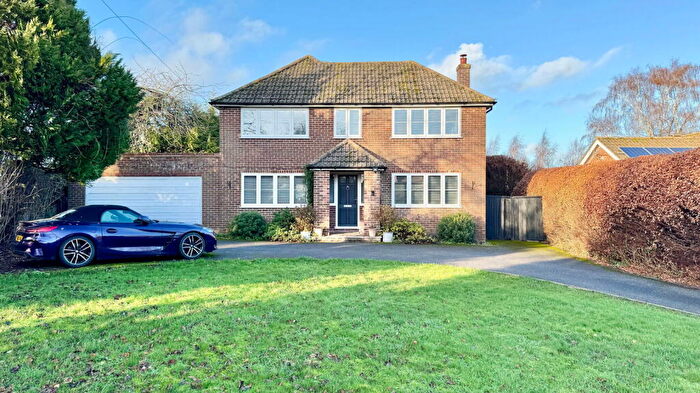
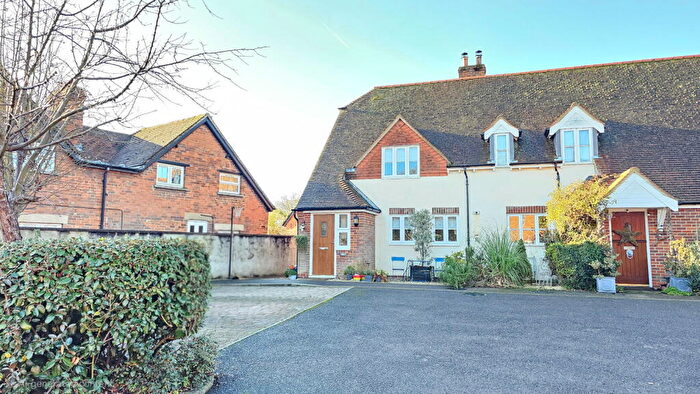
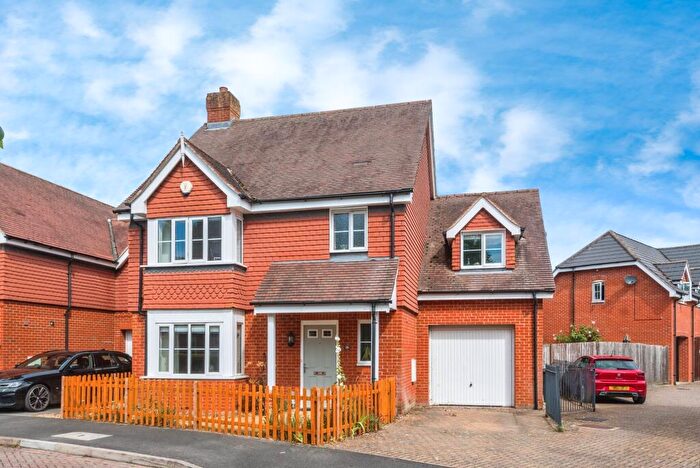
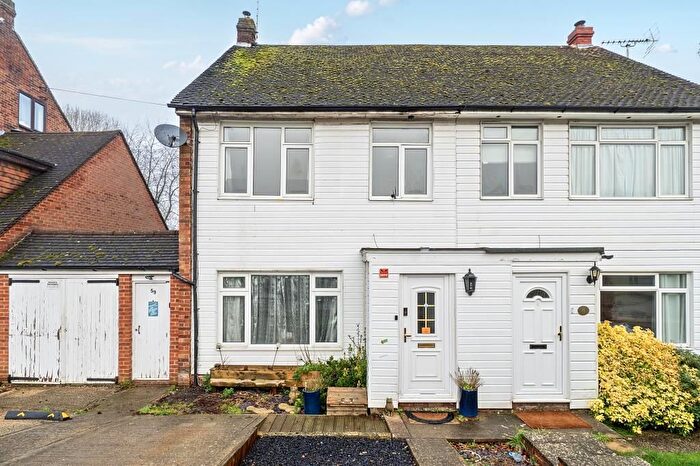
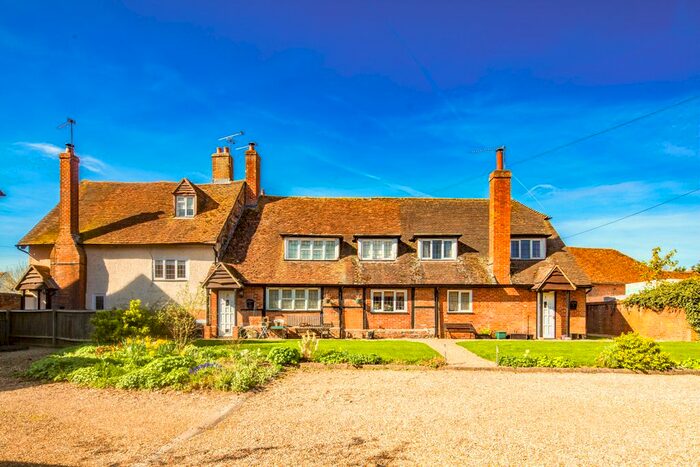
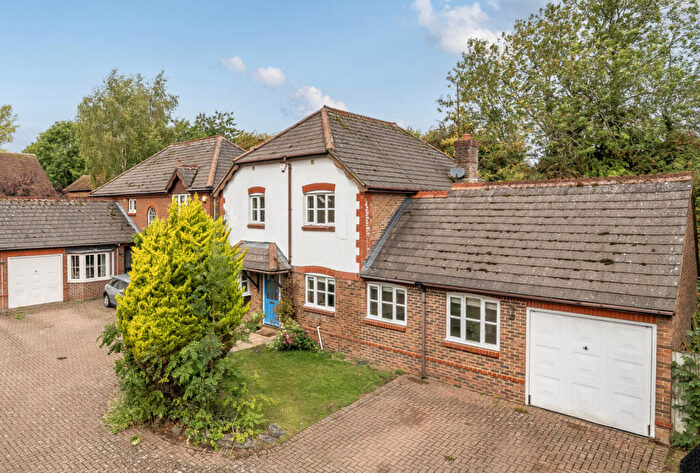
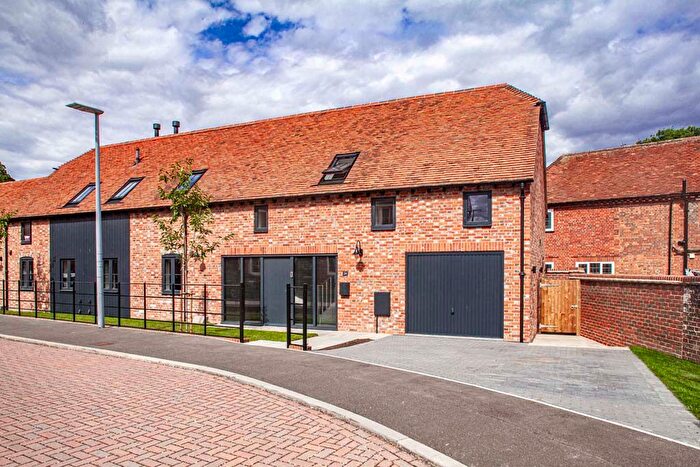
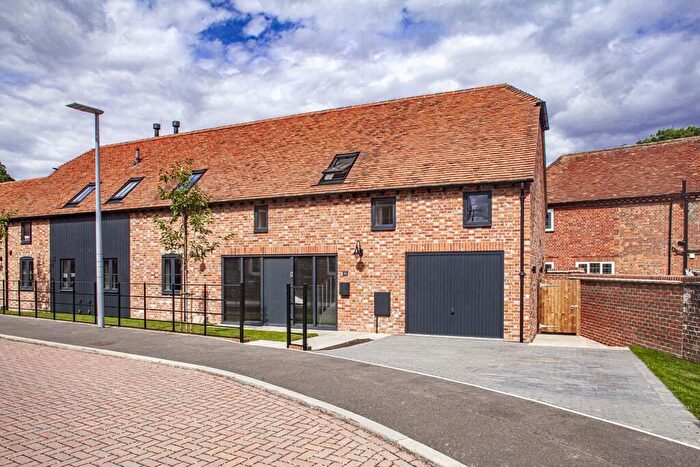
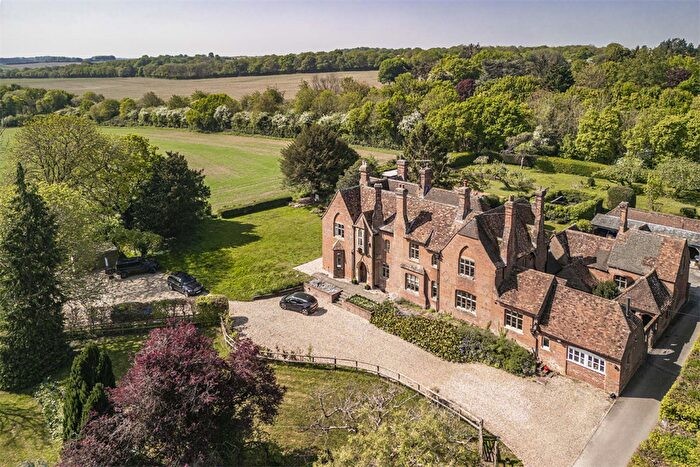
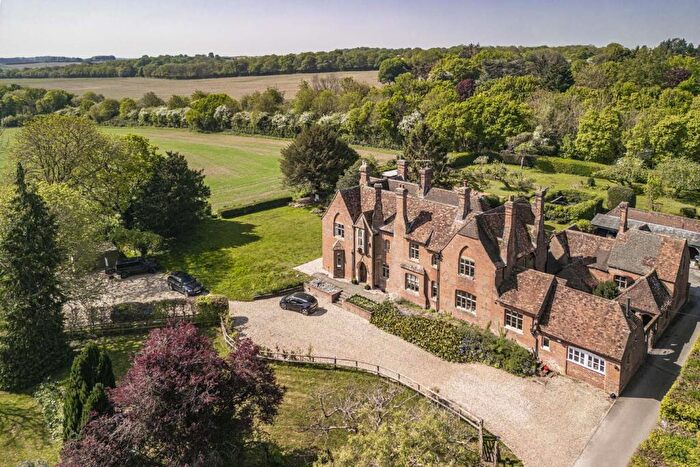
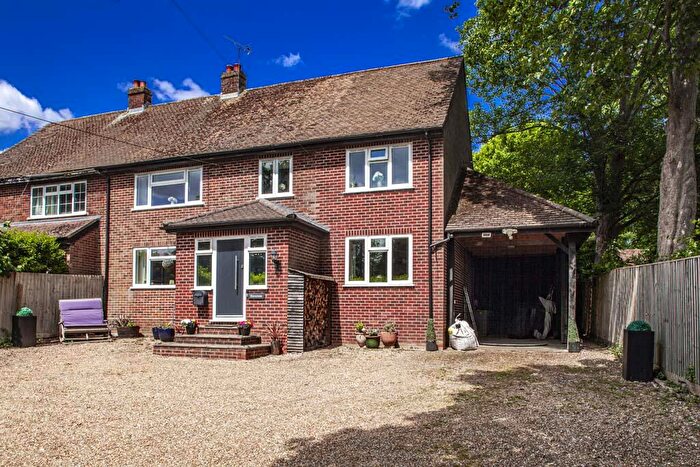
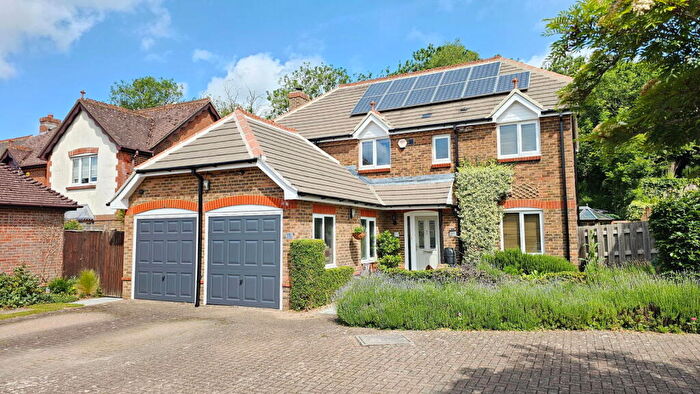
Houses for sale & to rent in Compton, Newbury
House Prices in Compton
Properties in Compton have an average house price of £566,227.00 and had 44 Property Transactions within the last 3 years¹.
Compton is an area in Newbury, West Berkshire with 562 households², where the most expensive property was sold for £1,950,000.00.
Properties for sale in Compton
Previously listed properties in Compton
Roads and Postcodes in Compton
Navigate through our locations to find the location of your next house in Compton, Newbury for sale or to rent.
| Streets | Postcodes |
|---|---|
| Aldworth Road | RG20 6RD |
| Burrell Road | RG20 6NP RG20 6NS RG20 6QX |
| Cheap Street | RG20 6NH RG20 6QH |
| Churn Road | RG20 6PP |
| Coombe Road | RG20 6RG RG20 6RQ |
| Downs Road | RG20 6RE |
| Fairfield | RG20 6PJ |
| High Street | RG20 6NJ RG20 6NL RG20 6QT |
| Hockham Road | RG20 6QN |
| Horn Street | RG20 6QS |
| Ilsley Gardens | RG20 7PF |
| Ilsley Road | RG20 7PD RG20 7PG RG20 7PH |
| Lansdowne Cottages | RG20 7PQ |
| Lowbury Gardens | RG20 6NN |
| Manor Crescent | RG20 6NR RG20 6NU |
| Mayfield Cottages | RG20 7PL |
| Meadow Close | RG20 6QQ |
| Newbury Lane | RG20 6PA RG20 6PB |
| Newbury Road | RG20 7RH RG20 7RJ |
| Roden Cottages | RG20 6PS |
| Roden Down Mews | RG20 6QP |
| School Road | RG20 6QU |
| Shepherds Mount | RG20 6QY RG20 6QZ |
| Shepherds Rise | RG20 6RA |
| Wallingford Road | RG20 6PT RG20 6PU |
| Warnham Cottages | RG20 7PW |
| Westfields | RG20 6NX |
| Whitewalls Close | RG20 6QG |
| Wilson Close | RG20 6NA |
| Worlds End | RG20 8SD |
| Yew Tree Mews | RG20 6NQ |
| Yew Tree Stables | RG20 6NG |
Transport near Compton
-
Goring and Streatley Station
-
Cholsey Station
-
Didcot Parkway Station
-
Pangbourne Station
-
Thatcham Station
-
Newbury Racecourse Station
-
Newbury Station
-
Appleford Station
-
Midgham Station
-
Aldermaston Station
- FAQ
- Price Paid By Year
- Property Type Price
Frequently asked questions about Compton
What is the average price for a property for sale in Compton?
The average price for a property for sale in Compton is £566,227. This amount is 38% higher than the average price in Newbury. There are 112 property listings for sale in Compton.
What streets have the most expensive properties for sale in Compton?
The streets with the most expensive properties for sale in Compton are Wallingford Road at an average of £1,950,000, Coombe Road at an average of £1,885,000 and Aldworth Road at an average of £982,500.
What streets have the most affordable properties for sale in Compton?
The streets with the most affordable properties for sale in Compton are Wilson Close at an average of £250,000, Meadow Close at an average of £284,000 and Westfields at an average of £390,000.
Which train stations are available in or near Compton?
Some of the train stations available in or near Compton are Goring and Streatley, Cholsey and Didcot Parkway.
Property Price Paid in Compton by Year
The average sold property price by year was:
| Year | Average Sold Price | Price Change |
Sold Properties
|
|---|---|---|---|
| 2025 | £759,045 | 33% |
11 Properties |
| 2024 | £511,071 | 5% |
21 Properties |
| 2023 | £486,000 | -13% |
12 Properties |
| 2022 | £550,314 | 31% |
27 Properties |
| 2021 | £379,794 | -25% |
29 Properties |
| 2020 | £474,993 | -4% |
15 Properties |
| 2019 | £492,907 | 2% |
14 Properties |
| 2018 | £484,964 | 16% |
17 Properties |
| 2017 | £408,565 | -14% |
23 Properties |
| 2016 | £467,408 | 16% |
17 Properties |
| 2015 | £392,609 | -8% |
27 Properties |
| 2014 | £424,337 | 18% |
21 Properties |
| 2013 | £348,974 | -10% |
30 Properties |
| 2012 | £382,233 | 17% |
21 Properties |
| 2011 | £318,629 | -5% |
22 Properties |
| 2010 | £335,538 | 13% |
13 Properties |
| 2009 | £291,193 | -22% |
39 Properties |
| 2008 | £356,271 | 10% |
18 Properties |
| 2007 | £320,472 | 8% |
20 Properties |
| 2006 | £295,886 | 23% |
28 Properties |
| 2005 | £227,969 | -25% |
31 Properties |
| 2004 | £285,848 | 4% |
27 Properties |
| 2003 | £275,707 | 12% |
19 Properties |
| 2002 | £241,628 | 21% |
24 Properties |
| 2001 | £189,948 | 11% |
25 Properties |
| 2000 | £168,946 | 4% |
16 Properties |
| 1999 | £162,712 | -14% |
32 Properties |
| 1998 | £185,056 | 34% |
23 Properties |
| 1997 | £121,887 | 11% |
33 Properties |
| 1996 | £109,011 | 10% |
18 Properties |
| 1995 | £98,205 | - |
17 Properties |
Property Price per Property Type in Compton
Here you can find historic sold price data in order to help with your property search.
The average Property Paid Price for specific property types in the last three years are:
| Property Type | Average Sold Price | Sold Properties |
|---|---|---|
| Semi Detached House | £474,307.00 | 13 Semi Detached Houses |
| Detached House | £738,571.00 | 21 Detached Houses |
| Terraced House | £363,500.00 | 6 Terraced Houses |
| Flat | £264,250.00 | 4 Flats |

