Houses for sale & to rent in Bucklebury, Thatcham
House Prices in Bucklebury
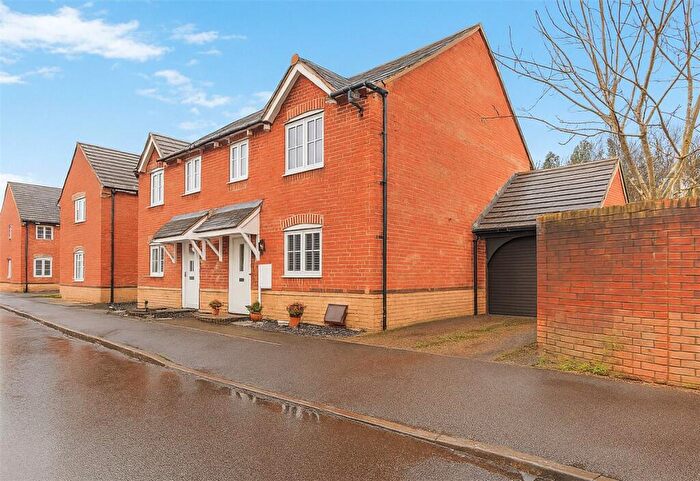
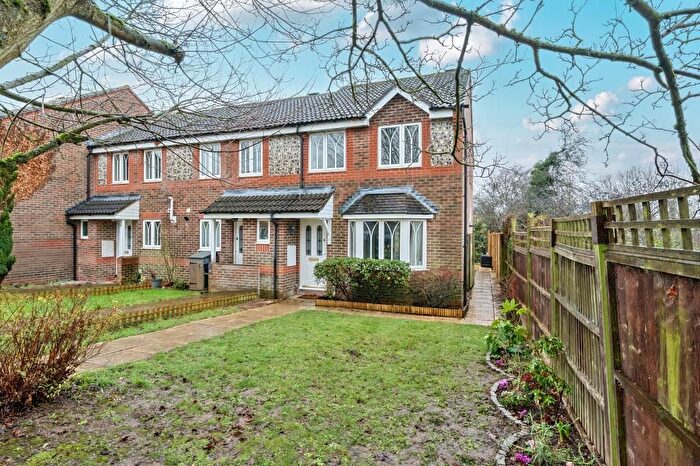
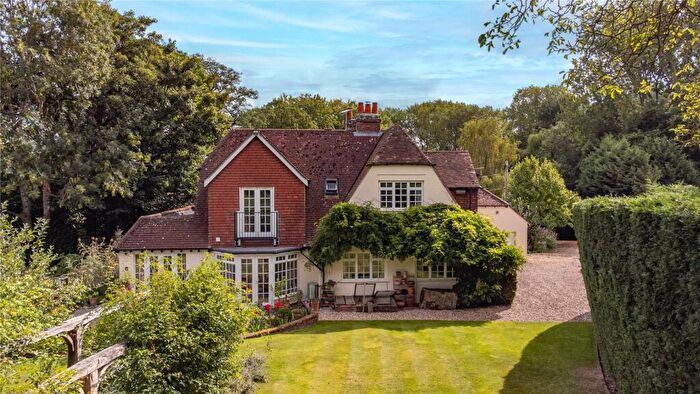
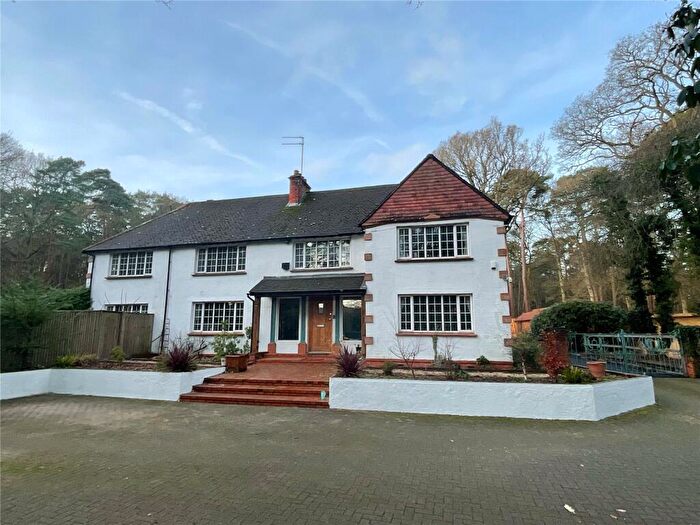
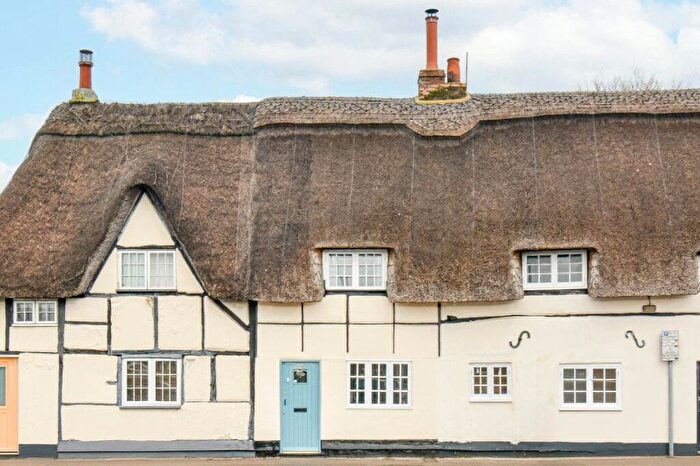
Properties in Bucklebury have an average house price of £598,768.00 and had 67 Property Transactions within the last 3 years¹.
Bucklebury is an area in Thatcham, West Berkshire with 818 households², where the most expensive property was sold for £1,925,000.00.
Properties for sale in Bucklebury
Roads and Postcodes in Bucklebury
Navigate through our locations to find the location of your next house in Bucklebury, Thatcham for sale or to rent.
| Streets | Postcodes |
|---|---|
| Beechfield | RG18 9XF |
| Beechfield Lane | RG18 9XD |
| Blake Road | RG18 9WN |
| Briants Piece | RG18 9SX |
| Brick Walk | RG18 9WU |
| Chapel Lane | RG18 9RL RG18 9RP |
| Charlotte Close | RG18 9TU |
| Clay Walk | RG18 9WW |
| Colthrop Lane | RG19 4NN |
| Colyer Close | RG18 9TX |
| Deacons Lane | RG18 9RH RG18 9RJ |
| Dines Way | RG18 9TF |
| Doctors Lane | RG18 9TA |
| Fletton Link | RG18 9WR |
| Follet Close | RG18 9WX |
| Frilsham | RG18 0XU RG18 0XX RG18 0XY |
| Hampstead Norreys Road | RG18 9RS RG18 9RT RG18 9RY RG18 9RZ RG18 9SA |
| Harts Hill Road | RG18 4AD |
| Hawkridge Hill | RG18 9XA |
| Hermitage Green | RG18 9SL |
| High Street | RG18 9RD RG18 9RE RG18 9SR RG18 9ST |
| Kiln Close | RG18 9TQ |
| Lipscomb Close | RG18 9SZ |
| Marlston | RG18 9UL |
| Marlston Houses | RG18 9UW |
| Marlston Road | RG18 9SU RG18 9SY |
| Newbury Road | RG18 9TB RG18 9TD |
| Orchard Close | RG18 9RU |
| Pinewood Crescent | RG18 9WL |
| Pond Lane | RG18 9RN |
| Ridgeway Close | RG18 9RA |
| Rowlock Gardens | RG18 9WT |
| Sandstone Grove | RG18 9WS |
| School Lane | RG18 9XB |
| Slanting Hill | RG18 9QG |
| Stretcher Drive | RG18 9WQ |
| Wellhouse | RG18 9UJ |
| Westrop Green | RG18 9NW |
| Woodside Drive | RG18 9QD |
| Wythe Close | RG18 9WP |
| Yattendon Road | RG18 9RG RG18 9RQ RG18 9RW |
| RG18 9TY RG18 9UH RG18 9UP RG18 9UU RG18 9UY RG18 9UZ RG18 9XE RG18 9XQ RG18 9XU RG18 9UN RG18 9UQ RG18 9UR RG18 9UT RG18 9UX |
Transport near Bucklebury
- FAQ
- Price Paid By Year
- Property Type Price
Frequently asked questions about Bucklebury
What is the average price for a property for sale in Bucklebury?
The average price for a property for sale in Bucklebury is £598,768. This amount is 42% higher than the average price in Thatcham. There are 2,048 property listings for sale in Bucklebury.
What streets have the most expensive properties for sale in Bucklebury?
The streets with the most expensive properties for sale in Bucklebury are Doctors Lane at an average of £1,380,000, Marlston Road at an average of £748,750 and Deacons Lane at an average of £725,600.
What streets have the most affordable properties for sale in Bucklebury?
The streets with the most affordable properties for sale in Bucklebury are Sandstone Grove at an average of £166,500, Fletton Link at an average of £274,833 and Rowlock Gardens at an average of £313,600.
Which train stations are available in or near Bucklebury?
Some of the train stations available in or near Bucklebury are Thatcham, Newbury Racecourse and Newbury.
Property Price Paid in Bucklebury by Year
The average sold property price by year was:
| Year | Average Sold Price | Price Change |
Sold Properties
|
|---|---|---|---|
| 2025 | £657,984 | 14% |
21 Properties |
| 2024 | £568,448 | -2% |
29 Properties |
| 2023 | £577,341 | 8% |
17 Properties |
| 2022 | £529,035 | 4% |
32 Properties |
| 2021 | £507,975 | -18% |
51 Properties |
| 2020 | £597,084 | 0,2% |
35 Properties |
| 2019 | £595,740 | 25% |
26 Properties |
| 2018 | £444,353 | -3% |
30 Properties |
| 2017 | £458,359 | 3% |
47 Properties |
| 2016 | £442,635 | 1% |
42 Properties |
| 2015 | £436,124 | 17% |
39 Properties |
| 2014 | £363,648 | -0,1% |
46 Properties |
| 2013 | £363,833 | -15% |
47 Properties |
| 2012 | £417,406 | 8% |
23 Properties |
| 2011 | £384,820 | -3% |
31 Properties |
| 2010 | £398,283 | 4% |
28 Properties |
| 2009 | £380,391 | 21% |
38 Properties |
| 2008 | £299,781 | -13% |
59 Properties |
| 2007 | £338,342 | 11% |
129 Properties |
| 2006 | £300,441 | -18% |
67 Properties |
| 2005 | £354,386 | 3% |
19 Properties |
| 2004 | £342,196 | 15% |
14 Properties |
| 2003 | £289,449 | -15% |
23 Properties |
| 2002 | £332,605 | 20% |
30 Properties |
| 2001 | £264,850 | 9% |
26 Properties |
| 2000 | £239,909 | 24% |
17 Properties |
| 1999 | £182,084 | -4% |
30 Properties |
| 1998 | £189,862 | 27% |
24 Properties |
| 1997 | £138,068 | -9% |
21 Properties |
| 1996 | £150,897 | 18% |
27 Properties |
| 1995 | £124,015 | - |
16 Properties |
Property Price per Property Type in Bucklebury
Here you can find historic sold price data in order to help with your property search.
The average Property Paid Price for specific property types in the last three years are:
| Property Type | Average Sold Price | Sold Properties |
|---|---|---|
| Semi Detached House | £522,597.00 | 12 Semi Detached Houses |
| Detached House | £737,725.00 | 39 Detached Houses |
| Terraced House | £348,923.00 | 13 Terraced Houses |
| Flat | £179,666.00 | 3 Flats |

