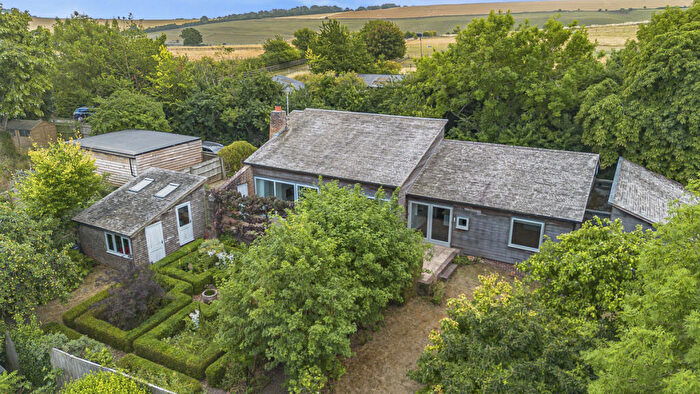
Houses for sale & to rent in Blewbury And Upton, Didcot
House Prices in Blewbury And Upton
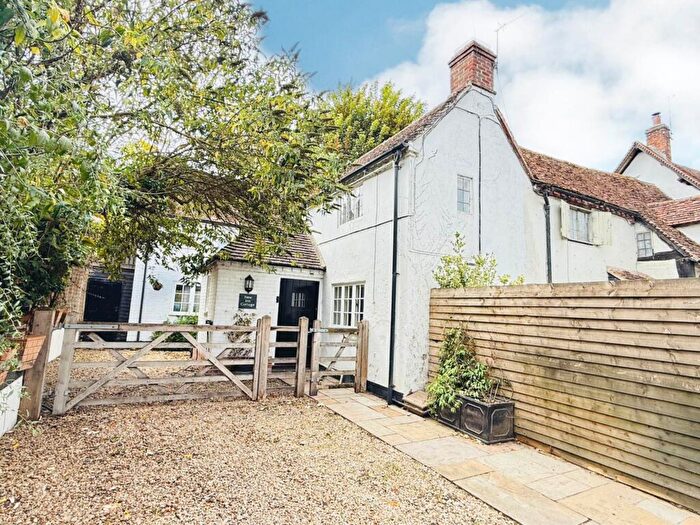
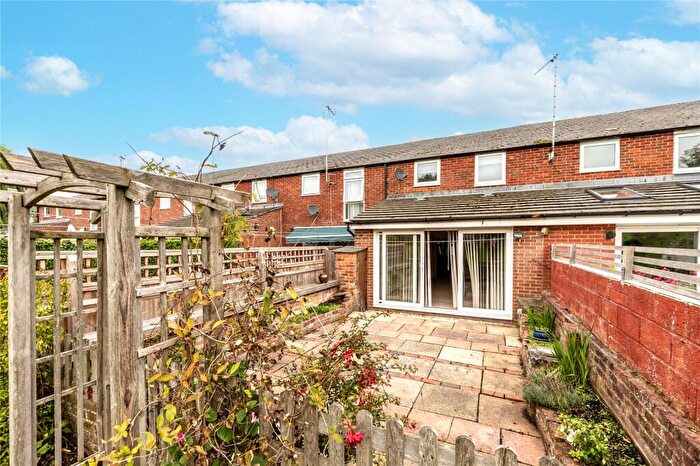
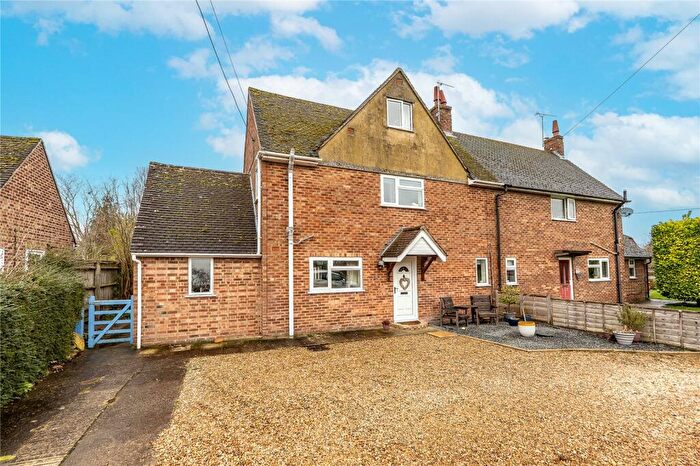
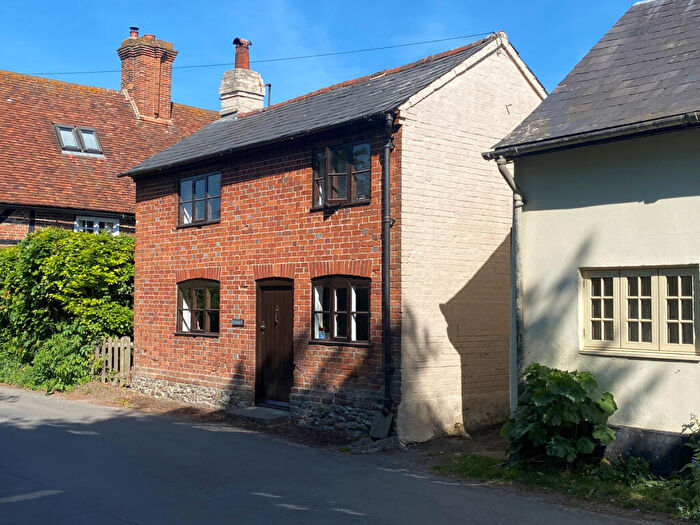
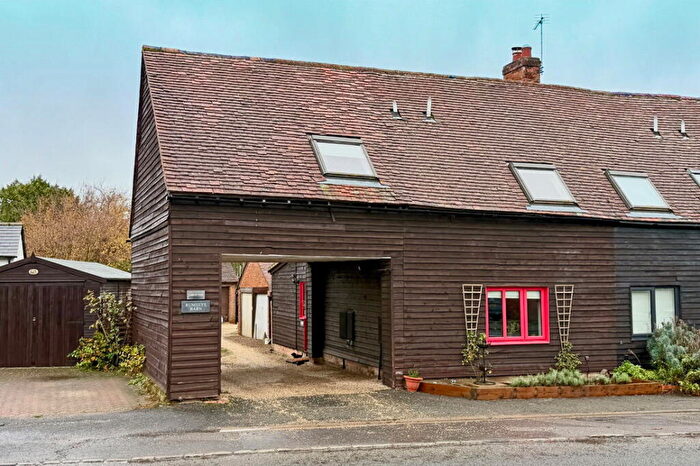
Properties in Blewbury And Upton have an average house price of £710,904.00 and had 74 Property Transactions within the last 3 years¹.
Blewbury And Upton is an area in Didcot, Oxfordshire with 749 households², where the most expensive property was sold for £7,500,000.00.
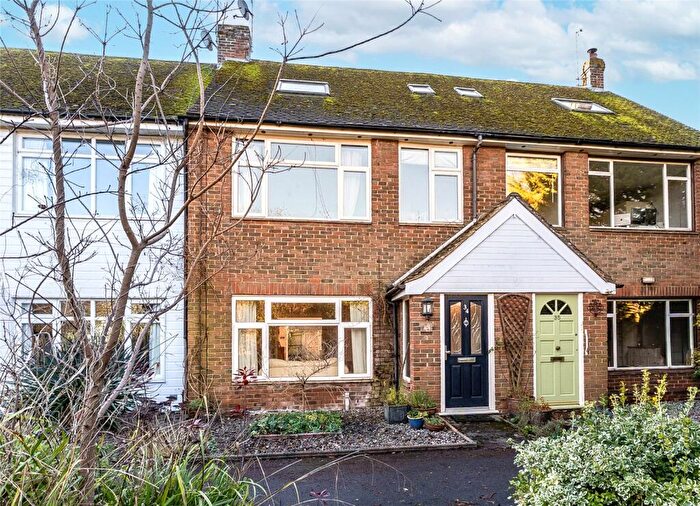
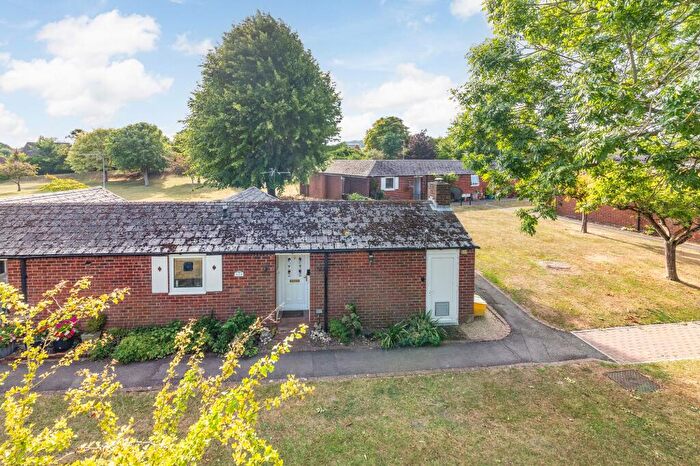
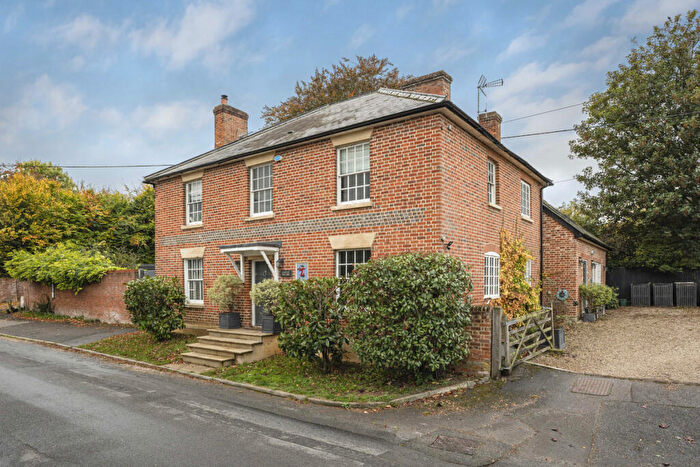
Properties for sale in Blewbury And Upton
Previously listed properties in Blewbury And Upton
Roads and Postcodes in Blewbury And Upton
Navigate through our locations to find the location of your next house in Blewbury And Upton, Didcot for sale or to rent.
| Streets | Postcodes |
|---|---|
| Alexander Close | OX11 9JP |
| Ashbrook Mews | OX11 9QA |
| Beeching Close | OX11 9JR |
| Berry Lane | OX11 9QJ |
| Bessels Lea | OX11 9NW |
| Bessels Way | OX11 9NH OX11 9NJ OX11 9NN OX11 9NP OX11 9NT |
| Bridus Mead | OX11 9PJ OX11 9PL |
| Chapel Lane | OX11 9PQ |
| Chilton Road | OX11 9JL |
| Church Corner | OX11 9HZ |
| Church End | OX11 9QH |
| Church Road | OX11 9PY |
| Church Street | OX11 9JB |
| Church Villas | OX11 9PZ |
| Dibleys | OX11 9PT OX11 9PU |
| Eastfields | OX11 9NR OX11 9NS |
| Fieldside | OX11 9HY |
| Grahame Close | OX11 9QE |
| High Street | OX11 9JE |
| London Road | OX11 9NU OX11 9NX OX11 9NY OX11 9PB OX11 9PD OX11 9PF |
| Millbrook Close | OX11 9QL |
| Newmans Close | OX11 9JA |
| Nottingham Fee | OX11 9PG |
| Pound Lane | OX11 9JH |
| Prospect Road | OX11 9HT |
| Reading Road | OX11 9HP |
| Sheencroft Cottages | OX11 9ED |
| South Street | OX11 9PR OX11 9PX |
| Station Road | OX11 9HX |
| Stream Road | OX11 9JD OX11 9JG |
| The Pilgrims Way | OX11 9NG |
| Treble House Terrace | OX11 9NZ |
| Watts Lane | OX11 9PS |
| Westbrook Green | OX11 9QD |
| Westbrook Street | OX11 9QB OX11 9QF OX11 9QG |
| Whites Orchard | OX11 9NQ |
Transport near Blewbury And Upton
- FAQ
- Price Paid By Year
- Property Type Price
Frequently asked questions about Blewbury And Upton
What is the average price for a property for sale in Blewbury And Upton?
The average price for a property for sale in Blewbury And Upton is £710,904. This amount is 84% higher than the average price in Didcot. There are 166 property listings for sale in Blewbury And Upton.
What streets have the most expensive properties for sale in Blewbury And Upton?
The streets with the most expensive properties for sale in Blewbury And Upton are Church Road at an average of £1,229,500, Westbrook Street at an average of £1,044,166 and South Street at an average of £951,999.
What streets have the most affordable properties for sale in Blewbury And Upton?
The streets with the most affordable properties for sale in Blewbury And Upton are Dibleys at an average of £215,150, Bridus Mead at an average of £345,050 and Grahame Close at an average of £451,875.
Which train stations are available in or near Blewbury And Upton?
Some of the train stations available in or near Blewbury And Upton are Didcot Parkway, Cholsey and Appleford.
Property Price Paid in Blewbury And Upton by Year
The average sold property price by year was:
| Year | Average Sold Price | Price Change |
Sold Properties
|
|---|---|---|---|
| 2025 | £548,089 | -23% |
28 Properties |
| 2024 | £673,226 | -42% |
24 Properties |
| 2023 | £959,227 | 24% |
22 Properties |
| 2022 | £733,483 | 20% |
28 Properties |
| 2021 | £585,219 | 17% |
44 Properties |
| 2020 | £488,102 | -25% |
18 Properties |
| 2019 | £612,147 | 7% |
17 Properties |
| 2018 | £571,378 | 18% |
21 Properties |
| 2017 | £470,183 | -13% |
30 Properties |
| 2016 | £529,613 | -1% |
22 Properties |
| 2015 | £536,064 | 26% |
39 Properties |
| 2014 | £394,963 | 1% |
29 Properties |
| 2013 | £392,542 | 13% |
34 Properties |
| 2012 | £340,783 | -5% |
30 Properties |
| 2011 | £356,940 | 7% |
27 Properties |
| 2010 | £332,232 | 14% |
32 Properties |
| 2009 | £285,685 | -31% |
27 Properties |
| 2008 | £373,444 | 2% |
19 Properties |
| 2007 | £365,024 | 3% |
31 Properties |
| 2006 | £352,333 | 18% |
50 Properties |
| 2005 | £290,142 | 13% |
27 Properties |
| 2004 | £253,696 | 9% |
41 Properties |
| 2003 | £230,851 | -23% |
27 Properties |
| 2002 | £282,845 | 20% |
40 Properties |
| 2001 | £225,973 | 10% |
36 Properties |
| 2000 | £202,956 | 16% |
40 Properties |
| 1999 | £169,769 | 26% |
43 Properties |
| 1998 | £125,713 | -11% |
37 Properties |
| 1997 | £139,356 | 19% |
21 Properties |
| 1996 | £113,409 | 22% |
50 Properties |
| 1995 | £87,900 | - |
25 Properties |
Property Price per Property Type in Blewbury And Upton
Here you can find historic sold price data in order to help with your property search.
The average Property Paid Price for specific property types in the last three years are:
| Property Type | Average Sold Price | Sold Properties |
|---|---|---|
| Semi Detached House | £472,986.00 | 23 Semi Detached Houses |
| Detached House | £1,094,203.00 | 33 Detached Houses |
| Terraced House | £331,375.00 | 16 Terraced Houses |
| Flat | £158,750.00 | 2 Flats |

