
Houses for sale in Tadley, West Berkshire
House Prices in Tadley
Properties in Tadley have an average house price of £309k and had 10 Property Transactions within the last 3 years.¹
Tadley is an area in West Berkshire with 88 households², where the most expensive property was sold for £425k.
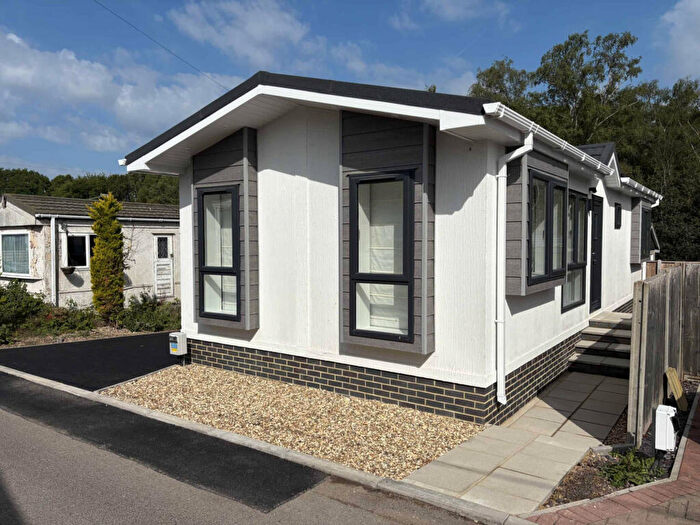
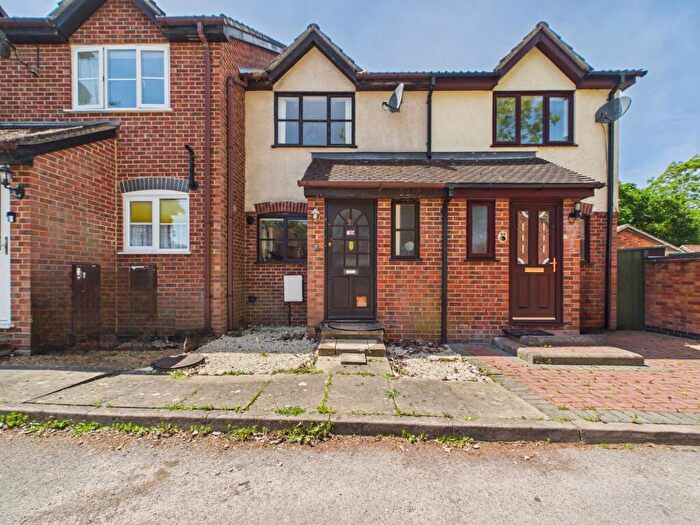
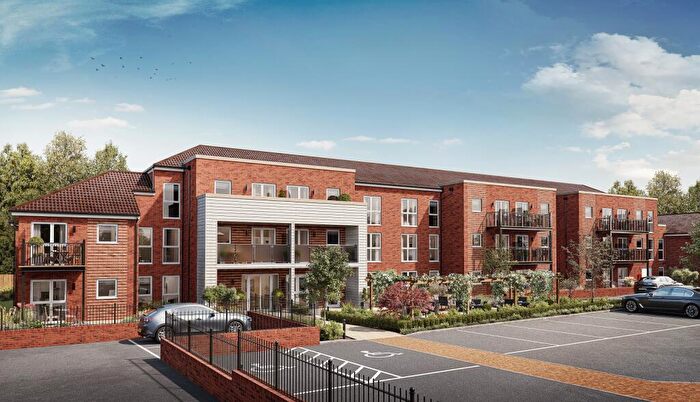
Properties for sale in Tadley
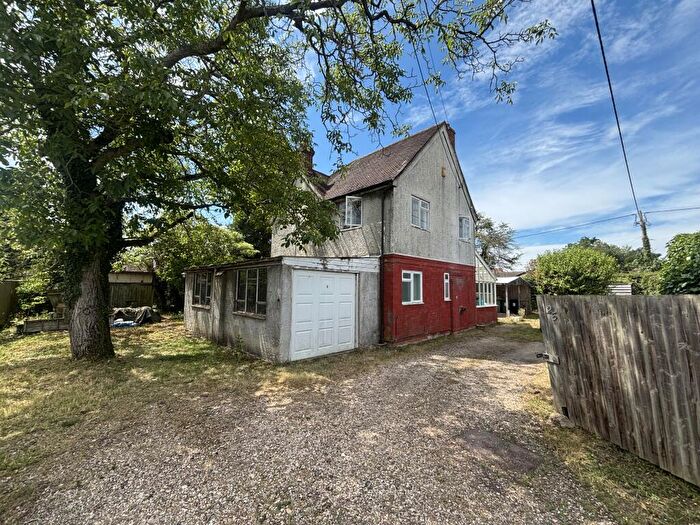
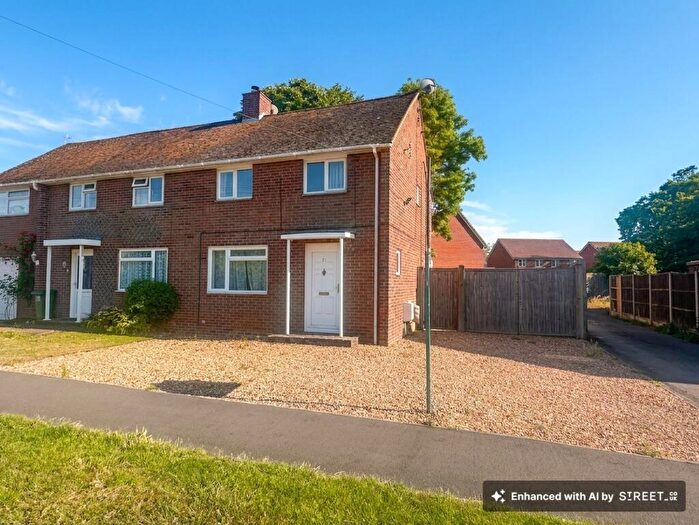
![]()
If you are looking to sell your house, let it out, or receive a property valuation, an expert can help you.
Click the button below to get started.
Previously listed properties in Tadley
Neighbourhoods in Tadley
Navigate through our locations to find the location of your next house in Tadley, West Berkshire for sale or to rent.
Property price trends in Tadley
According to the latest Land Registry data, the average home in Tadley sold for £268,125 in 2025. That figure comes from 158 sales logged over the past 30 years.
Prices have fallen back over the last three years. Compared with 2022, when the typical sale came in around £312,500, that's a fall of roughly 14.2%.
Looking back five years, average prices are up about 7% since 2020, a gain of around £17,459 in cash terms.
Zoom out to the past decade for the fuller picture. Back in 2015, homes here averaged £282,500, so the typical sold price has fallen about 5.1% since then, around 0.5% a year lower. Stretch the view to fifteen years and that annual pace edges up closer to 1.4%.
Frequently asked questions about Tadley
What is the average price for a property for sale in Tadley?
The average price for a property for sale in Tadley is £309,000. This amount is 32% lower than the average price in West Berkshire. There are 736 property listings for sale in Tadley.
Which train stations are available in or near Tadley?
Some of the train stations available in or near Tadley are Aldermaston, Midgham and Bramley (Hampshire).
Property Price Paid in Tadley by Year
The average sold property price by year was:
| Year | Average Sold Price | Price Change |
Sold Properties
|
|---|---|---|---|
| 2025 | £268,125 | -56% |
4 Properties |
| 2024 | £418,500 | 29% |
2 Properties |
| 2023 | £295,125 | -6% |
4 Properties |
| 2022 | £312,500 | -1% |
2 Properties |
| 2021 | £317,000 | 21% |
5 Properties |
| 2020 | £250,666 | 4% |
3 Properties |
| 2019 | £239,666 | -28% |
3 Properties |
| 2018 | £306,375 | -30% |
8 Properties |
| 2017 | £397,500 | 34% |
2 Properties |
| 2016 | £262,250 | -8% |
8 Properties |
Property Price per Property Type in Tadley
Here you can find historic sold price data in order to help with your property search.
The average Property Paid Price for specific property types in the last three years are:
| Property Type | Average Sold Price | Sold Properties |
|---|---|---|
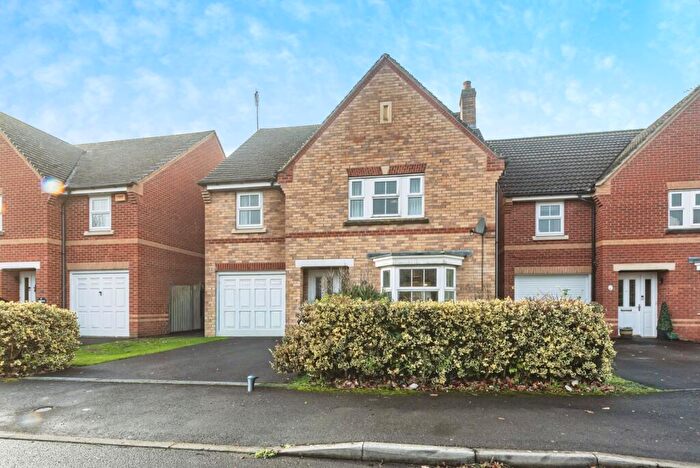
| Semi Detached House | £303,750.00 | 2 Semi Detached Houses |
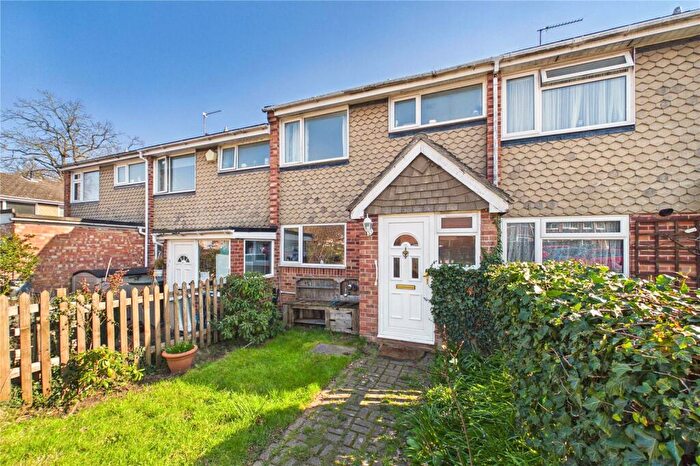
| Terraced House | £263,250.00 | 4 Terraced Houses |
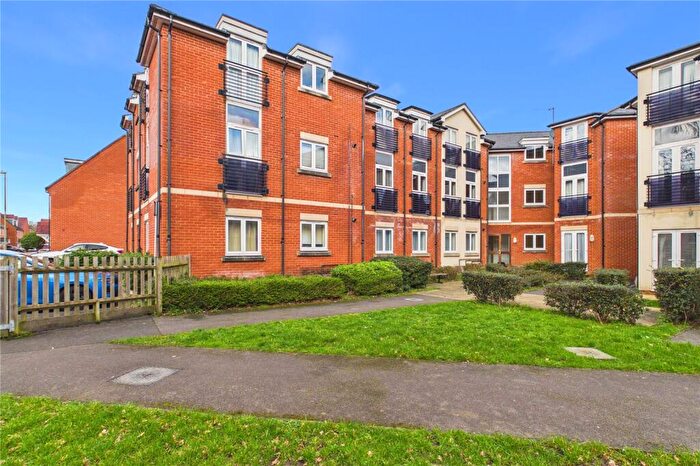
| Flat | £177,500.00 | 1 Flat |
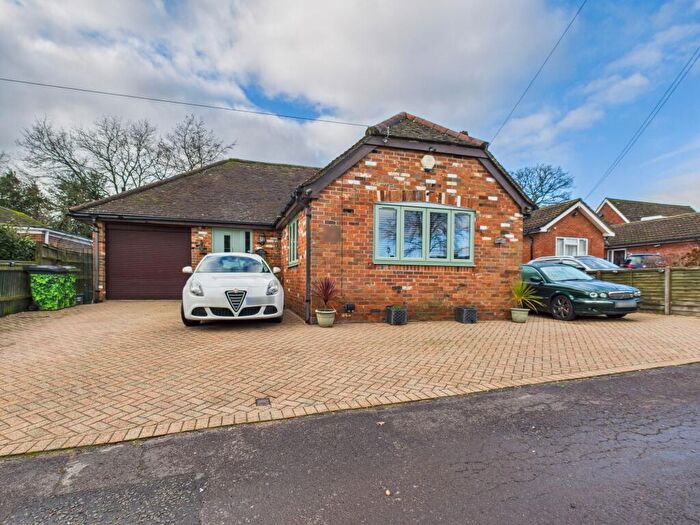
| Detached House | £417,333.00 | 3 Detached Houses |
Transport in Tadley
Please see below transportation links in this area:
