
Houses for sale in Newbury, Hampshire
House Prices in Newbury
Properties in Newbury have an average house price of £677k and had 346 Property Transactions within the last 3 years.¹
Newbury is an area in Hampshire with 4,363 households², where the most expensive property was sold for £4.33M.
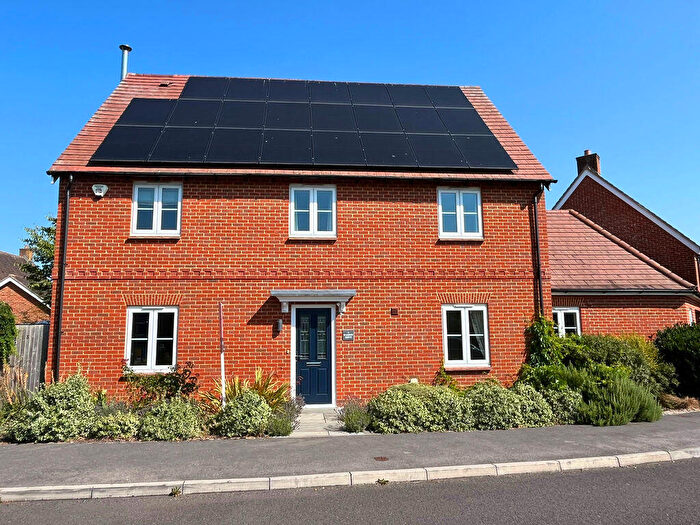
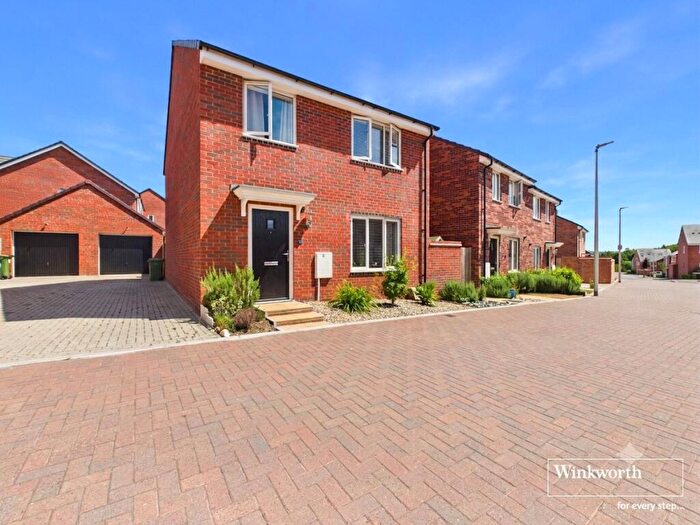
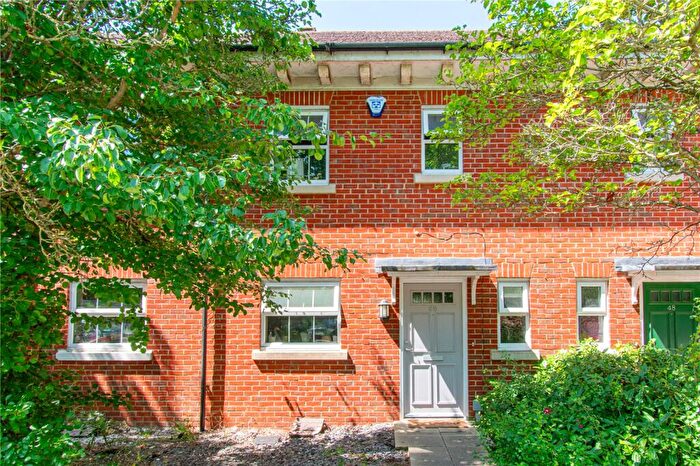
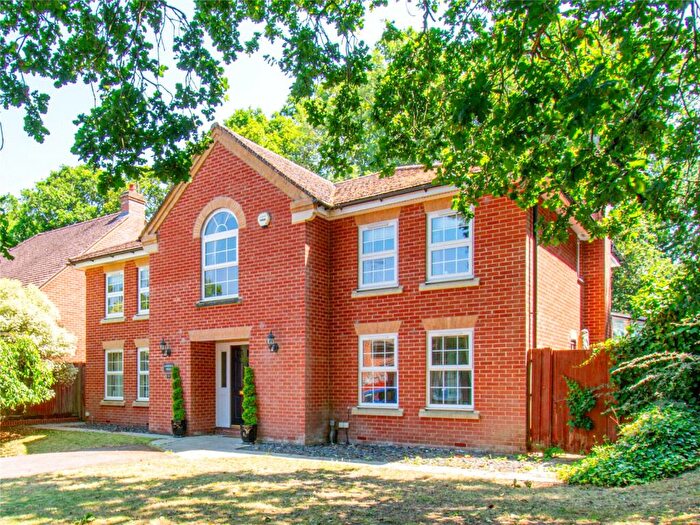
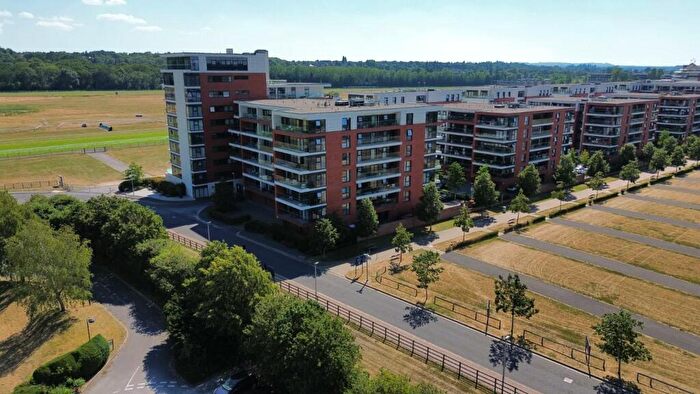
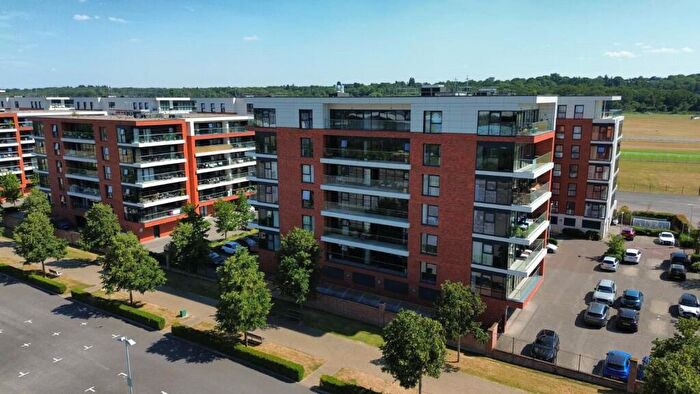
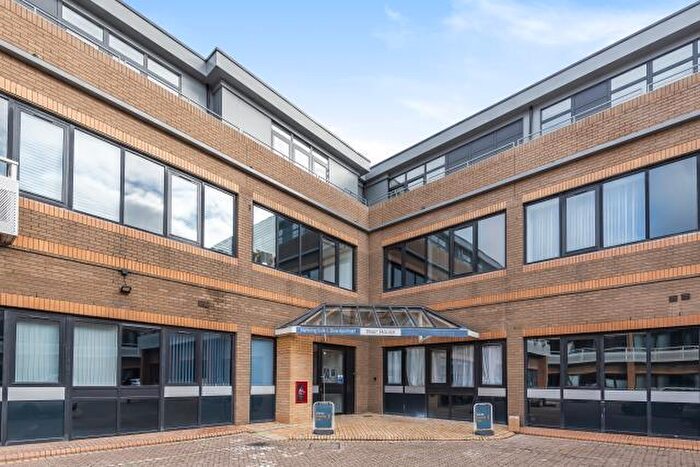
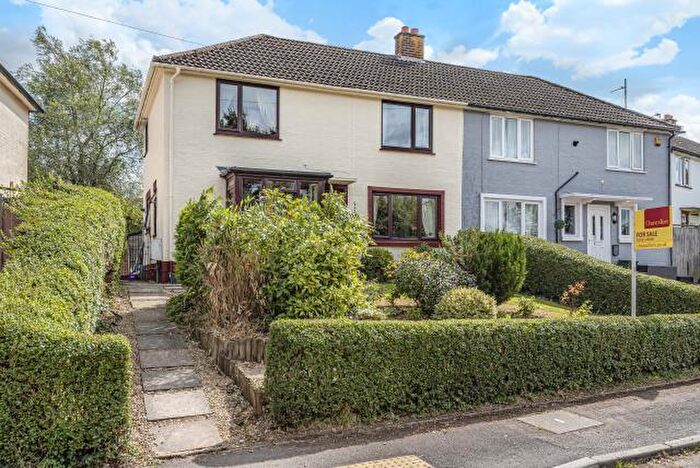
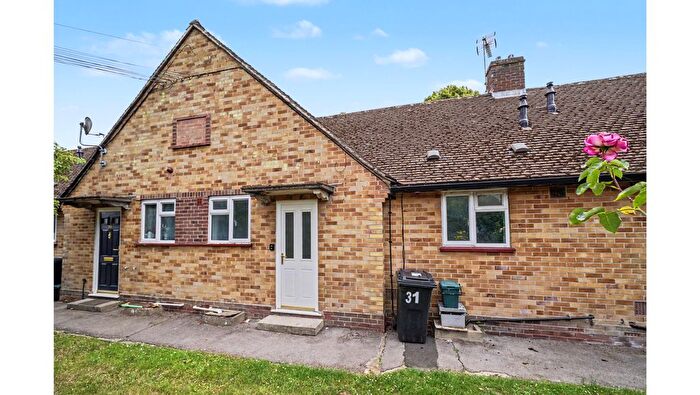
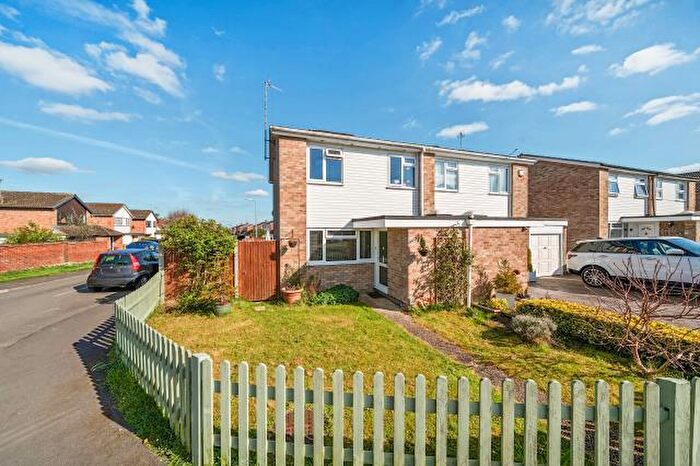
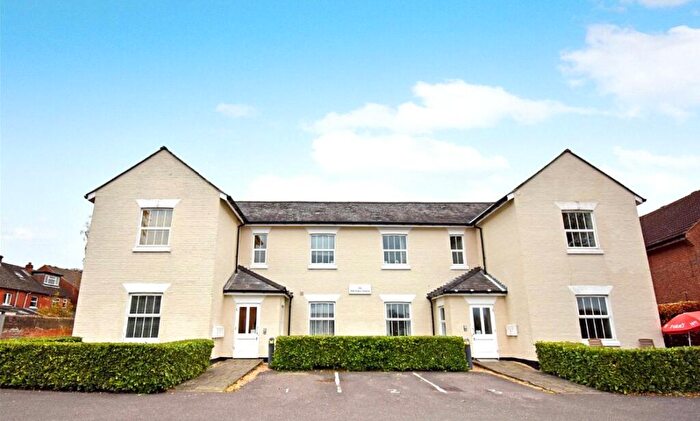
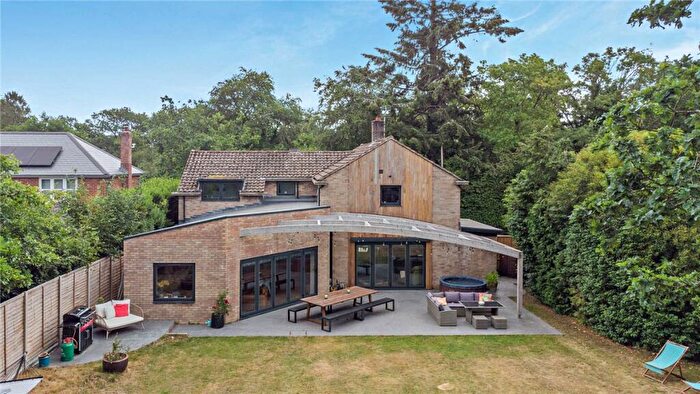
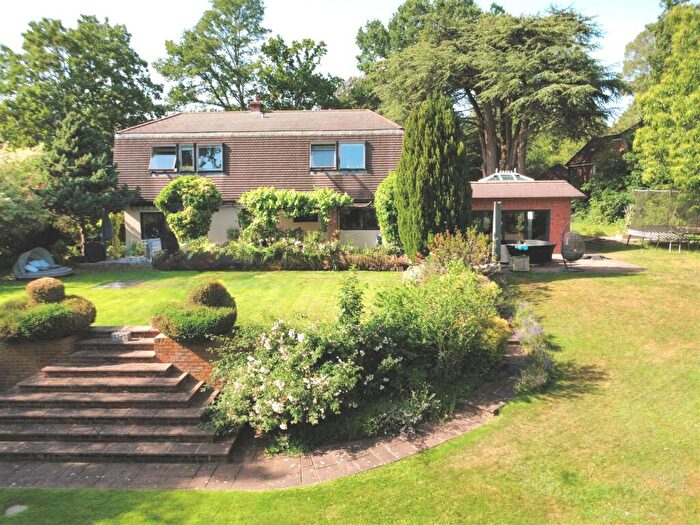
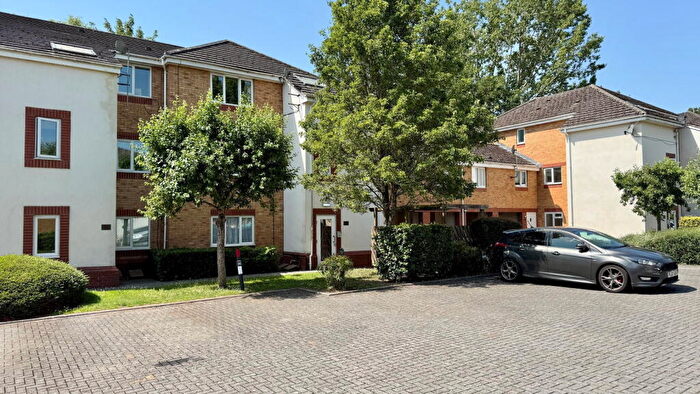
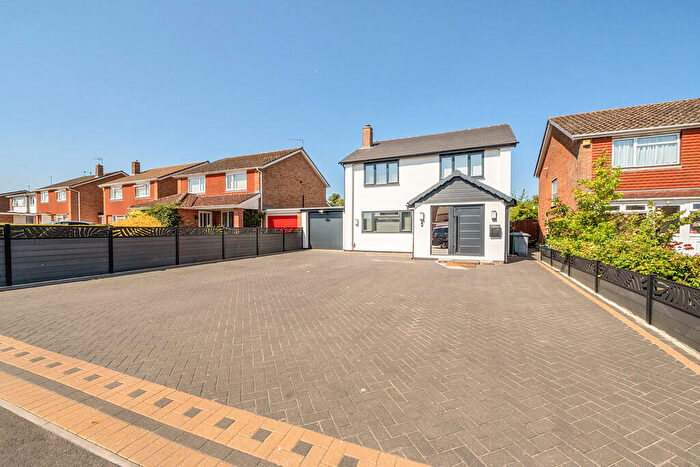
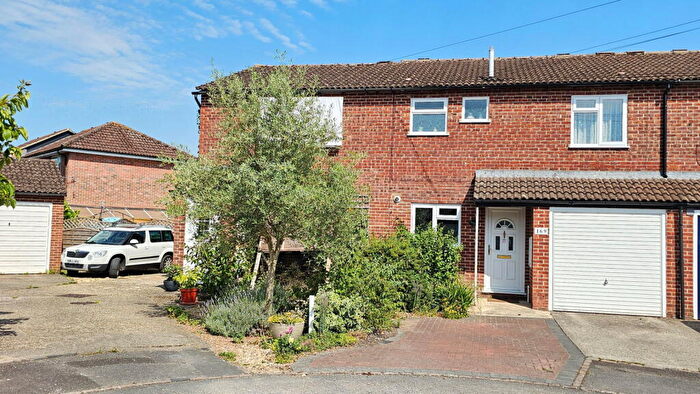
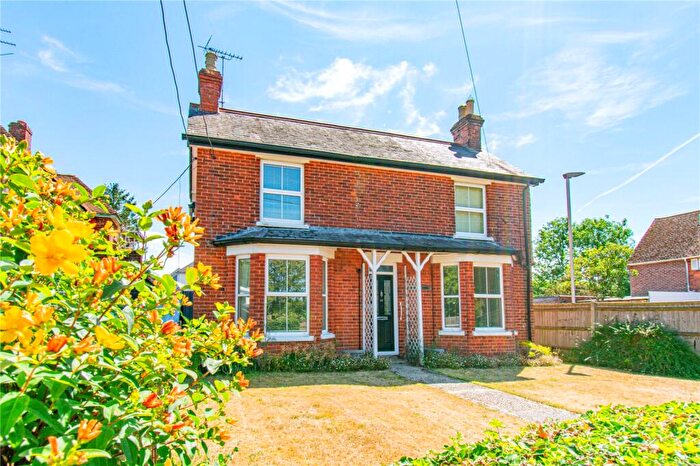
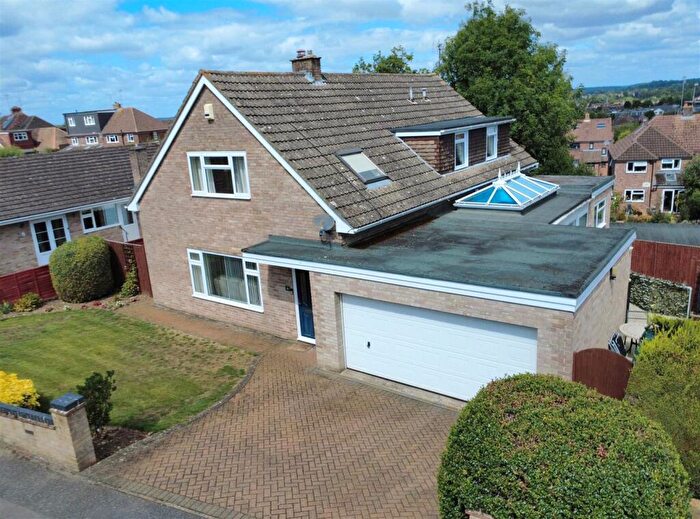
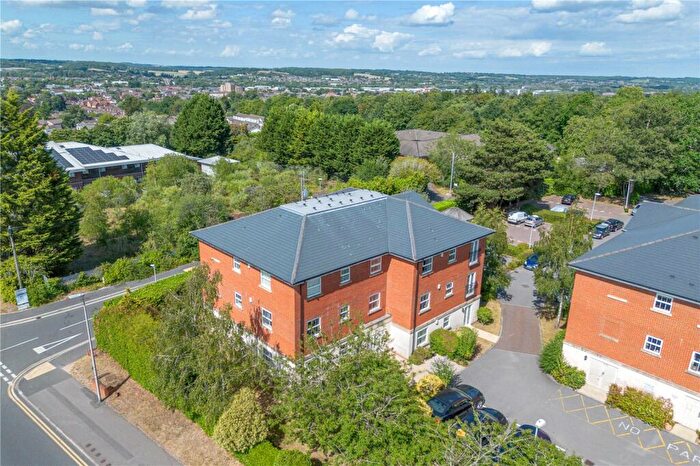
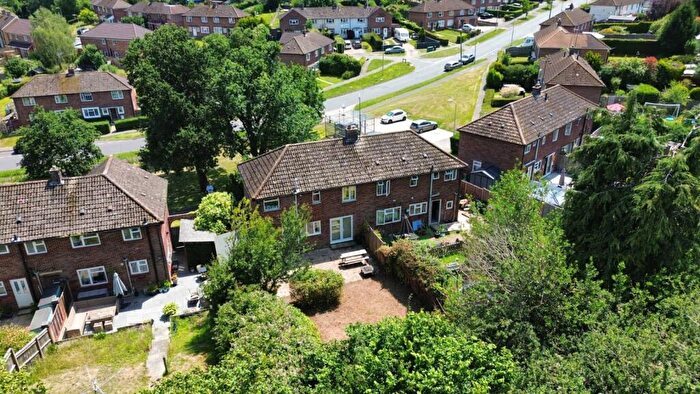
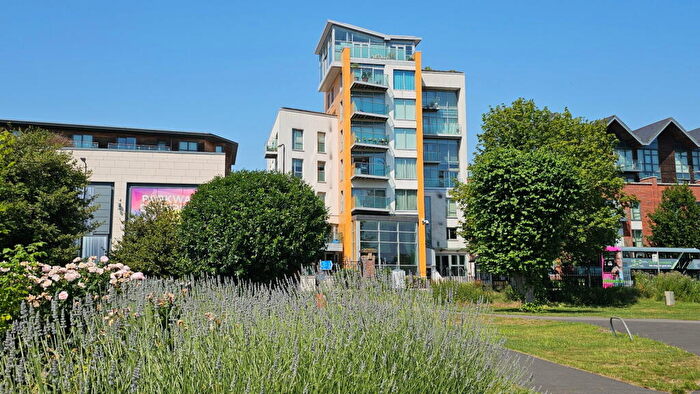
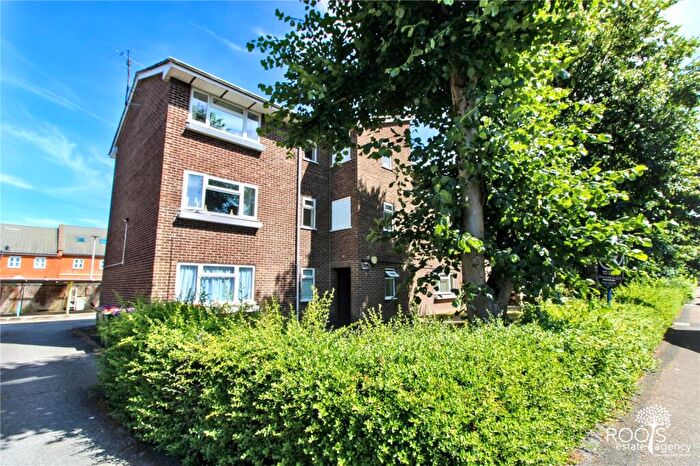
Properties for sale in Newbury
![]()
If you are looking to sell your house, let it out, or receive a property valuation, an expert can help you.
Click the button below to get started.


Neighbourhoods in Newbury
Navigate through our locations to find the location of your next house in Newbury, Hampshire for sale or to rent.
Property price trends in Newbury
According to the latest Land Registry data, the average home in Newbury sold for £670,000 in 2026. That figure comes from 4,706 sales logged over the past 31 years.
Prices have held fairly steady over the last three years. Compared with 2023, when the typical sale came in around £676,859, values are broadly unchanged.
Looking back five years, average prices are up about 13.2% since 2021, a gain of around £78,000 in cash terms.
Zoom out to the past decade for the fuller picture. Back in 2016, homes here averaged £487,591, so the typical sold price has climbed about 37.4% since then, roughly 3.2% a year. Stretch the view to fifteen years and that annual pace edges up closer to 3.9%.
Frequently asked questions about Newbury
What is the average price for a property for sale in Newbury?
The average price for a property for sale in Newbury is £676,828. This amount is 61% higher than the average price in Hampshire. There are 6,263 property listings for sale in Newbury.
What locations have the most expensive properties for sale in Newbury?
The locations with the most expensive properties for sale in Newbury are Tadley North, Kingsclere & Baughurst at an average of £1,262,500, Evingar at an average of £1,030,500 and Burghclere, Highclere And St Mary Bourne at an average of £829,505.
What locations have the most affordable properties for sale in Newbury?
The locations with the most affordable properties for sale in Newbury are Kingsclere at an average of £438,919 and East Woodhay at an average of £751,888.
Which train stations are available in or near Newbury?
Some of the train stations available in or near Newbury are Newbury, Newbury Racecourse and Thatcham.
Property Price Paid in Newbury by Year
The average sold property price by year was:
| Year | Average Sold Price | Price Change |
Sold Properties
|
|---|---|---|---|
| 2026 | £670,000 | -7% |
10 Properties |
| 2025 | £716,334 | 10% |
110 Properties |
| 2024 | £642,309 | -5% |
124 Properties |
| 2023 | £676,859 | - |
102 Properties |
| 2022 | £676,851 | 13% |
131 Properties |
| 2021 | £592,000 | 13% |
185 Properties |
| 2020 | £516,244 | -4% |
121 Properties |
| 2019 | £536,148 | -0,3% |
106 Properties |
| 2018 | £537,838 | -1% |
117 Properties |
| 2017 | £542,221 | 10% |
152 Properties |
Property Price per Property Type in Newbury
Here you can find historic sold price data in order to help with your property search.
The average Property Paid Price for specific property types in the last three years are:
| Property Type | Average Sold Price | Sold Properties |
|---|---|---|
| Semi Detached House | £476,974.00 | 70 Semi Detached Houses |
| Detached House | £919,142.00 | 187 Detached Houses |
| Terraced House | £356,458.00 | 74 Terraced Houses |
| Flat | £169,138.00 | 15 Flats |
Transport in Newbury
Please see below transportation links in this area:
