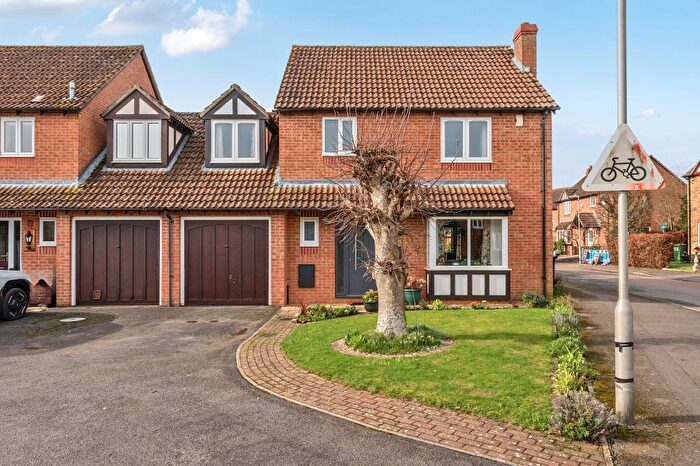
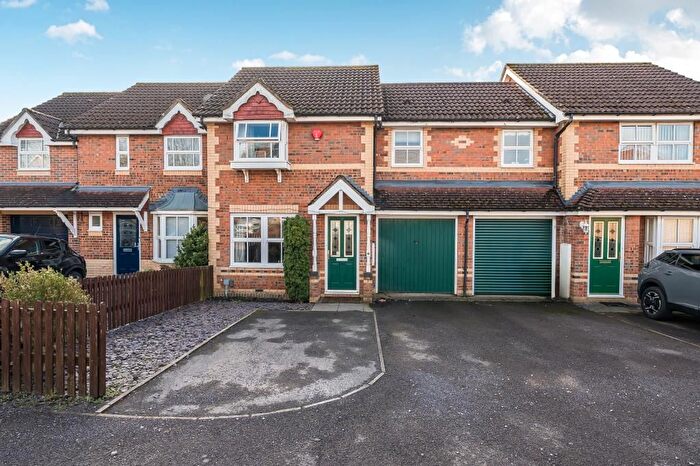
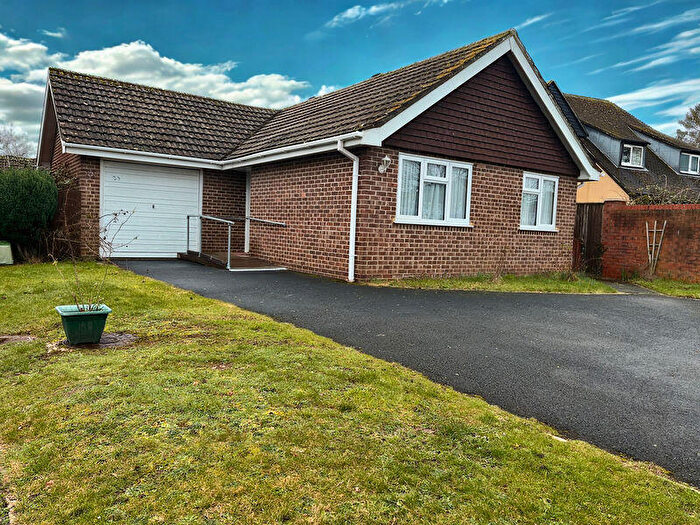
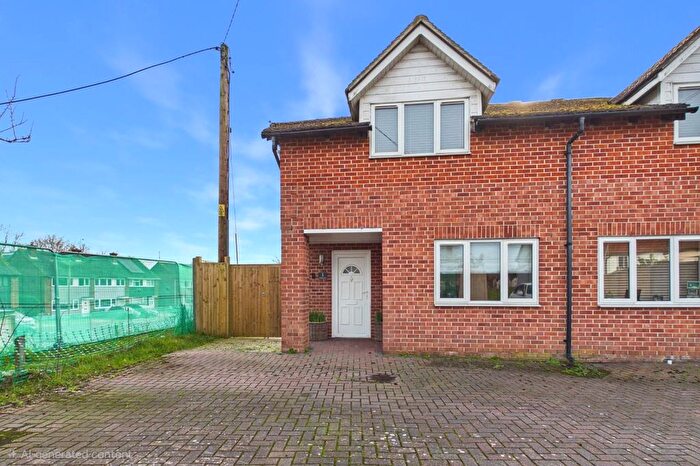
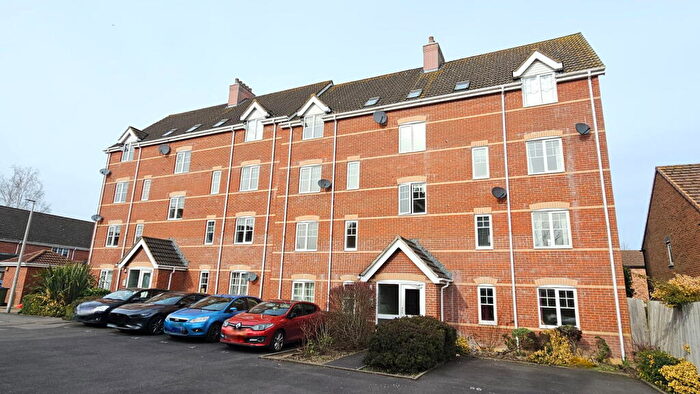
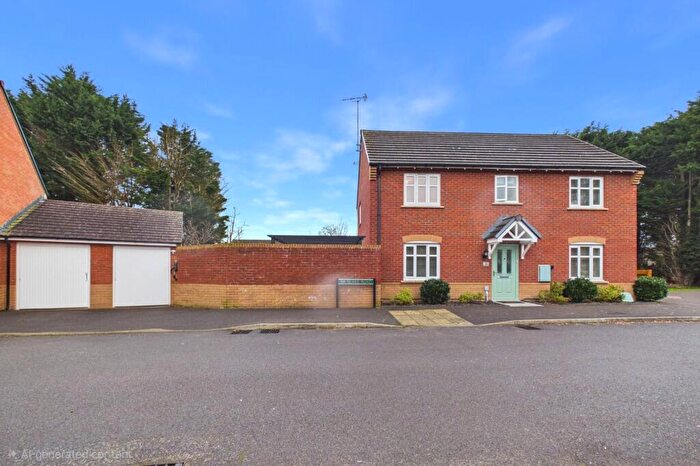
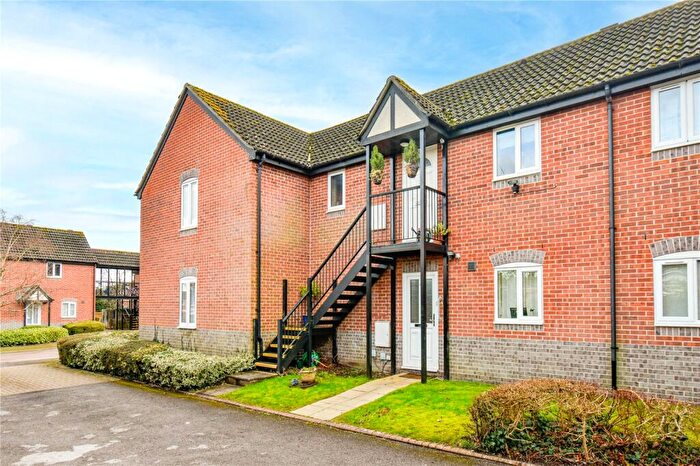
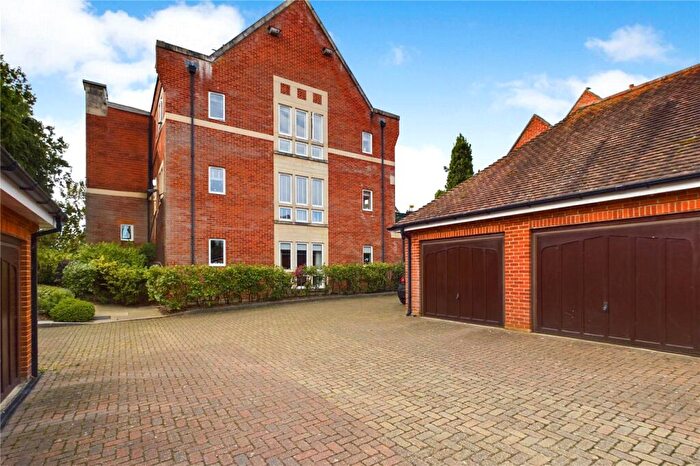
Houses for sale & to rent in Thatcham, West Berkshire
House Prices in Thatcham
Properties in Thatcham have an average house price of £421,577.00 and had 1,260 Property Transactions within the last 3 years.¹
Thatcham is an area in West Berkshire with 13,402 households², where the most expensive property was sold for £2,050,000.00.
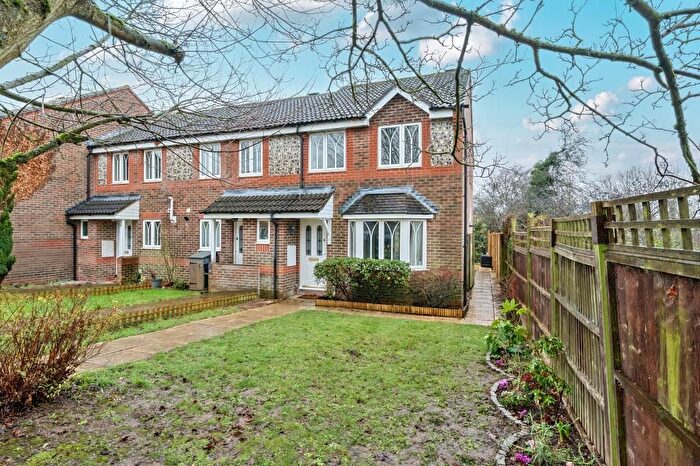
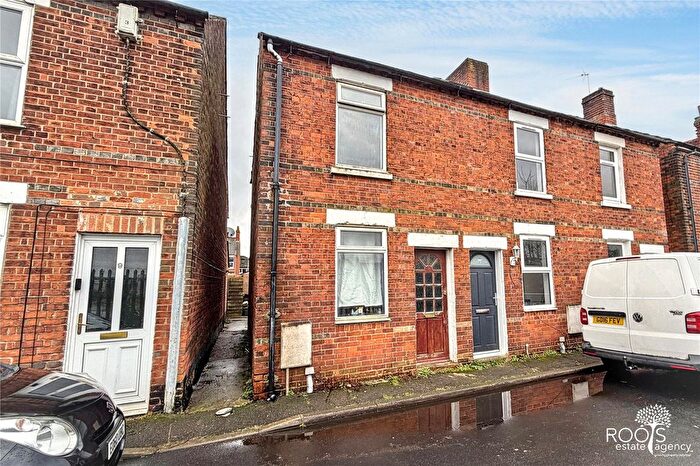
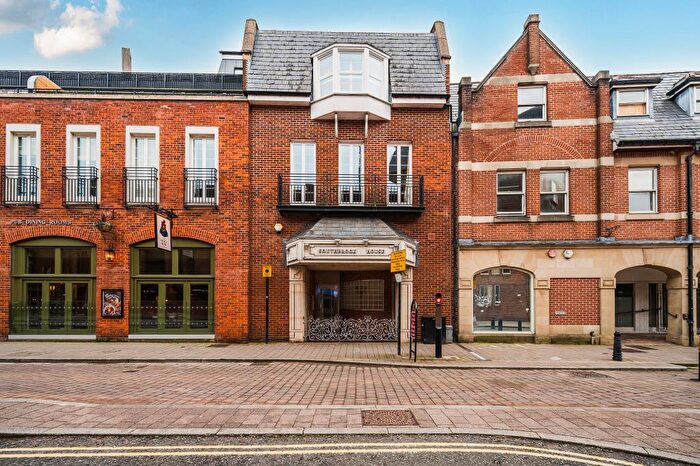
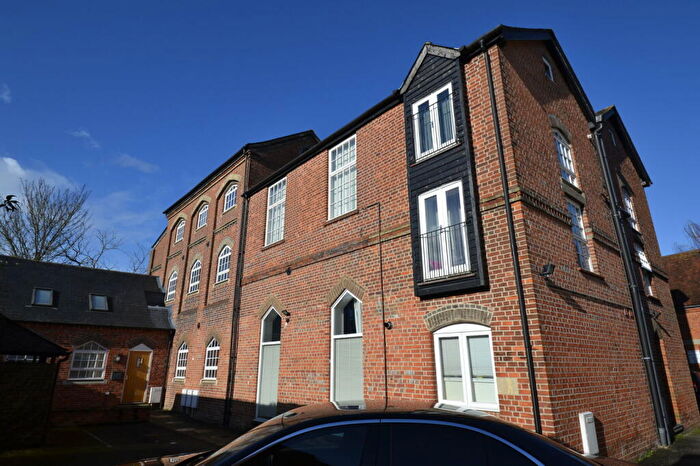
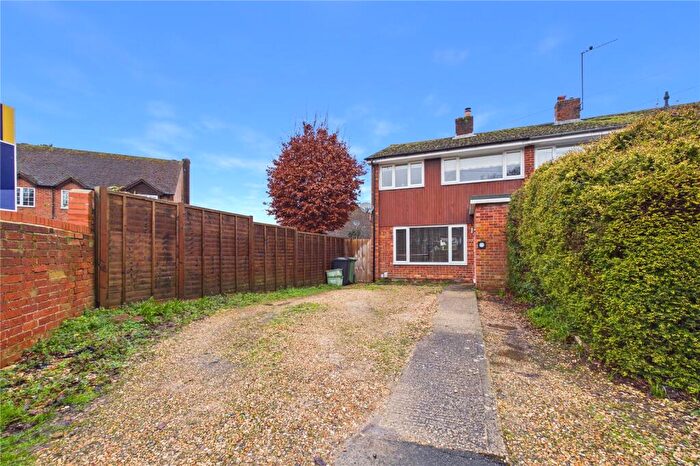
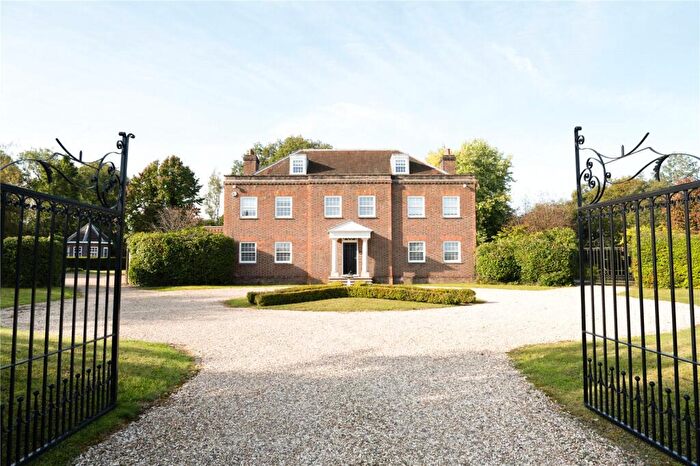
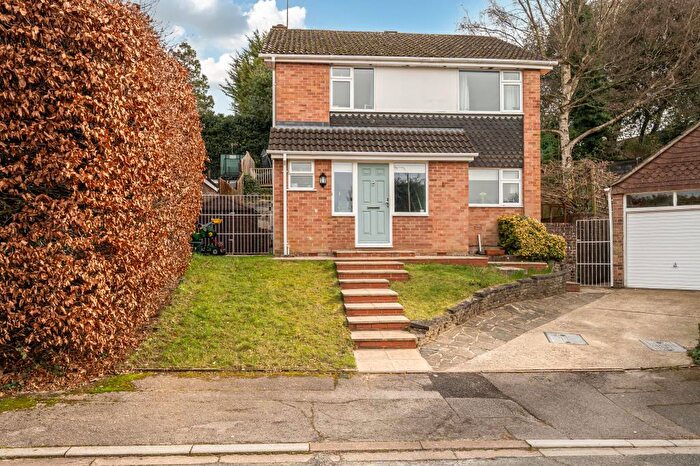
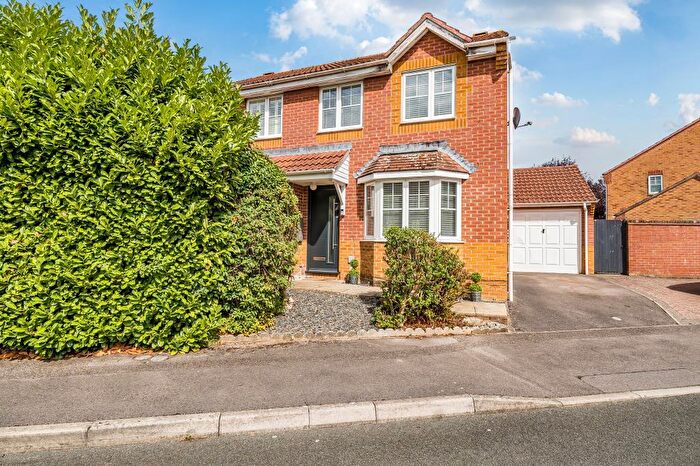
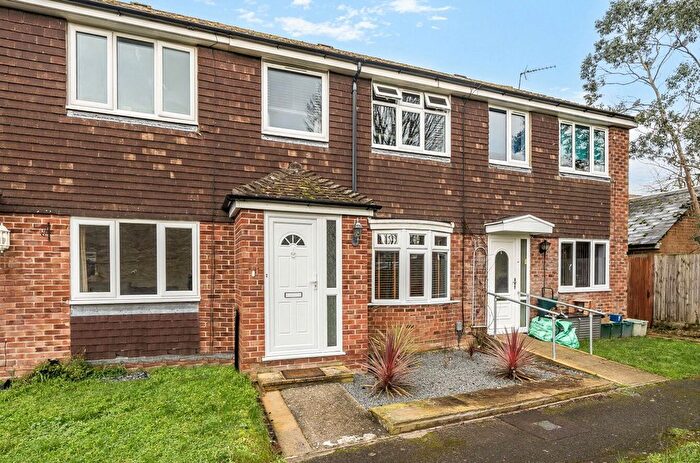
Properties for sale in Thatcham
Neighbourhoods in Thatcham
Navigate through our locations to find the location of your next house in Thatcham, West Berkshire for sale or to rent.
Transport in Thatcham
Please see below transportation links in this area:
- FAQ
- Price Paid By Year
- Property Type Price
Frequently asked questions about Thatcham
What is the average price for a property for sale in Thatcham?
The average price for a property for sale in Thatcham is £421,577. This amount is 8% lower than the average price in West Berkshire. There are 6,779 property listings for sale in Thatcham.
What locations have the most expensive properties for sale in Thatcham?
The locations with the most expensive properties for sale in Thatcham are Chieveley & Cold Ash at an average of £1,410,000, Cold Ash at an average of £735,269 and Chieveley at an average of £710,206.
What locations have the most affordable properties for sale in Thatcham?
The locations with the most affordable properties for sale in Thatcham are Thatcham Central at an average of £319,725, Thatcham West at an average of £358,568 and Thatcham South And Crookham at an average of £372,732.
Which train stations are available in or near Thatcham?
Some of the train stations available in or near Thatcham are Thatcham, Newbury Racecourse and Newbury.
Property Price Paid in Thatcham by Year
The average sold property price by year was:
| Year | Average Sold Price | Price Change |
Sold Properties
|
|---|---|---|---|
| 2025 | £429,242 | 4% |
404 Properties |
| 2024 | £411,174 | -4% |
460 Properties |
| 2023 | £425,841 | 1% |
396 Properties |
| 2022 | £420,971 | 7% |
508 Properties |
| 2021 | £393,584 | 4% |
666 Properties |
| 2020 | £375,924 | -2% |
446 Properties |
| 2019 | £381,798 | 4% |
492 Properties |
| 2018 | £366,620 | 3% |
508 Properties |
| 2017 | £355,794 | 4% |
574 Properties |
| 2016 | £343,240 | 10% |
519 Properties |
| 2015 | £309,181 | 9% |
595 Properties |
| 2014 | £281,813 | 1% |
696 Properties |
| 2013 | £279,253 | 1% |
565 Properties |
| 2012 | £275,302 | -4% |
475 Properties |
| 2011 | £286,572 | 0,1% |
486 Properties |
| 2010 | £286,169 | 12% |
408 Properties |
| 2009 | £251,673 | 4% |
444 Properties |
| 2008 | £242,149 | -10% |
519 Properties |
| 2007 | £267,409 | 8% |
962 Properties |
| 2006 | £244,899 | 4% |
1,013 Properties |
| 2005 | £234,377 | 9% |
781 Properties |
| 2004 | £214,369 | 4% |
890 Properties |
| 2003 | £205,170 | 5% |
749 Properties |
| 2002 | £194,077 | 9% |
823 Properties |
| 2001 | £175,804 | 15% |
877 Properties |
| 2000 | £148,618 | 12% |
766 Properties |
| 1999 | £131,174 | 16% |
878 Properties |
| 1998 | £109,689 | 11% |
805 Properties |
| 1997 | £97,885 | 12% |
760 Properties |
| 1996 | £85,759 | 5% |
676 Properties |
| 1995 | £81,269 | - |
534 Properties |
Property Price per Property Type in Thatcham
Here you can find historic sold price data in order to help with your property search.
The average Property Paid Price for specific property types in the last three years are:
| Property Type | Average Sold Price | Sold Properties |
|---|---|---|
| Semi Detached House | £368,521.00 | 437 Semi Detached Houses |
| Detached House | £628,941.00 | 395 Detached Houses |
| Terraced House | £326,140.00 | 300 Terraced Houses |
| Flat | £186,478.00 | 128 Flats |

