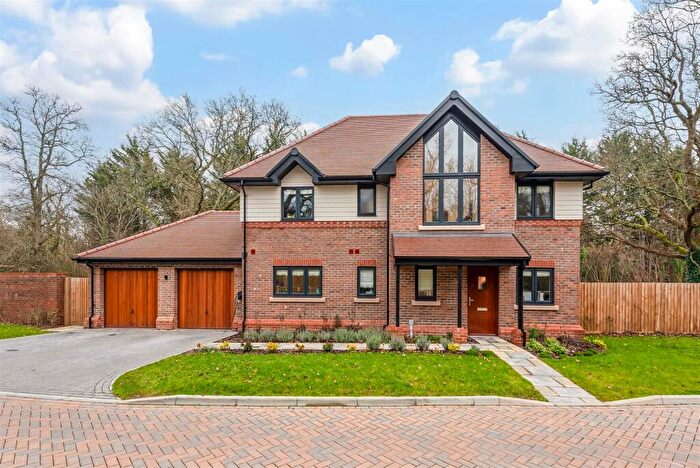
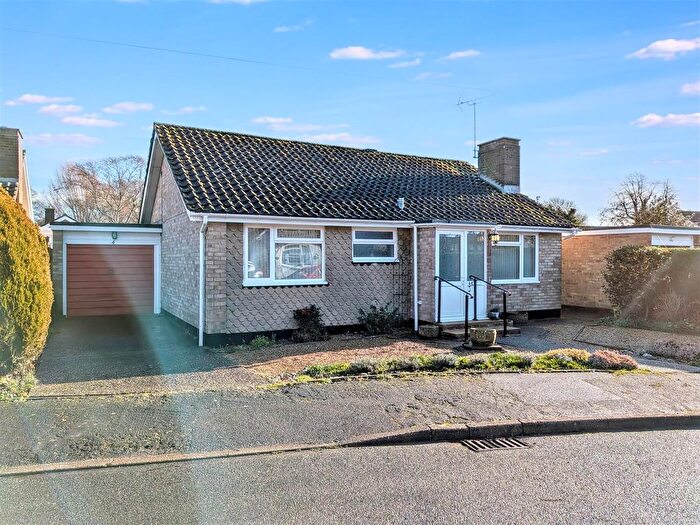
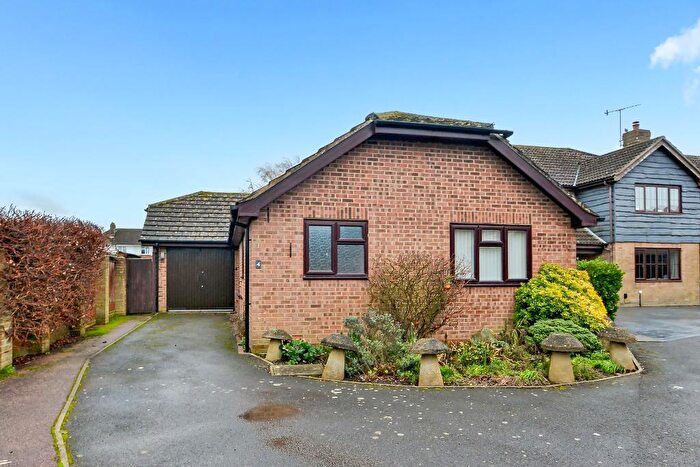
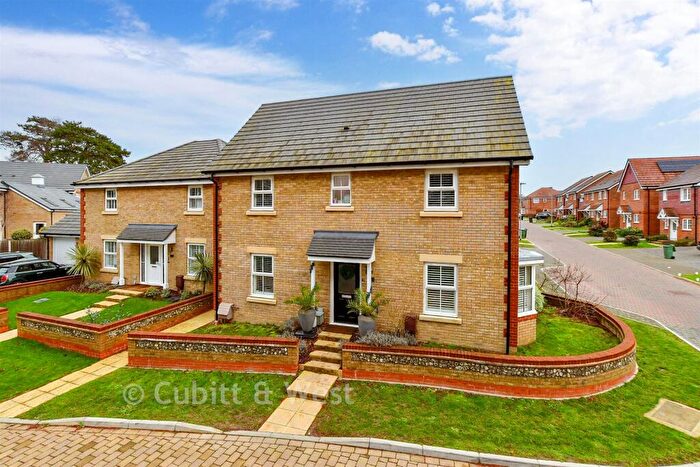
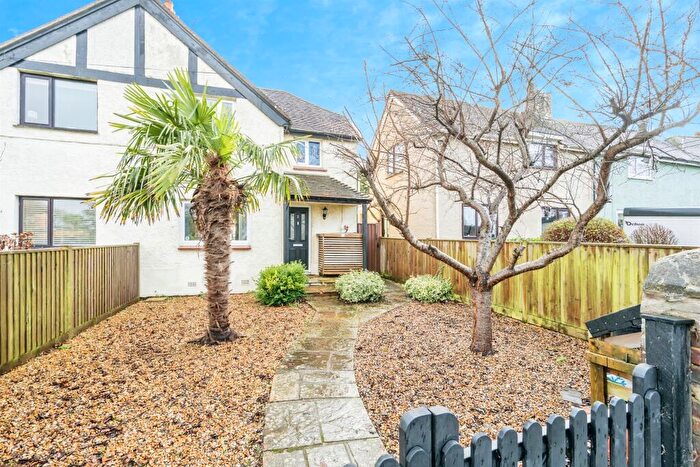
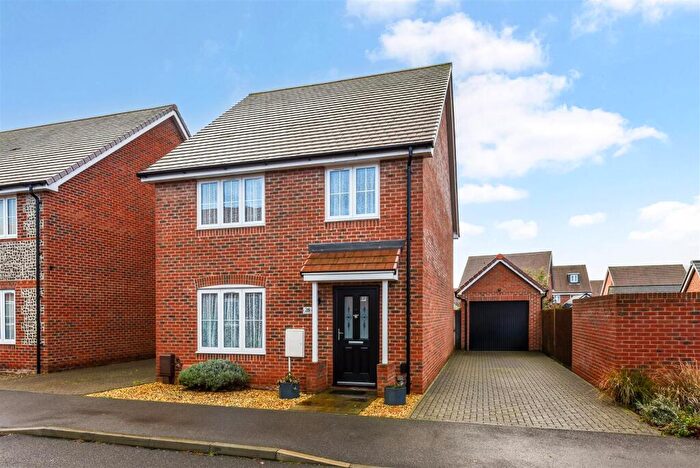
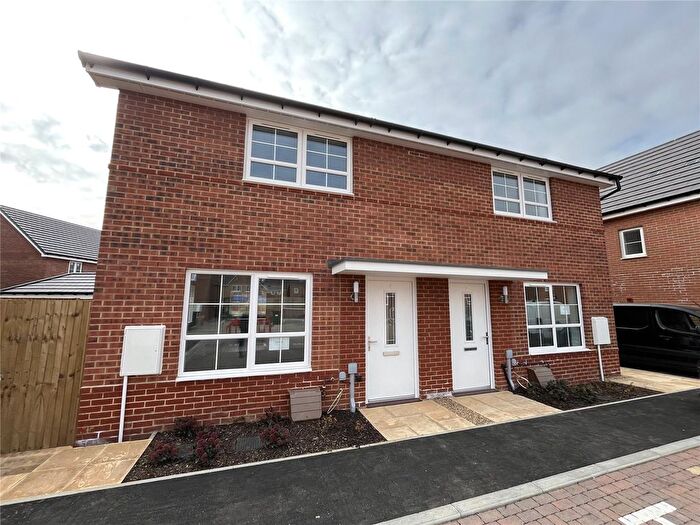
Houses for sale & to rent in Walberton, Arundel
House Prices in Walberton
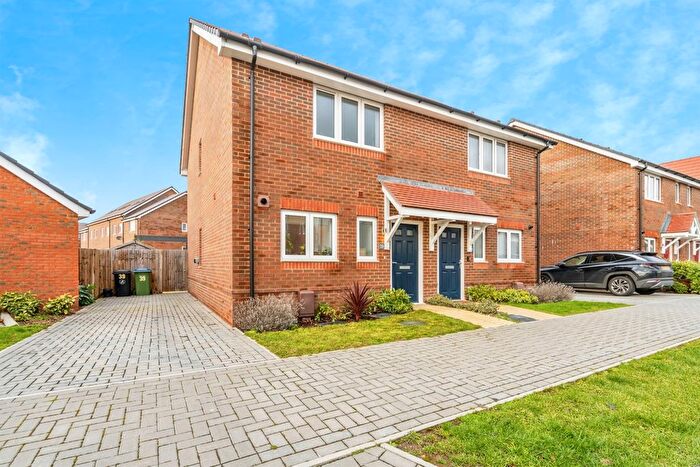
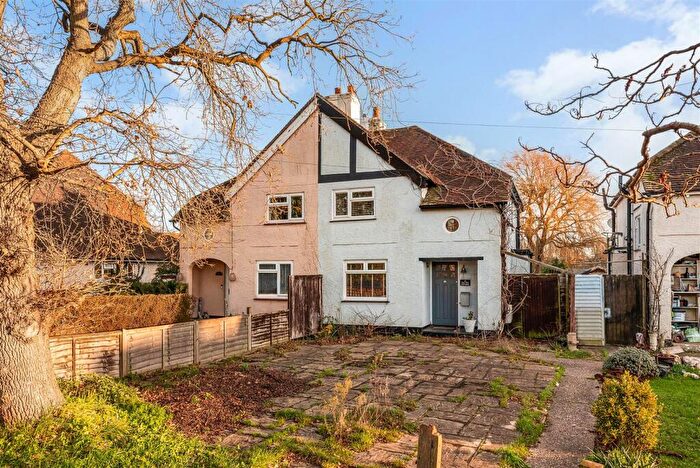
Properties in Walberton have an average house price of £578,246.00 and had 99 Property Transactions within the last 3 years¹.
Walberton is an area in Arundel, West Sussex with 1,057 households², where the most expensive property was sold for £1,670,200.00.
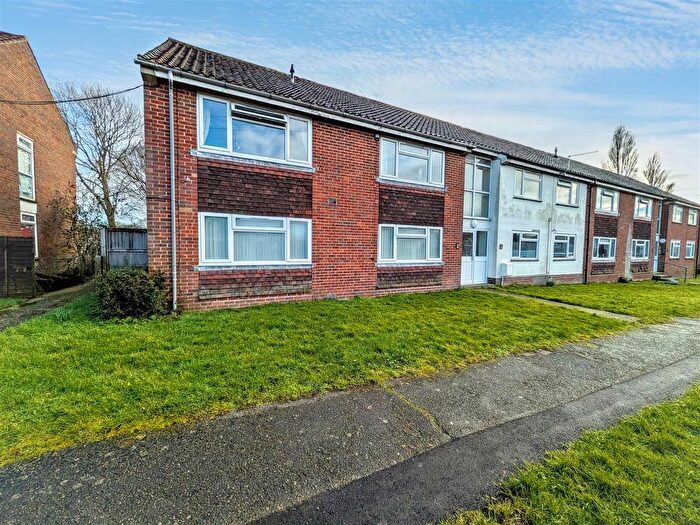
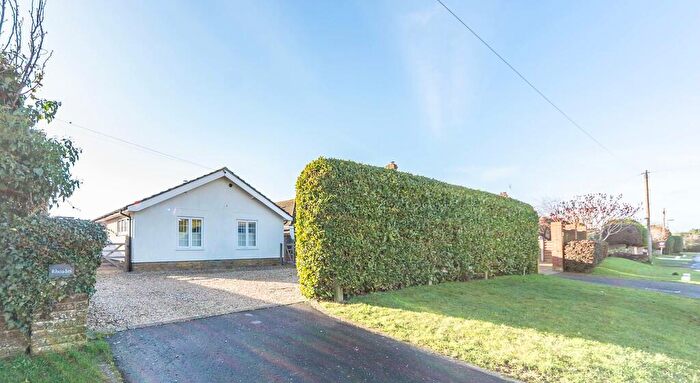
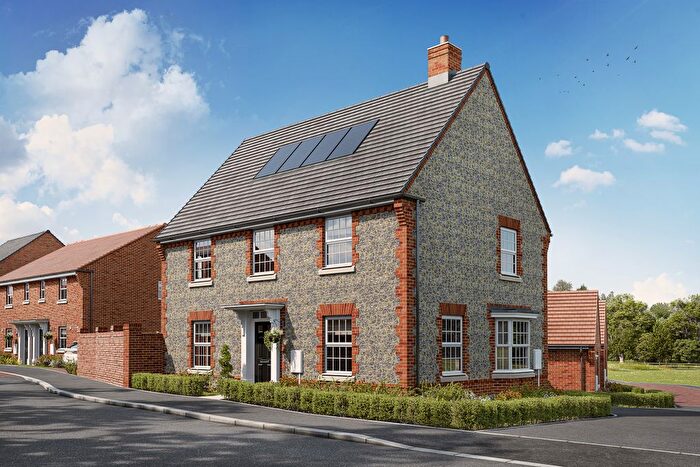
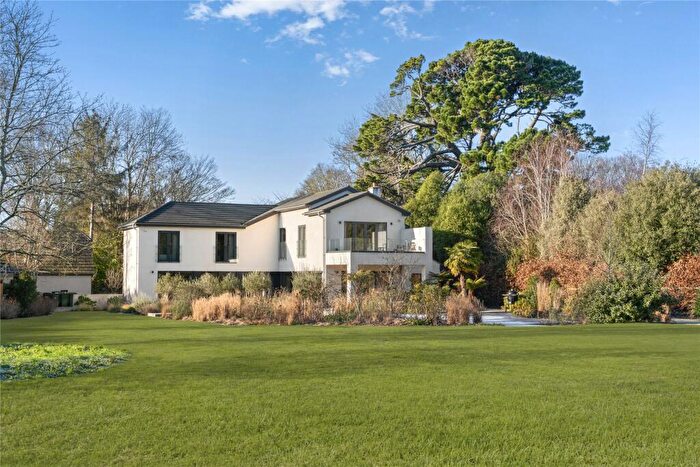
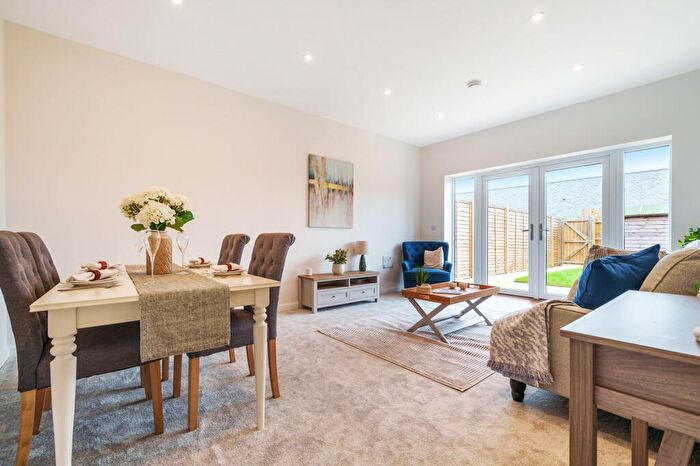
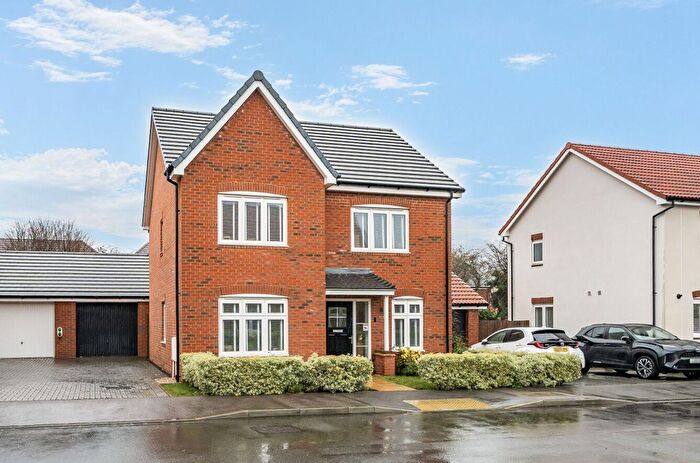
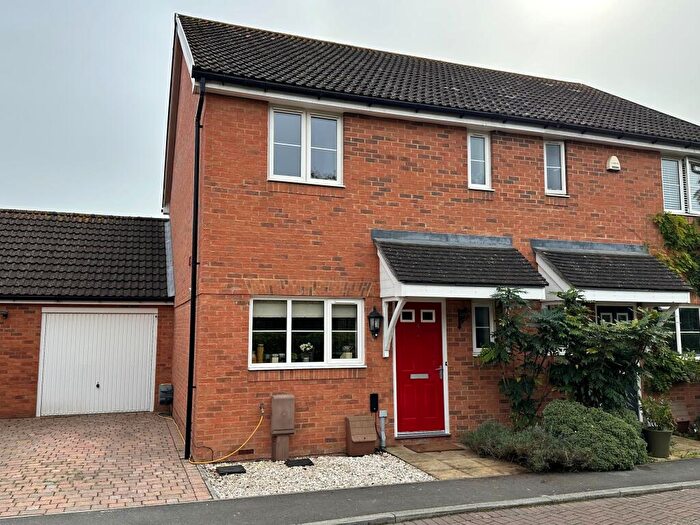
Properties for sale in Walberton
Roads and Postcodes in Walberton
Navigate through our locations to find the location of your next house in Walberton, Arundel for sale or to rent.
| Streets | Postcodes |
|---|---|
| Arundel Road | BN18 0QP BN18 0SA BN18 0SE BN18 0SF |
| Avisford Park Road | BN18 0AP |
| Barnham Lane | BN18 0AX BN18 0AY |
| Barrack Row | BN18 0QD |
| Baycombe Lane | BN18 0UY |
| Bridle Lane | BN18 0NA |
| Burch Grove | BN18 0BB |
| Chichester Road | BN18 0AJ |
| Church Hill | BN18 0RB BN18 0RD |
| Church Lane | BN18 0UD |
| Copse Lane | BN18 0QH |
| Dairy Lane | BN18 0PT |
| Deans Close | BN18 0SJ |
| Dyers Lane | BN18 0RE |
| Eastergate Lane | BN18 0BA |
| Field Close | BN18 0QL |
| Fontwell Close | BN18 0SW |
| Furlong Close | BN18 0UU |
| Hedgers Hill | BN18 0LR |
| Henty Close | BN18 0PW |
| Homefield Crescent | BN18 0PX |
| Hunters Mews | BN18 0UW |
| London Road | BN18 0NE BN18 0NG BN18 0SG |
| Longmead | BN18 0QG |
| Madehurst Road | BN18 0NJ BN18 0NU |
| Manser Road | BN18 0AW |
| Maple Road | BN18 0PN |
| Meadsway | BN18 0QU |
| Mill Lane | BN18 0QE |
| Mill Road | BN18 0LY BN18 0LZ |
| Nash Way | BN18 0QQ |
| North Pound | BN18 0PZ |
| Orchard Crescent | BN18 0SD |
| Orchard Villas | BN18 0PD |
| Orchard Way | BN18 0SH |
| Parsons Walk | BN18 0PA |
| Pound Road | BN18 0PU |
| Prime Close | BN18 0PL |
| Reynolds Lane | BN18 0QT BN18 0QX |
| School Hill | BN18 0RA BN18 0RS |
| School Terrace | BN18 0PF |
| Shellbridge Road | BN18 0LT BN18 0NB |
| Slindon Top Road | BN18 0RR |
| Sunnybox Lane | BN18 0LX |
| The Bungalows | BN18 0AZ |
| The Chase | BN18 0GR |
| The Meadows | BN18 0PB |
| The Ridings | BN18 0SB |
| The Street | BN18 0PE BN18 0PG BN18 0PH BN18 0PQ BN18 0PY BN18 0QA BN18 0QB |
| Top Road Slindon | BN18 0RP |
| Tye Lane | BN18 0LU BN18 0PS |
| Walberton Green | BN18 0AT |
| Walberton Park | BN18 0PJ |
| Wandleys Lane | BN18 0QR |
| West Walberton Lane | BN18 0QF BN18 0QS |
| Yapton Lane | BN18 0AN BN18 0AR BN18 0AS BN18 0LS |
| BN18 0LJ BN18 0LN BN18 0LP BN18 0LQ |
Transport near Walberton
- FAQ
- Price Paid By Year
- Property Type Price
Frequently asked questions about Walberton
What is the average price for a property for sale in Walberton?
The average price for a property for sale in Walberton is £578,246. This amount is 24% higher than the average price in Arundel. There are 3,226 property listings for sale in Walberton.
What streets have the most expensive properties for sale in Walberton?
The streets with the most expensive properties for sale in Walberton are Church Lane at an average of £1,373,000, Church Hill at an average of £1,122,380 and School Hill at an average of £916,650.
What streets have the most affordable properties for sale in Walberton?
The streets with the most affordable properties for sale in Walberton are Burch Grove at an average of £370,000, Arundel Road at an average of £373,750 and Pound Road at an average of £389,600.
Which train stations are available in or near Walberton?
Some of the train stations available in or near Walberton are Barnham, Ford and Arundel.
Property Price Paid in Walberton by Year
The average sold property price by year was:
| Year | Average Sold Price | Price Change |
Sold Properties
|
|---|---|---|---|
| 2025 | £546,404 | -14% |
21 Properties |
| 2024 | £622,985 | 11% |
37 Properties |
| 2023 | £554,181 | -19% |
41 Properties |
| 2022 | £657,148 | 12% |
42 Properties |
| 2021 | £579,282 | 7% |
59 Properties |
| 2020 | £536,175 | 14% |
37 Properties |
| 2019 | £462,656 | -2% |
36 Properties |
| 2018 | £472,160 | -20% |
41 Properties |
| 2017 | £568,319 | 14% |
49 Properties |
| 2016 | £489,039 | 15% |
37 Properties |
| 2015 | £415,751 | 4% |
41 Properties |
| 2014 | £399,257 | 4% |
49 Properties |
| 2013 | £385,221 | -7% |
45 Properties |
| 2012 | £413,069 | 16% |
41 Properties |
| 2011 | £345,685 | -10% |
39 Properties |
| 2010 | £380,258 | 21% |
38 Properties |
| 2009 | £299,886 | -25% |
23 Properties |
| 2008 | £376,305 | -5% |
26 Properties |
| 2007 | £393,545 | 4% |
56 Properties |
| 2006 | £377,334 | 11% |
73 Properties |
| 2005 | £336,777 | 5% |
48 Properties |
| 2004 | £319,989 | 8% |
62 Properties |
| 2003 | £293,322 | 19% |
62 Properties |
| 2002 | £238,638 | 7% |
71 Properties |
| 2001 | £222,579 | 1% |
79 Properties |
| 2000 | £220,975 | 25% |
54 Properties |
| 1999 | £166,278 | 2% |
50 Properties |
| 1998 | £163,616 | 15% |
59 Properties |
| 1997 | £139,383 | 5% |
49 Properties |
| 1996 | £132,510 | 22% |
46 Properties |
| 1995 | £102,957 | - |
41 Properties |
Property Price per Property Type in Walberton
Here you can find historic sold price data in order to help with your property search.
The average Property Paid Price for specific property types in the last three years are:
| Property Type | Average Sold Price | Sold Properties |
|---|---|---|
| Semi Detached House | £433,900.00 | 25 Semi Detached Houses |
| Detached House | £687,244.00 | 61 Detached Houses |
| Terraced House | £361,666.00 | 12 Terraced Houses |
| Flat | £137,000.00 | 1 Flat |

