
Houses for sale & to rent in Barnham, Bognor Regis
House Prices in Barnham
Properties in Barnham have an average house price of £421k and had 177 Property Transactions within the last 3 years¹.
Barnham is an area in Bognor Regis, West Sussex with 1,576 households², where the most expensive property was sold for £3.5M.
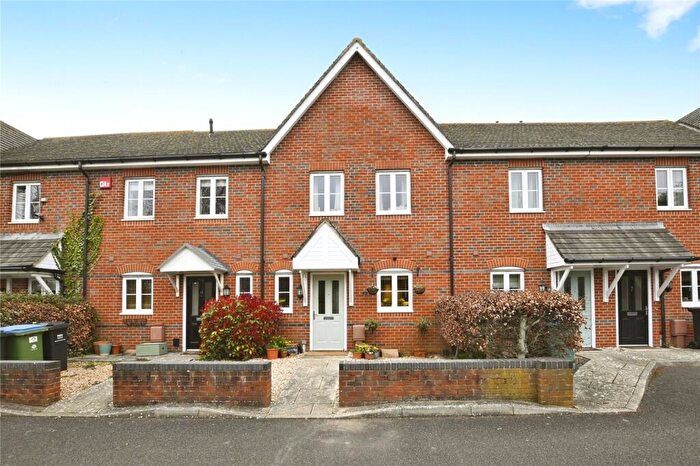
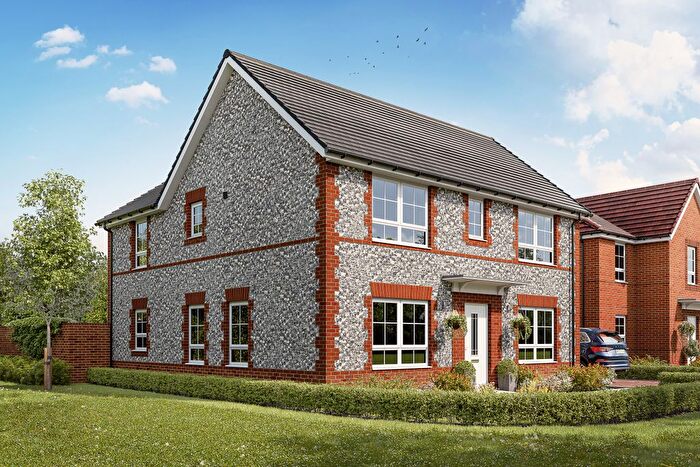
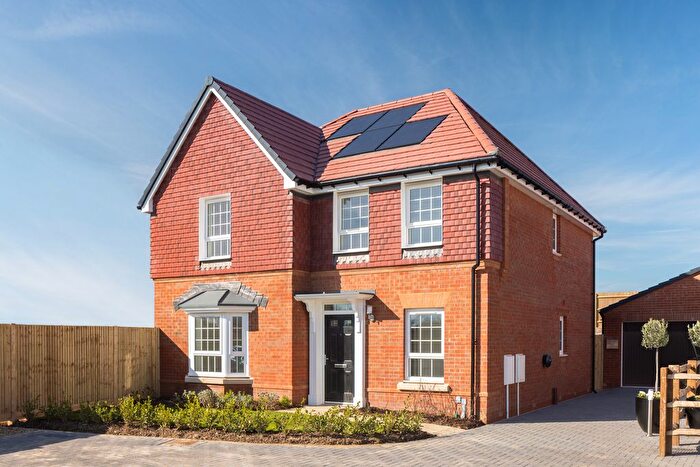
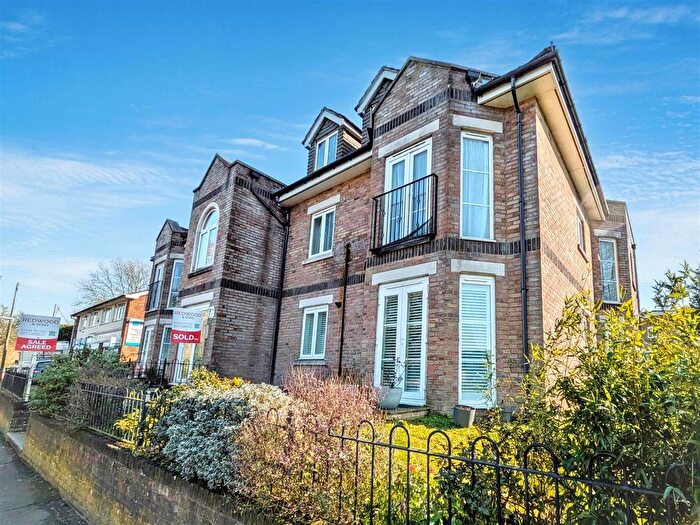
Properties for sale in Barnham
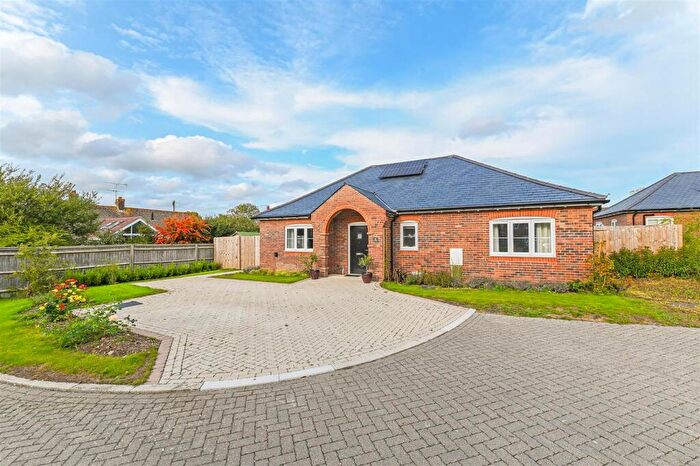
![]()
If you are looking to sell your house, let it out, or receive a property valuation, an expert can help you.
Click the button below to get started.


Roads and Postcodes in Barnham
Navigate through our locations to find the location of your next house in Barnham, Bognor Regis for sale or to rent.
Transport near Barnham

- FAQ
- Price Paid By Year
- Property Type Price
Frequently asked questions about Barnham
What is the average price for a property for sale in Barnham?
The average price for a property for sale in Barnham is £421,056. This amount is 22% higher than the average price in Bognor Regis. There are 2,066 property listings for sale in Barnham.
What streets have the most expensive properties for sale in Barnham?
The streets with the most expensive properties for sale in Barnham are Church Lane at an average of £2,168,500, Highground Lane at an average of £1,112,500 and Skylark Way at an average of £605,000.
What streets have the most affordable properties for sale in Barnham?
The streets with the most affordable properties for sale in Barnham are Warren Way at an average of £205,437, Foxes Croft at an average of £207,500 and Dial Close at an average of £248,500.
Which train stations are available in or near Barnham?
Some of the train stations available in or near Barnham are Barnham, Ford and Bognor Regis.
Property Price Paid in Barnham by Year
The average sold property price by year was:
| Year | Average Sold Price | Price Change |
Sold Properties
|
|---|---|---|---|
| 2026 | £296,000 | -57% |
3 Properties |
| 2025 | £464,333 | 11% |
66 Properties |
| 2024 | £415,072 | 9% |
56 Properties |
| 2023 | £379,787 | -4% |
52 Properties |
| 2022 | £395,815 | 1% |
99 Properties |
| 2021 | £390,686 | 11% |
80 Properties |
| 2020 | £348,076 | -9% |
84 Properties |
| 2019 | £378,912 | 8% |
110 Properties |
| 2018 | £348,371 | 6% |
92 Properties |
| 2017 | £326,411 | 4% |
116 Properties |
| 2016 | £313,079 | 10% |
112 Properties |
| 2015 | £281,573 | 1% |
111 Properties |
| 2014 | £280,131 | 14% |
99 Properties |
| 2013 | £240,111 | -3% |
74 Properties |
| 2012 | £246,183 | -7% |
36 Properties |
| 2011 | £262,537 | 7% |
55 Properties |
| 2010 | £242,875 | -1% |
53 Properties |
| 2009 | £245,468 | -0,3% |
48 Properties |
| 2008 | £246,240 | 5% |
53 Properties |
| 2007 | £234,327 | 8% |
103 Properties |
| 2006 | £215,261 | -0,1% |
109 Properties |
| 2005 | £215,473 | 5% |
77 Properties |
| 2004 | £204,658 | 20% |
77 Properties |
| 2003 | £164,652 | 3% |
96 Properties |
| 2002 | £160,524 | 7% |
112 Properties |
| 2001 | £148,635 | 15% |
86 Properties |
| 2000 | £126,862 | 28% |
72 Properties |
| 1999 | £91,663 | 14% |
79 Properties |
| 1998 | £78,555 | -2% |
69 Properties |
| 1997 | £80,232 | 9% |
105 Properties |
| 1996 | £73,285 | -15% |
79 Properties |
| 1995 | £84,084 | - |
73 Properties |
Property Price per Property Type in Barnham
Here you can find historic sold price data in order to help with your property search.
The average Property Paid Price for specific property types in the last three years are:
| Property Type | Average Sold Price | Sold Properties |
|---|---|---|
| Semi Detached House | £387,312.00 | 35 Semi Detached Houses |
| Detached House | £598,358.00 | 74 Detached Houses |
| Terraced House | £302,083.00 | 42 Terraced Houses |
| Flat | £154,038.00 | 26 Flats |