
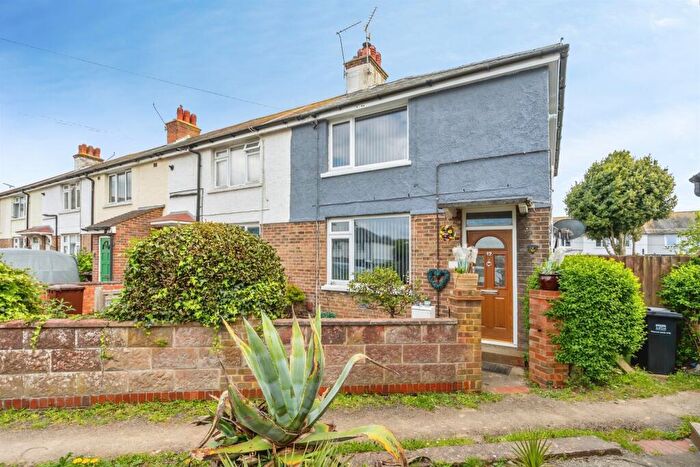
Houses for sale & to rent in Orchard, Bognor Regis
House Prices in Orchard
Properties in Orchard have an average house price of £269k and had 231 Property Transactions within the last 3 years¹.
Orchard is an area in Bognor Regis, West Sussex with 2,576 households², where the most expensive property was sold for £1.55M.
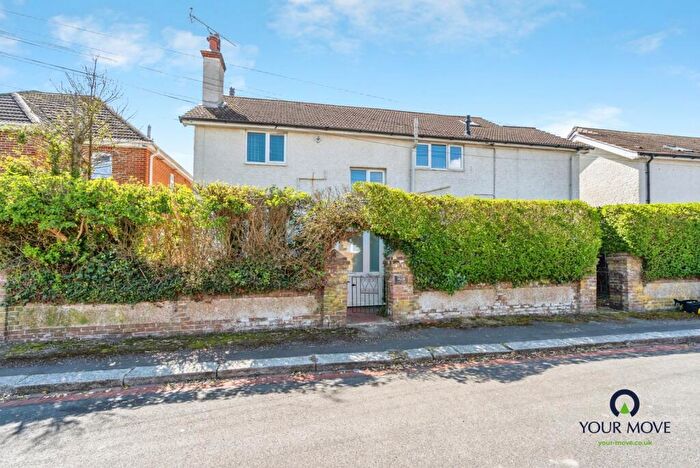
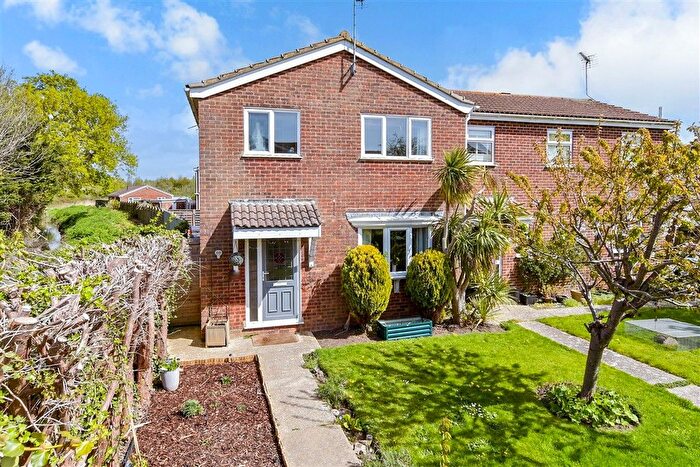
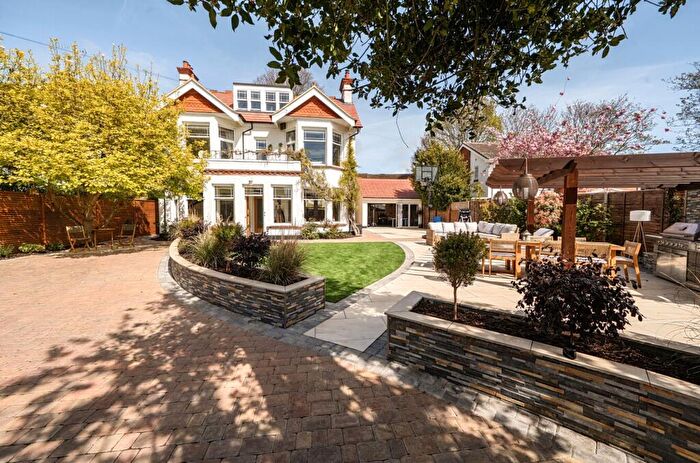
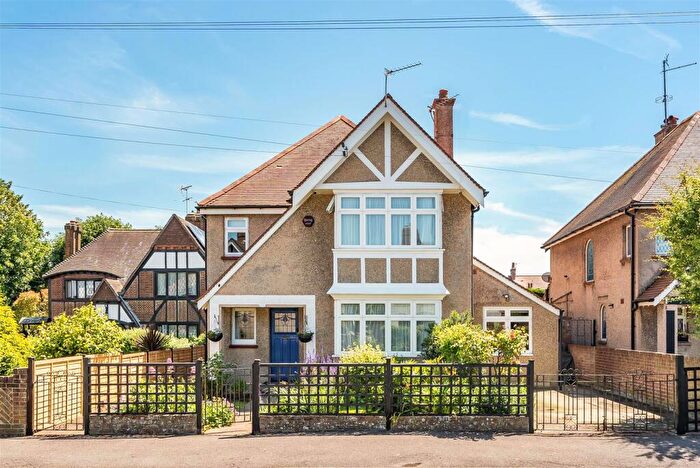
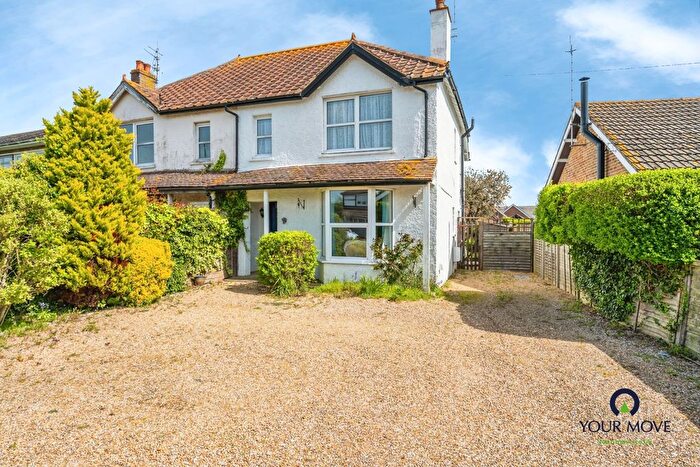
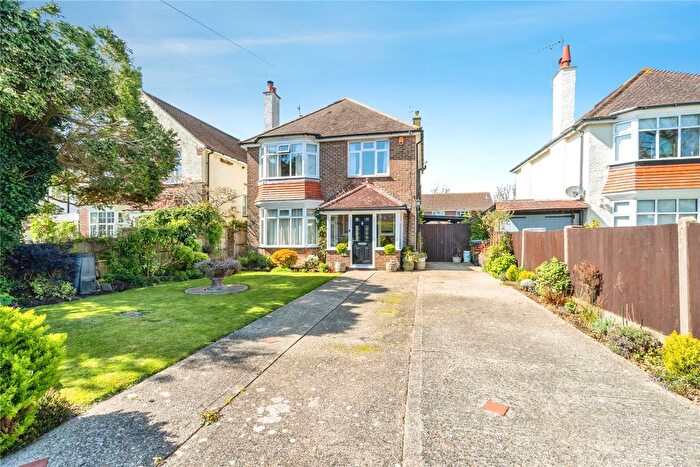
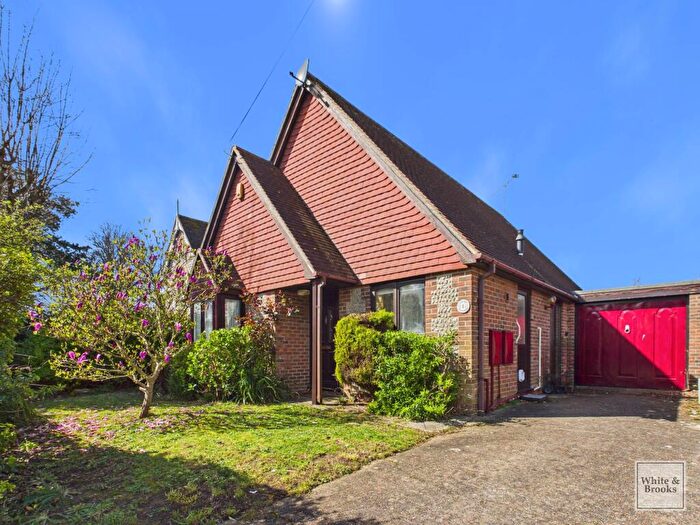
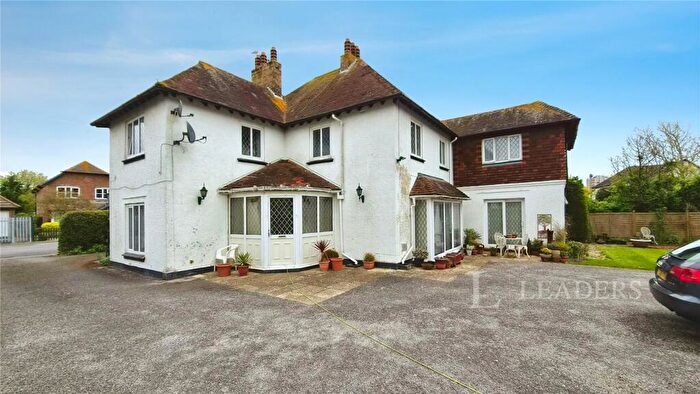
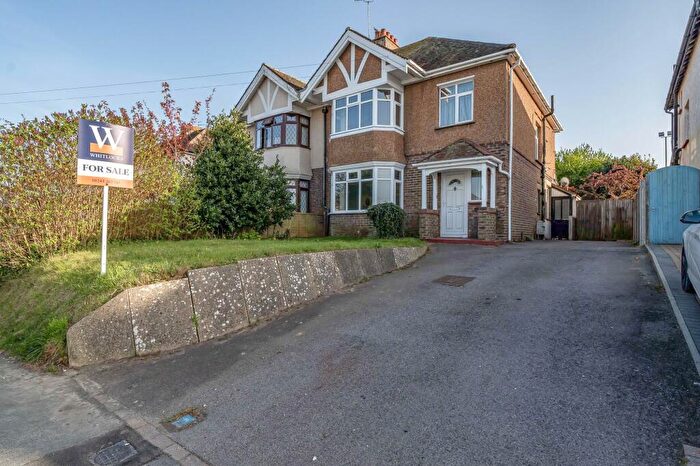
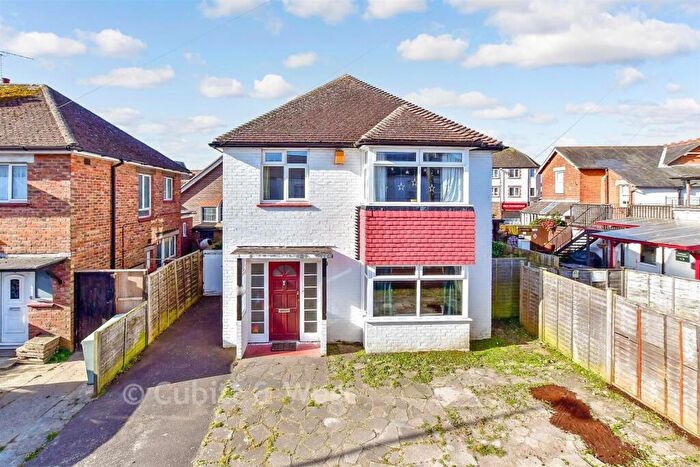
Properties for sale in Orchard
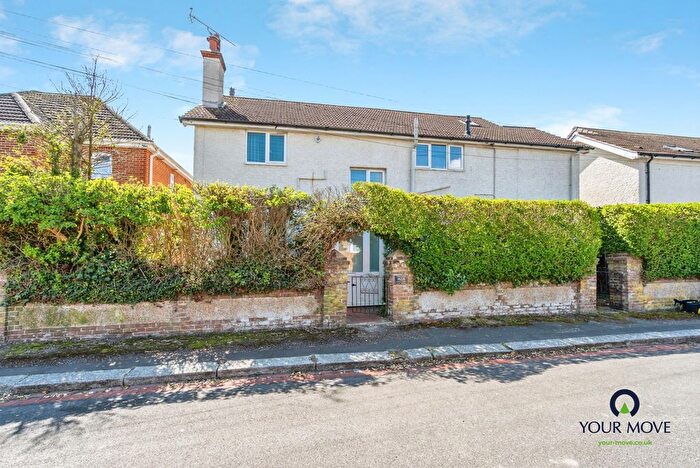
![]()
If you are looking to sell your house, let it out, or receive a property valuation, an expert can help you.
Click the button below to get started.

Roads and Postcodes in Orchard
Navigate through our locations to find the location of your next house in Orchard, Bognor Regis for sale or to rent.
Transport near Orchard
-
 Bognor Regis Station
 -
Barnham Station
-
Ford Station
-
Chichester Station
-
Littlehampton Station
-
Fishbourne Station
-
Arundel Station
-
Bosham Station
-
Angmering Station
-
Amberley Station
- FAQ
- Price Paid By Year
- Property Type Price
Frequently asked questions about Orchard
What is the average price for a property for sale in Orchard?
The average price for a property for sale in Orchard is £269,212. This amount is 22% lower than the average price in Bognor Regis. There are 2,592 property listings for sale in Orchard.
What streets have the most expensive properties for sale in Orchard?
The streets with the most expensive properties for sale in Orchard are Mansfield Road at an average of £425,000, Victoria Mews at an average of £410,000 and Hillsboro Road at an average of £403,666.
What streets have the most affordable properties for sale in Orchard?
The streets with the most affordable properties for sale in Orchard are Durban Road at an average of £142,562, Cranford Gardens at an average of £160,000 and Carlingford Court at an average of £181,666.
Which train stations are available in or near Orchard?
Some of the train stations available in or near Orchard are Bognor Regis, Barnham and Ford.
Property Price Paid in Orchard by Year
The average sold property price by year was:
| Year | Average Sold Price | Price Change |
Sold Properties
|
|---|---|---|---|
| 2025 | £266,140 | -4% |
76 Properties |
| 2024 | £277,088 | 4% |
68 Properties |
| 2023 | £265,741 | 4% |
87 Properties |
| 2022 | £255,022 | 8% |
99 Properties |
| 2021 | £233,827 | -1% |
129 Properties |
| 2020 | £236,109 | 5% |
77 Properties |
| 2019 | £225,382 | 6% |
83 Properties |
| 2018 | £211,666 | -2% |
89 Properties |
| 2017 | £216,371 | 8% |
118 Properties |
| 2016 | £198,690 | 9% |
105 Properties |
| 2015 | £179,958 | 4% |
91 Properties |
| 2014 | £173,284 | 4% |
117 Properties |
| 2013 | £166,825 | -1% |
79 Properties |
| 2012 | £168,043 | -0,2% |
74 Properties |
| 2011 | £168,392 | -3% |
87 Properties |
| 2010 | £172,989 | 8% |
70 Properties |
| 2009 | £158,696 | 0,2% |
60 Properties |
| 2008 | £158,379 | -9% |
117 Properties |
| 2007 | £172,502 | 8% |
150 Properties |
| 2006 | £159,408 | 5% |
162 Properties |
| 2005 | £151,364 | 8% |
121 Properties |
| 2004 | £139,687 | 8% |
163 Properties |
| 2003 | £128,692 | 13% |
161 Properties |
| 2002 | £111,526 | 20% |
185 Properties |
| 2001 | £89,217 | 14% |
131 Properties |
| 2000 | £76,641 | 16% |
155 Properties |
| 1999 | £64,663 | 5% |
141 Properties |
| 1998 | £61,735 | 6% |
165 Properties |
| 1997 | £57,778 | 14% |
163 Properties |
| 1996 | £49,593 | -1% |
130 Properties |
| 1995 | £49,843 | - |
75 Properties |
Property Price per Property Type in Orchard
Here you can find historic sold price data in order to help with your property search.
The average Property Paid Price for specific property types in the last three years are:
| Property Type | Average Sold Price | Sold Properties |
|---|---|---|
| Flat | £150,295.00 | 60 Flats |
| Semi Detached House | £314,346.00 | 85 Semi Detached Houses |
| Detached House | £455,236.00 | 19 Detached Houses |
| Terraced House | £265,693.00 | 67 Terraced Houses |