
Houses for sale in Bognor Regis, West Sussex
House Prices in Bognor Regis
Properties in Bognor Regis have an average house price of £347k and had 3,389 Property Transactions within the last 3 years.¹
Bognor Regis is an area in West Sussex with 33,163 households², where the most expensive property was sold for £4.83M.
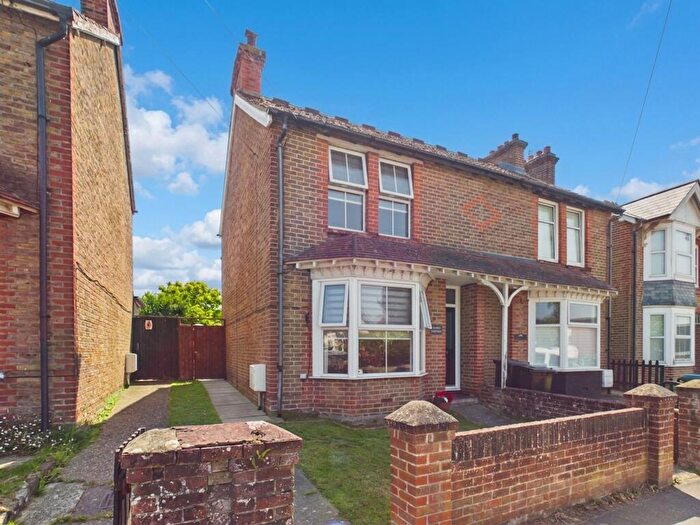
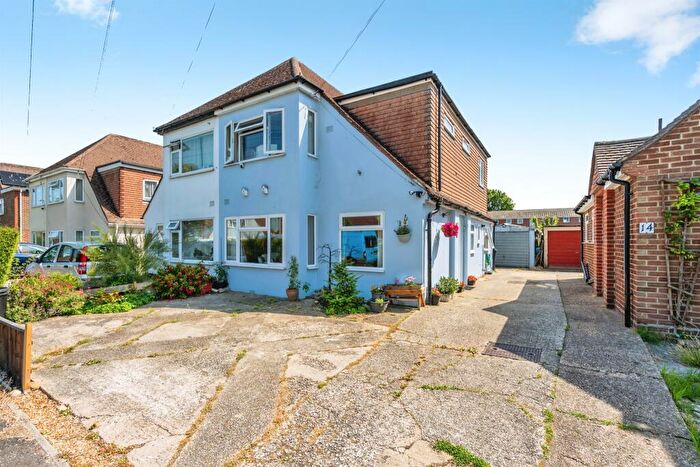
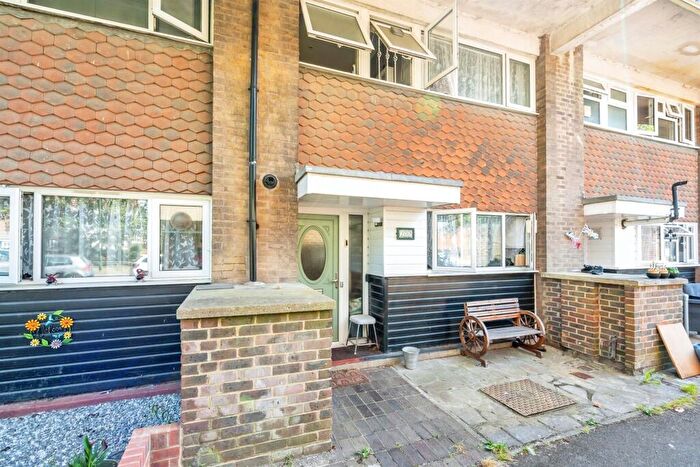
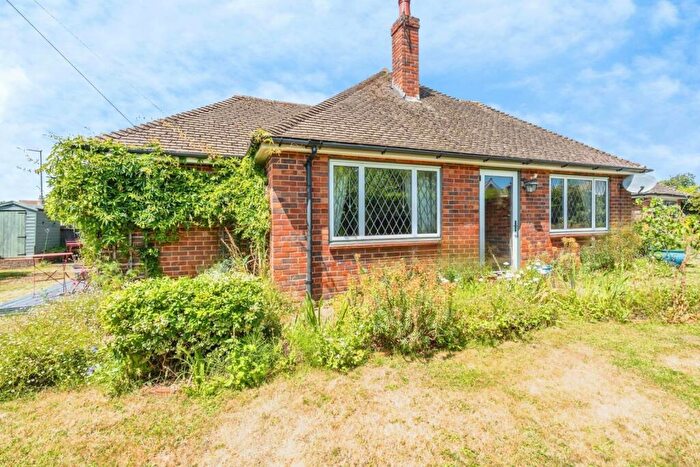
Properties for sale in Bognor Regis
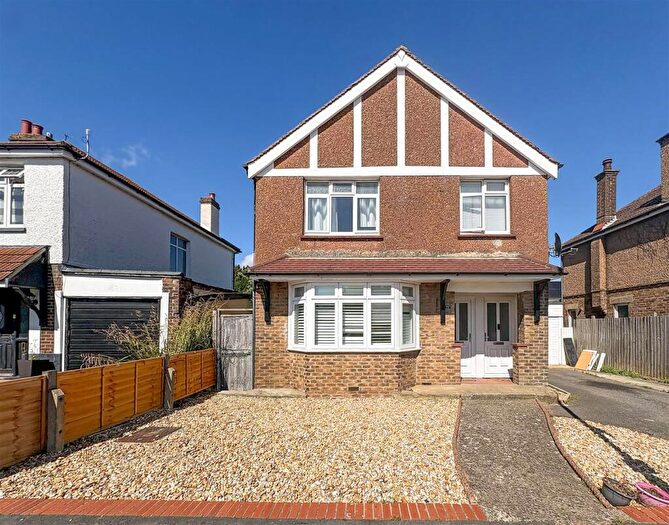
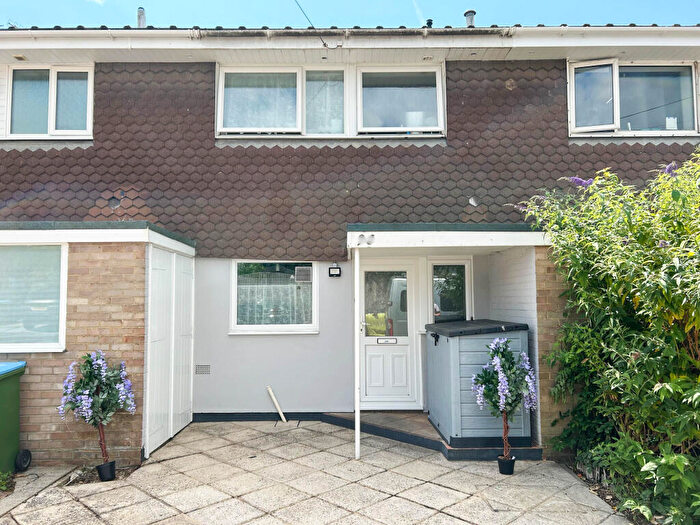
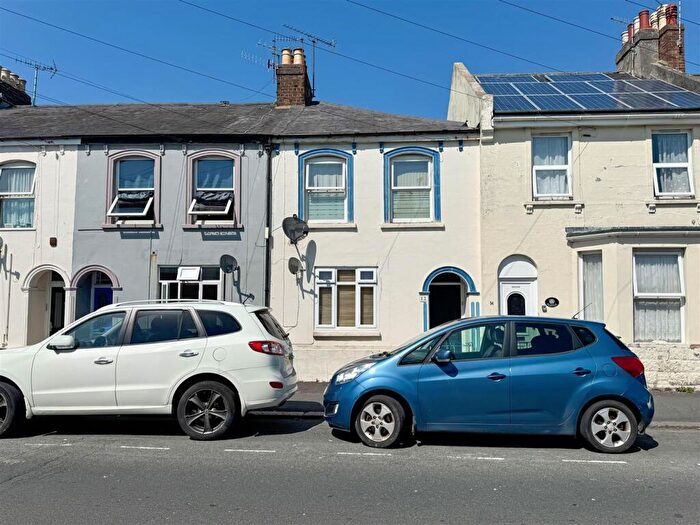
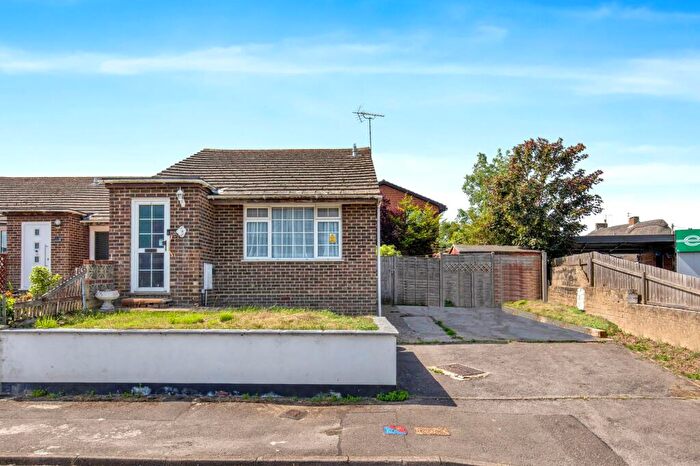
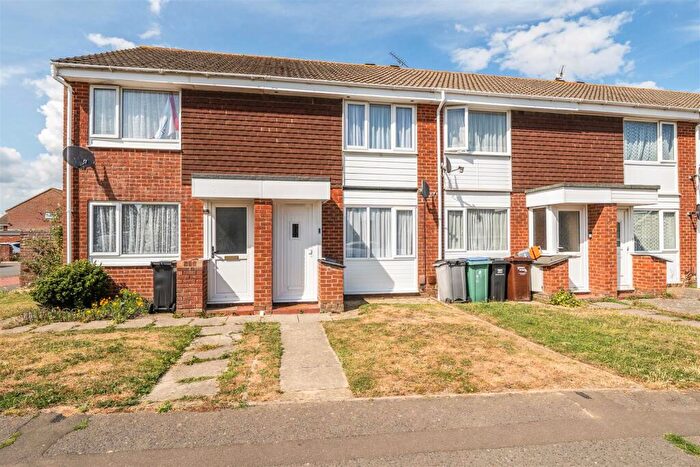
![]()
If you are looking to sell your house, let it out, or receive a property valuation, an expert can help you.
Click the button below to get started.
Neighbourhoods in Bognor Regis
Navigate through our locations to find the location of your next house in Bognor Regis, West Sussex for sale or to rent.
Property price trends in Bognor Regis
According to the latest Land Registry data, the average home in Bognor Regis sold for £343,424 in 2026. That figure comes from a substantial record of 48,659 sales logged over the past 31 years.
Prices have held fairly steady over the last three years. Compared with 2023, when the typical sale came in around £345,065, values are broadly unchanged.
Looking back five years, average prices are up about 1.6% since 2021, a gain of around £5,508 in cash terms.
Zoom out to the past decade for the fuller picture. Back in 2016, homes here averaged £270,959, so the typical sold price has climbed about 26.7% since then, roughly 2.4% a year. Stretch the view to fifteen years and that annual pace edges up closer to 2.9%.
Frequently asked questions about Bognor Regis
What is the average price for a property for sale in Bognor Regis?
The average price for a property for sale in Bognor Regis is £346,796. This amount is 18% lower than the average price in West Sussex. There are more than 10,000 property listings for sale in Bognor Regis.
What locations have the most expensive properties for sale in Bognor Regis?
The locations with the most expensive properties for sale in Bognor Regis are Yapton at an average of £599,750, Aldwick West at an average of £474,387 and Aldwick East at an average of £442,036.
What locations have the most affordable properties for sale in Bognor Regis?
The locations with the most affordable properties for sale in Bognor Regis are Marine at an average of £213,878, Hotham at an average of £223,084 and Orchard at an average of £267,950.
Which train stations are available in or near Bognor Regis?
Some of the train stations available in or near Bognor Regis are Bognor Regis, Barnham and Ford.
Property Price Paid in Bognor Regis by Year
The average sold property price by year was:
| Year | Average Sold Price | Price Change |
Sold Properties
|
|---|---|---|---|
| 2026 | £343,424 | -3% |
104 Properties |
| 2025 | £355,015 | 4% |
1,062 Properties |
| 2024 | £341,115 | -1% |
1,147 Properties |
| 2023 | £345,065 | -3% |
1,076 Properties |
| 2022 | £356,665 | 5% |
1,396 Properties |
| 2021 | £337,916 | 8% |
1,706 Properties |
| 2020 | £312,498 | 5% |
1,191 Properties |
| 2019 | £298,053 | 2% |
1,449 Properties |
| 2018 | £292,482 | 3% |
1,465 Properties |
| 2017 | £285,052 | 5% |
1,636 Properties |
Property Price per Property Type in Bognor Regis
Here you can find historic sold price data in order to help with your property search.
The average Property Paid Price for specific property types in the last three years are:
| Property Type | Average Sold Price | Sold Properties |
|---|---|---|
| Semi Detached House | £339,693.00 | 754 Semi Detached Houses |
| Terraced House | £288,002.00 | 663 Terraced Houses |
| Detached House | £523,229.00 | 1,121 Detached Houses |
| Flat | £166,483.00 | 851 Flats |
Transport in Bognor Regis
Please see below transportation links in this area:
