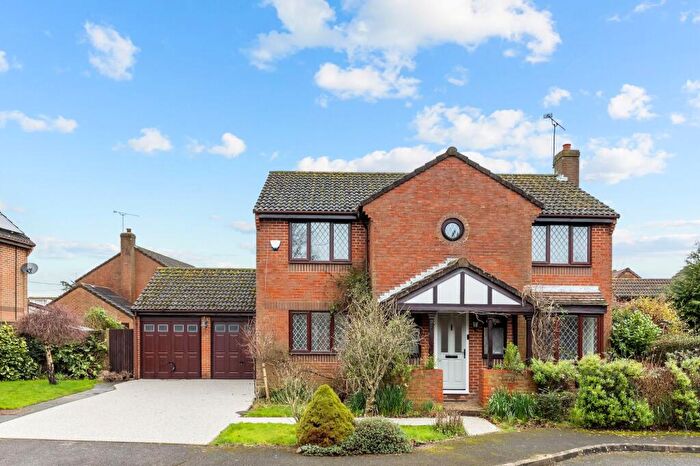
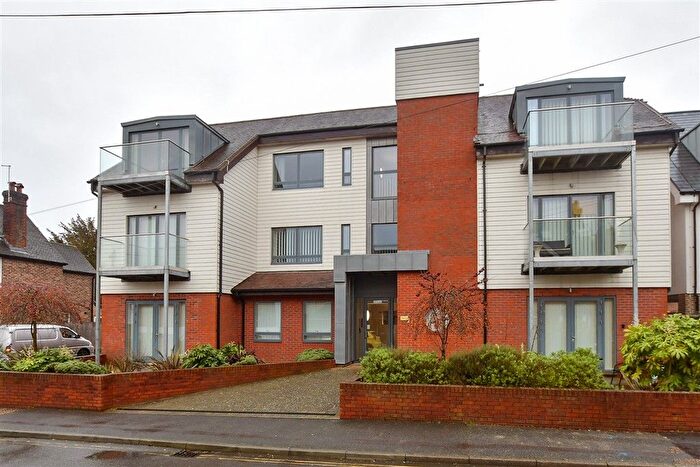
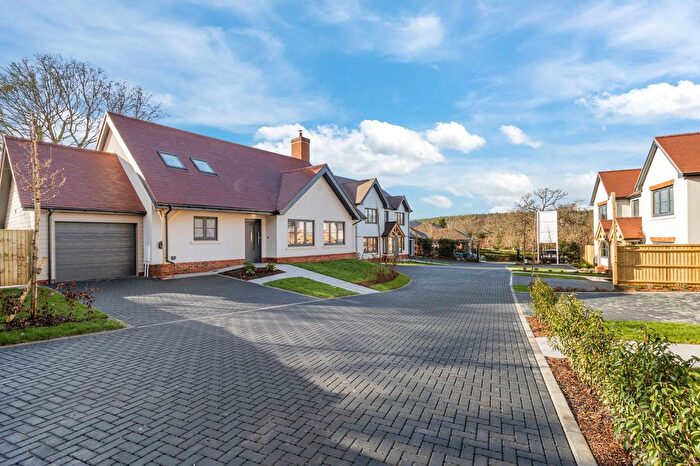
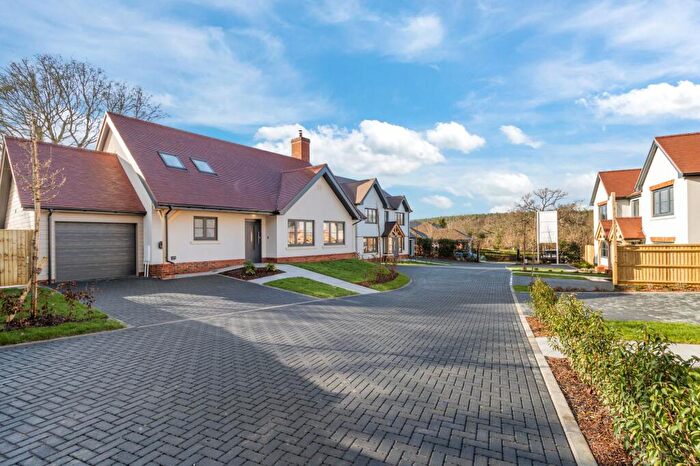
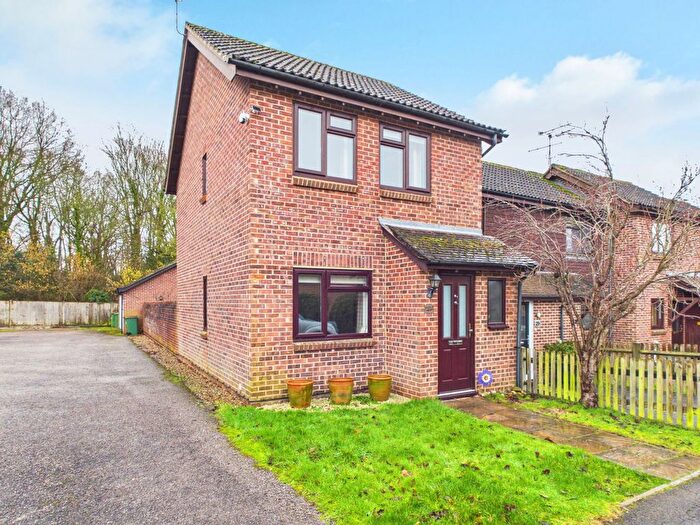
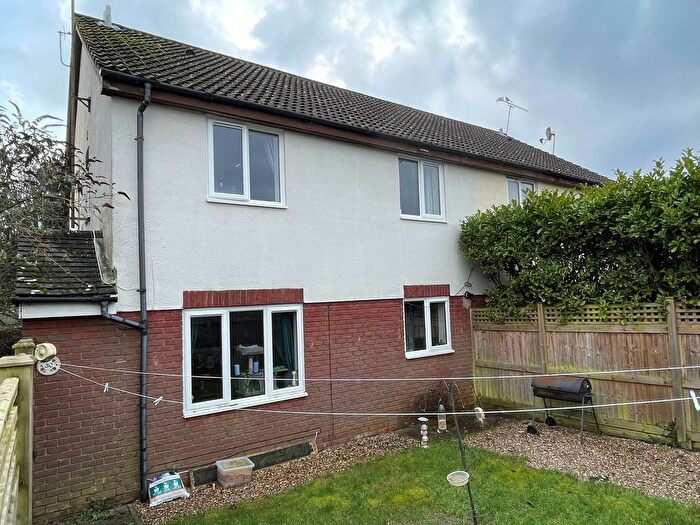
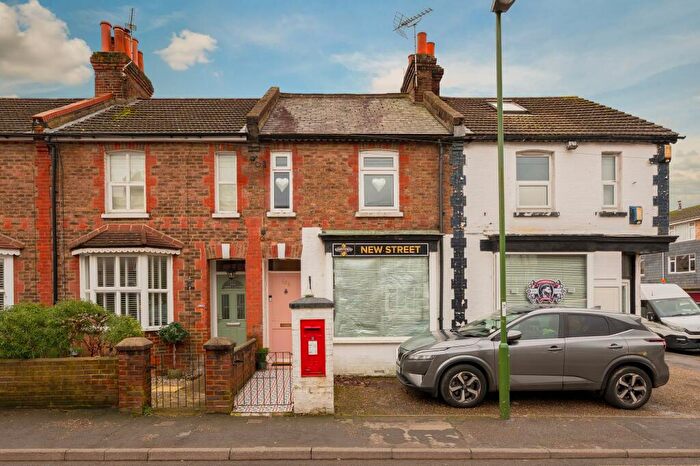
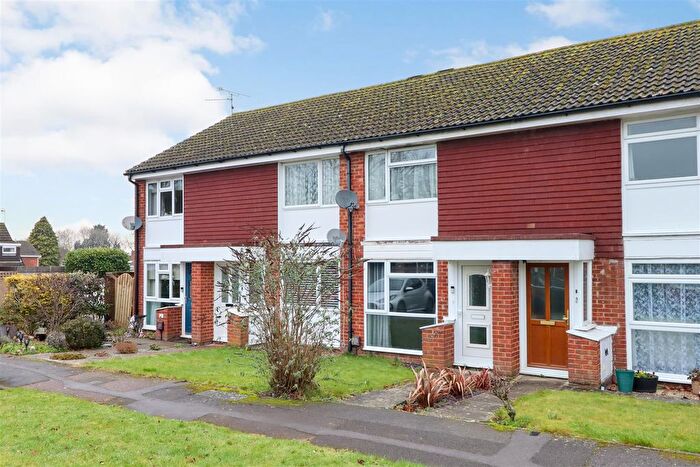
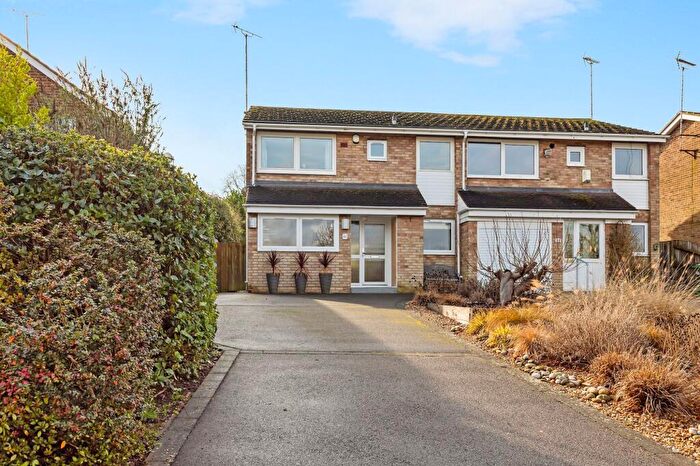
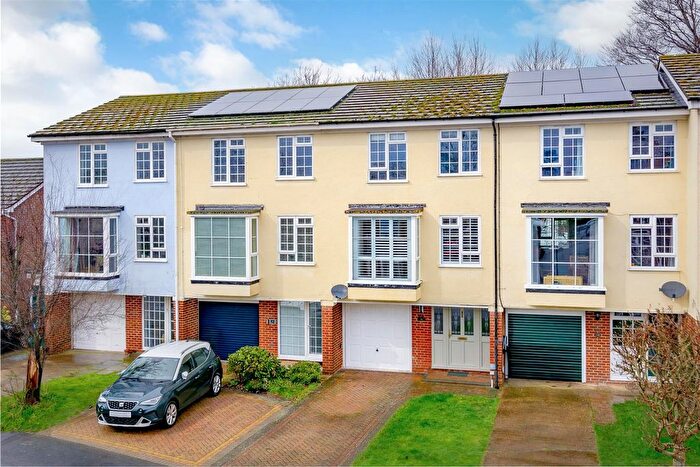
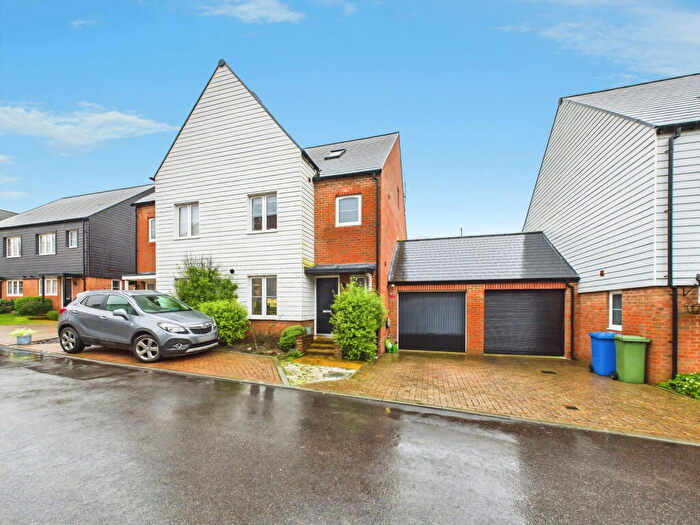
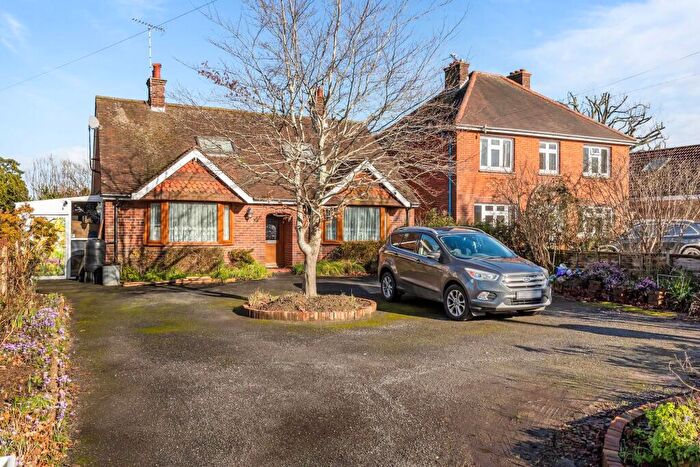
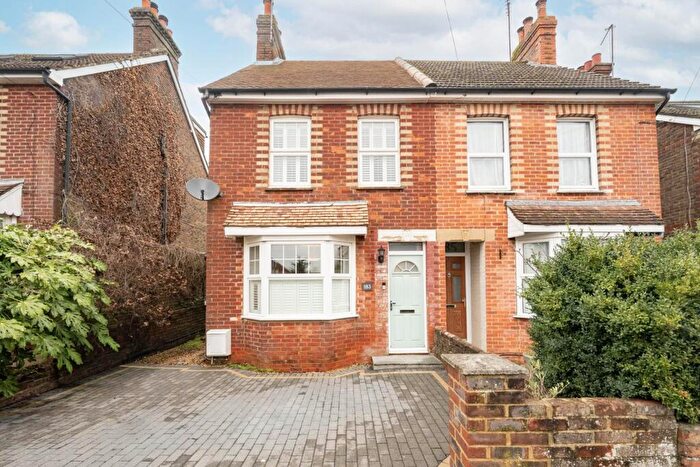
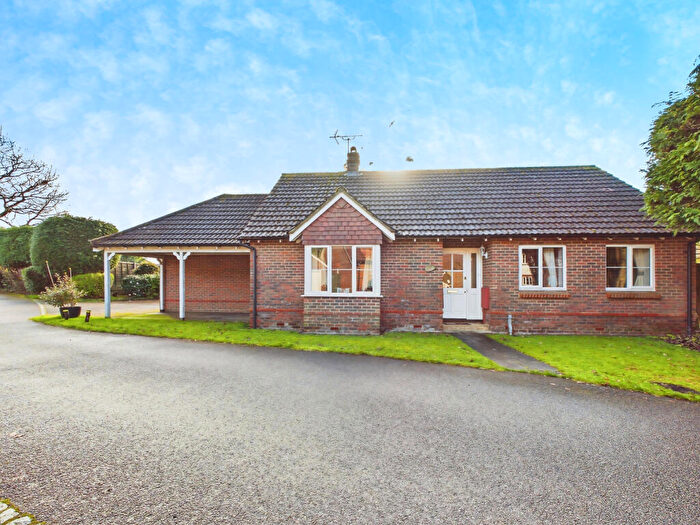
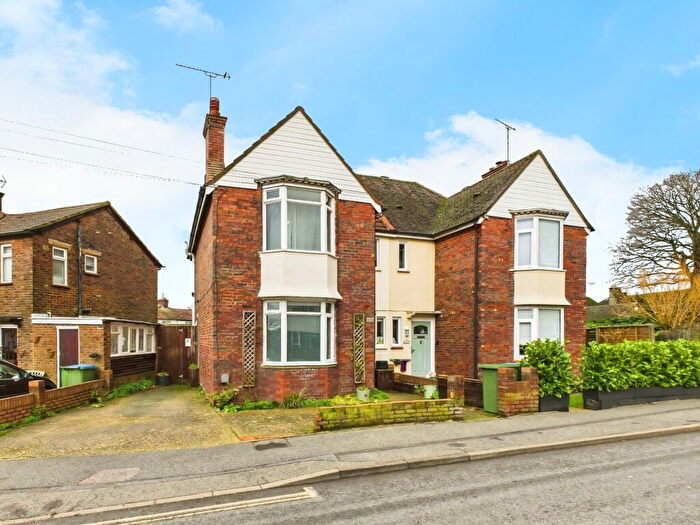
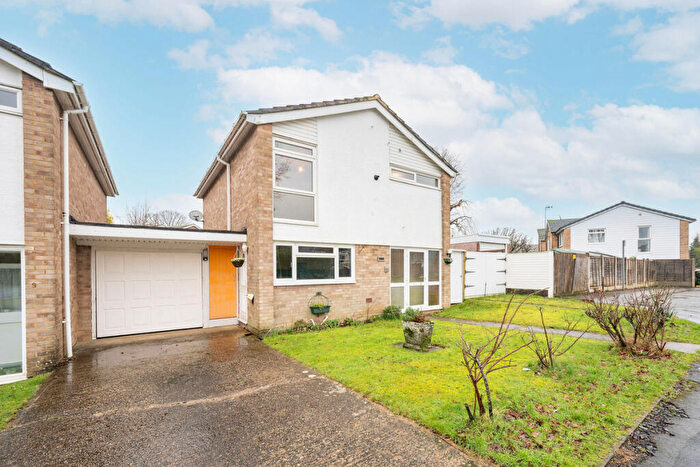
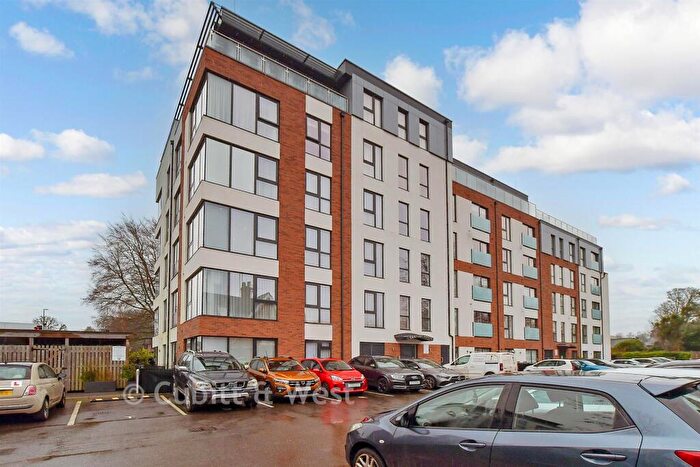
Houses for sale & to rent in Nuthurst, Horsham
House Prices in Nuthurst
Properties in Nuthurst have an average house price of £728,606.00 and had 75 Property Transactions within the last 3 years¹.
Nuthurst is an area in Horsham, West Sussex with 1,060 households², where the most expensive property was sold for £3,558,136.00.
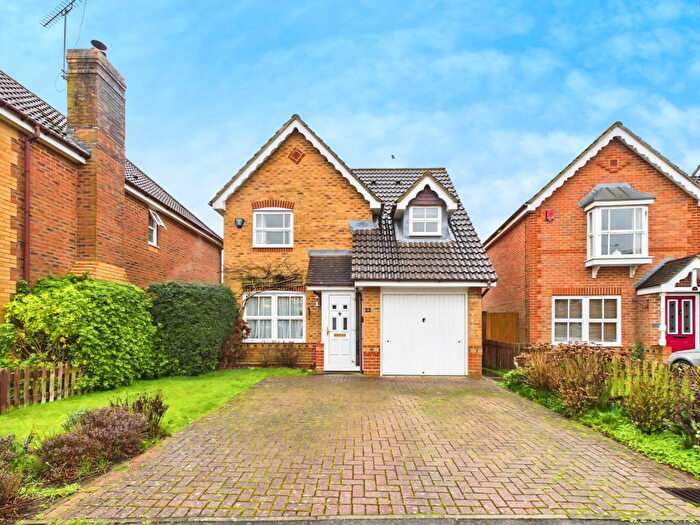
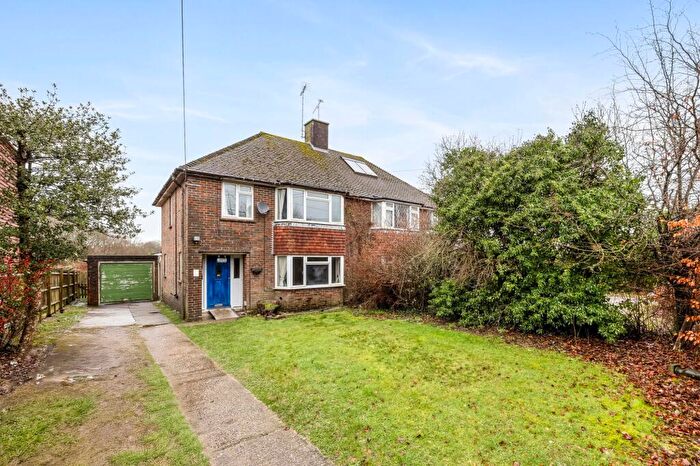
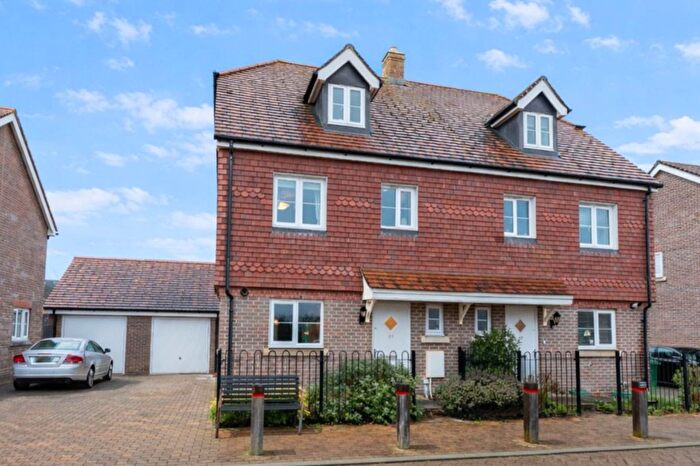
Properties for sale in Nuthurst
Roads and Postcodes in Nuthurst
Navigate through our locations to find the location of your next house in Nuthurst, Horsham for sale or to rent.
| Streets | Postcodes |
|---|---|
| Bakers Mews | RH13 6NW |
| Birch Grove | RH13 6GG |
| Brick Kiln Close | RH13 6TB |
| Brighton Road | RH13 6HY RH13 6HZ RH13 6JA RH13 6JB RH13 6JD RH13 6NH RH13 6NQ RH13 6PP RH13 6PR RH13 6PS RH13 6PT RH13 6PY |
| Broadwater Lane | RH13 6QJ RH13 6QS RH13 6QW |
| Burnthouse Lane | RH13 6NN |
| Church Close | RH13 6NS |
| Church Lane | RH13 6LU |
| Church Road | RH13 6JE |
| Cisswood Cottages | RH13 6LR |
| Copsale Road | RH13 6QU RH13 6QY |
| Fieldgate Close | RH13 6RS |
| Fir Tree Close | RH13 6NT |
| Forest Close | RH13 6JQ |
| Forest Park | RH13 6NB |
| Gaggle Wood | RH13 6JR |
| Golding Lane | RH13 6JX |
| Greens Lane | RH13 6JW |
| Hammerpond Road | RH13 6PE RH13 6PG |
| Handcross Road | RH13 6NU RH13 6NX RH13 6NZ |
| Handford Way | RH13 6PD |
| Harriots Close | RH13 6LJ |
| Heath Close | RH13 6EE |
| Leechpond Hill | RH13 6NR |
| Lime Kiln Road | RH13 6JH |
| Masons Field | RH13 6JP |
| Mill Lane | RH13 6PX |
| Nuthurst Road | RH13 6LG RH13 6RA RH13 6RB RH13 6RD RH13 6RE |
| Nuthurst Street | RH13 6LH RH13 6RG |
| Oak Way | RH13 6JS |
| Park Lane | RH13 6LL |
| Peppersgate | RH13 6ND |
| Polecat Lane | RH13 6QR |
| Pound Lane | RH13 6JJ RH13 6JL |
| Ryecroft Meadow | RH13 6JN |
| Sandygate Lane | RH13 6NF |
| Sedgwick Lane | RH13 6QE |
| Sedgwick Park | RH13 6QG RH13 6QQ |
| Stanford Cottages | RH13 6QN |
| Swallowfield Close | RH13 6JF |
| The Birches | RH13 6JT |
| The Quarries | RH13 6SW |
| The Timbers | RH13 6EF |
| Trinity Fields | RH13 6GH |
| Whites Cottages | RH13 6QL |
| Whytings | RH13 6JZ |
| Winterpit Close | RH13 6JY |
| Winterpit Lane | RH13 6LX RH13 6LZ RH13 6NA |
| Woodlands Walk | RH13 6JG |
Transport near Nuthurst
- FAQ
- Price Paid By Year
- Property Type Price
Frequently asked questions about Nuthurst
What is the average price for a property for sale in Nuthurst?
The average price for a property for sale in Nuthurst is £728,606. This amount is 56% higher than the average price in Horsham. There are 3,903 property listings for sale in Nuthurst.
What streets have the most expensive properties for sale in Nuthurst?
The streets with the most expensive properties for sale in Nuthurst are Handcross Road at an average of £2,009,068, Hammerpond Road at an average of £1,225,000 and Broadwater Lane at an average of £1,090,166.
What streets have the most affordable properties for sale in Nuthurst?
The streets with the most affordable properties for sale in Nuthurst are The Timbers at an average of £261,250, Bakers Mews at an average of £332,000 and Ryecroft Meadow at an average of £406,014.
Which train stations are available in or near Nuthurst?
Some of the train stations available in or near Nuthurst are Horsham, Littlehaven and Christ's Hospital.
Property Price Paid in Nuthurst by Year
The average sold property price by year was:
| Year | Average Sold Price | Price Change |
Sold Properties
|
|---|---|---|---|
| 2025 | £594,788 | -27% |
22 Properties |
| 2024 | £757,673 | -7% |
26 Properties |
| 2023 | £809,653 | 2% |
27 Properties |
| 2022 | £795,500 | 8% |
43 Properties |
| 2021 | £729,624 | 9% |
49 Properties |
| 2020 | £662,404 | -5% |
37 Properties |
| 2019 | £693,870 | 8% |
33 Properties |
| 2018 | £639,942 | 13% |
32 Properties |
| 2017 | £557,411 | -14% |
29 Properties |
| 2016 | £634,089 | 22% |
33 Properties |
| 2015 | £496,187 | -1% |
29 Properties |
| 2014 | £501,741 | 11% |
46 Properties |
| 2013 | £446,512 | 4% |
39 Properties |
| 2012 | £428,812 | -20% |
36 Properties |
| 2011 | £515,290 | 2% |
45 Properties |
| 2010 | £503,138 | 17% |
29 Properties |
| 2009 | £419,519 | -2% |
25 Properties |
| 2008 | £426,990 | -19% |
26 Properties |
| 2007 | £508,525 | 15% |
39 Properties |
| 2006 | £430,473 | 11% |
46 Properties |
| 2005 | £383,929 | -10% |
31 Properties |
| 2004 | £421,201 | 5% |
35 Properties |
| 2003 | £399,160 | 20% |
52 Properties |
| 2002 | £321,054 | -14% |
43 Properties |
| 2001 | £364,622 | 29% |
48 Properties |
| 2000 | £257,361 | 4% |
46 Properties |
| 1999 | £247,516 | -14% |
50 Properties |
| 1998 | £281,277 | 42% |
38 Properties |
| 1997 | £162,479 | 5% |
36 Properties |
| 1996 | £154,634 | 18% |
43 Properties |
| 1995 | £126,871 | - |
40 Properties |
Property Price per Property Type in Nuthurst
Here you can find historic sold price data in order to help with your property search.
The average Property Paid Price for specific property types in the last three years are:
| Property Type | Average Sold Price | Sold Properties |
|---|---|---|
| Semi Detached House | £506,860.00 | 19 Semi Detached Houses |
| Detached House | £894,449.00 | 47 Detached Houses |
| Terraced House | £371,142.00 | 7 Terraced Houses |
| Flat | £189,000.00 | 2 Flats |

