
Houses for sale & to rent in Horsham, West Sussex
House Prices in Horsham
Properties in Horsham have an average house price of £468k and had 3,600 Property Transactions within the last 3 years.¹
Horsham is an area in West Sussex with 33,447 households², where the most expensive property was sold for £3.95M.
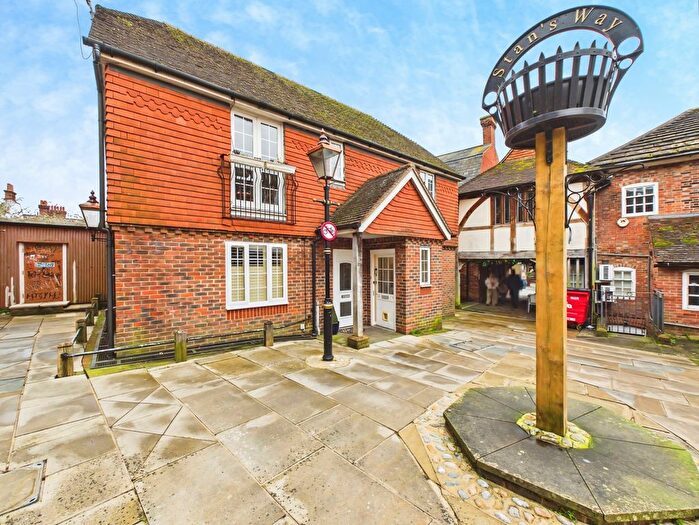
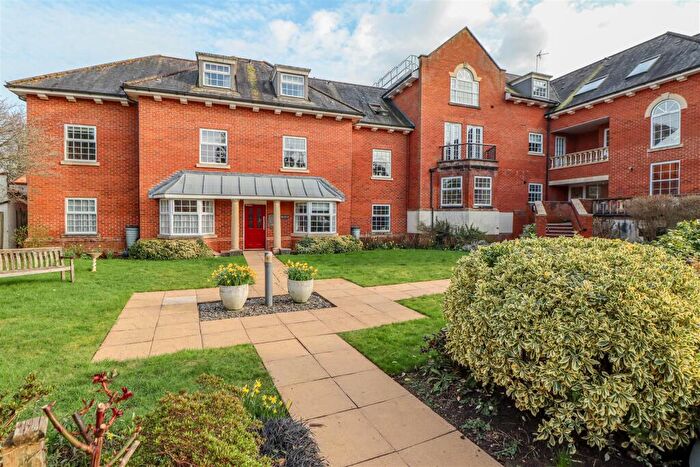
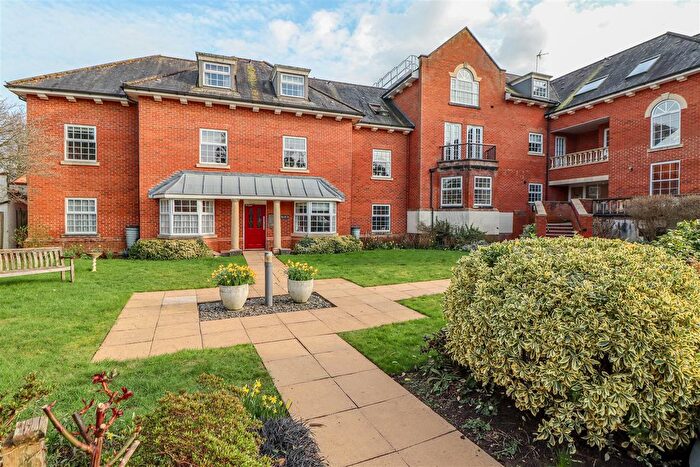
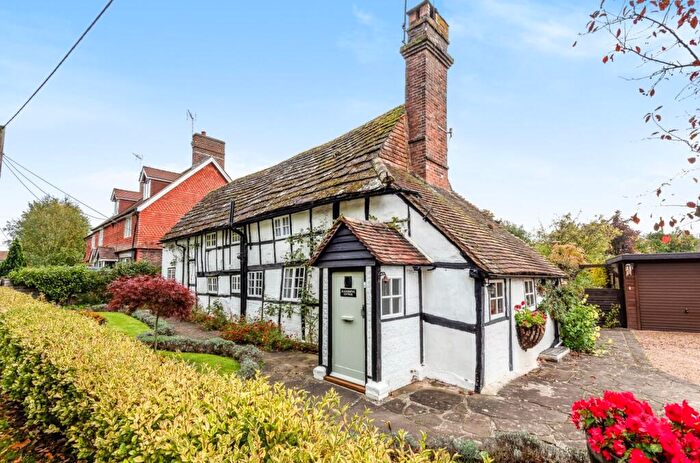
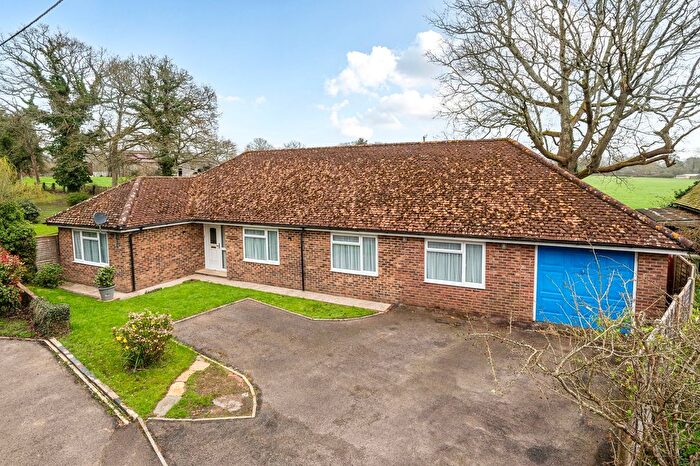
Properties for sale in Horsham
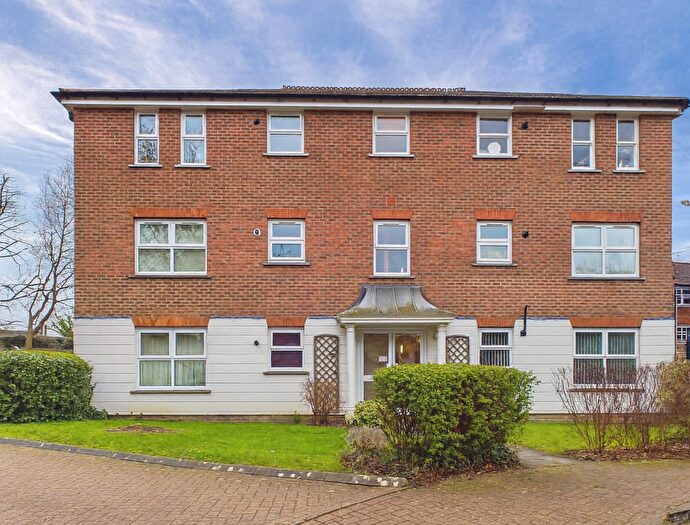
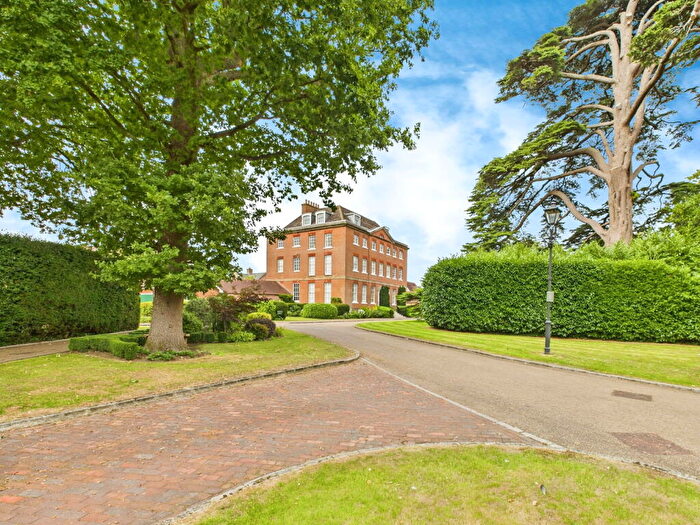
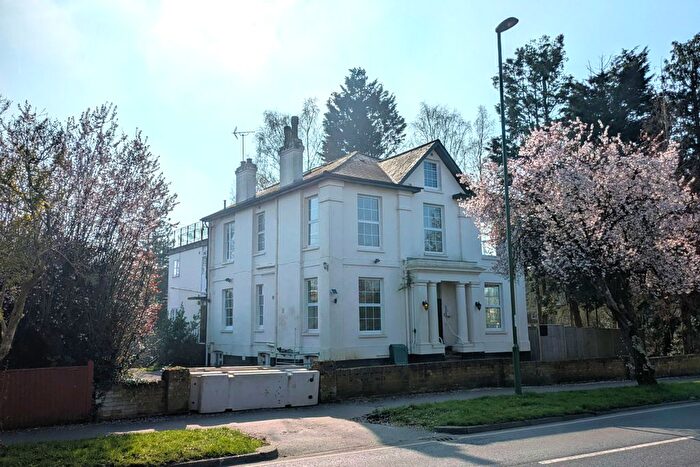
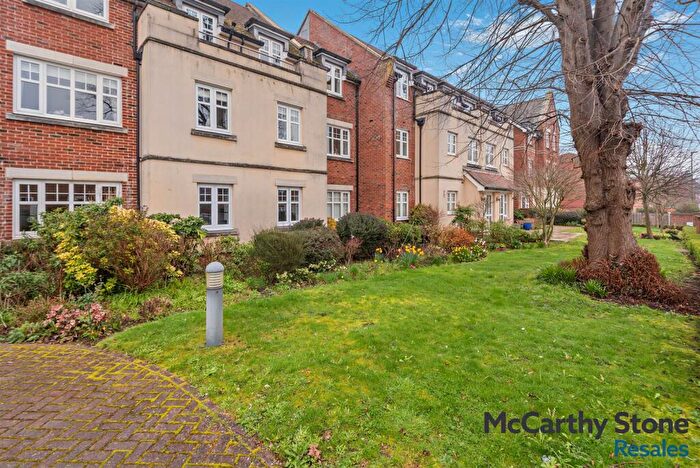
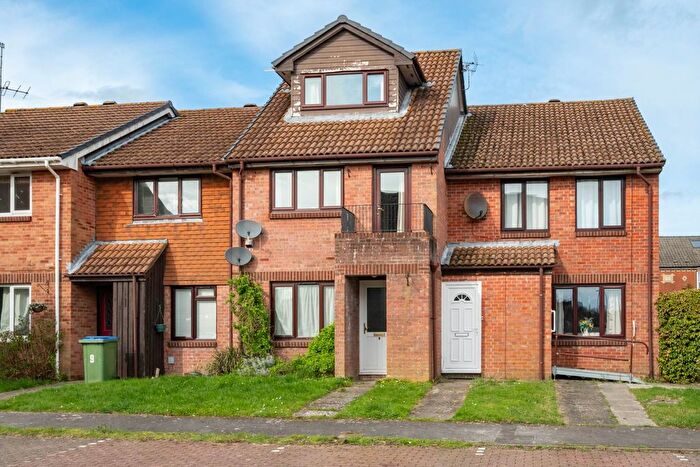
![]()
If you are looking to sell your house, let it out, or receive a property valuation, an expert can help you.
Click the button below to get started.


Neighbourhoods in Horsham
Navigate through our locations to find the location of your next house in Horsham, West Sussex for sale or to rent.
- Billingshurst And Shipley
- Bolney
- Broadbridge Heath
- Chanctonbury
- Cowfold, Shermanbury And West Grinstead
- Denne
- Forest
- Holbrook East
- Holbrook West
- Horsham Park
- Itchingfield, Slinfold And Warnham
- Nuthurst
- Roffey North
- Roffey South
- Rudgwick
- Rusper And Colgate
- Southwater
- Steyning
- Trafalgar
- Colgate & Rusper
- Itchingfield, Slinfold & Warnham
- Southwater North
- Southwater South & Shipley
- Nuthurst & Lower Beeding
- Cowfold, Shermanbury & West Grinstead
- West Chiltington, Thakeham & Ashington
Transport in Horsham
Please see below transportation links in this area:

- FAQ
- Price Paid By Year
- Property Type Price
Frequently asked questions about Horsham
What is the average price for a property for sale in Horsham?
The average price for a property for sale in Horsham is £468,321. This amount is 11% higher than the average price in West Sussex. There are more than 10,000 property listings for sale in Horsham.
What locations have the most expensive properties for sale in Horsham?
The locations with the most expensive properties for sale in Horsham are Cowfold, Shermanbury & West Grinstead at an average of £960,000, Billingshurst And Shipley at an average of £758,764 and Rudgwick at an average of £735,776.
What locations have the most affordable properties for sale in Horsham?
The locations with the most affordable properties for sale in Horsham are Roffey South at an average of £342,621, Denne at an average of £394,268 and Broadbridge Heath at an average of £414,426.
Which train stations are available in or near Horsham?
Some of the train stations available in or near Horsham are Horsham, Christ's Hospital and Littlehaven.
Property Price Paid in Horsham by Year
The average sold property price by year was:
| Year | Average Sold Price | Price Change |
Sold Properties
|
|---|---|---|---|
| 2025 | £461,837 | -3% |
1,100 Properties |
| 2024 | £476,553 | 2% |
1,308 Properties |
| 2023 | £465,273 | -2% |
1,192 Properties |
| 2022 | £472,632 | 5% |
1,551 Properties |
| 2021 | £449,600 | -0,4% |
2,024 Properties |
| 2020 | £451,594 | 11% |
1,490 Properties |
| 2019 | £402,231 | 1% |
1,681 Properties |
| 2018 | £397,060 | -0,2% |
1,643 Properties |
| 2017 | £397,985 | 3% |
1,731 Properties |
| 2016 | £384,345 | 4% |
2,002 Properties |
| 2015 | £369,442 | 8% |
1,952 Properties |
| 2014 | £339,346 | 5% |
1,938 Properties |
| 2013 | £322,403 | 5% |
1,496 Properties |
| 2012 | £307,471 | -2% |
1,172 Properties |
| 2011 | £313,349 | 2% |
1,133 Properties |
| 2010 | £305,640 | 12% |
1,217 Properties |
| 2009 | £269,959 | -6% |
1,124 Properties |
| 2008 | £286,594 | -3% |
1,062 Properties |
| 2007 | £295,307 | 10% |
1,881 Properties |
| 2006 | £267,240 | 9% |
2,134 Properties |
| 2005 | £243,965 | -1% |
1,731 Properties |
| 2004 | £245,877 | 9% |
1,961 Properties |
| 2003 | £223,135 | 9% |
1,877 Properties |
| 2002 | £203,066 | 12% |
2,318 Properties |
| 2001 | £178,281 | 11% |
2,138 Properties |
| 2000 | £158,828 | 14% |
1,815 Properties |
| 1999 | £136,098 | 11% |
2,167 Properties |
| 1998 | £121,364 | 12% |
2,074 Properties |
| 1997 | £106,263 | 7% |
2,396 Properties |
| 1996 | £98,850 | 3% |
2,063 Properties |
| 1995 | £96,066 | - |
1,730 Properties |
Property Price per Property Type in Horsham
Here you can find historic sold price data in order to help with your property search.
The average Property Paid Price for specific property types in the last three years are:
| Property Type | Average Sold Price | Sold Properties |
|---|---|---|
| Semi Detached House | £464,231.00 | 905 Semi Detached Houses |
| Terraced House | £386,022.00 | 836 Terraced Houses |
| Detached House | £744,910.00 | 987 Detached Houses |
| Flat | £238,404.00 | 872 Flats |