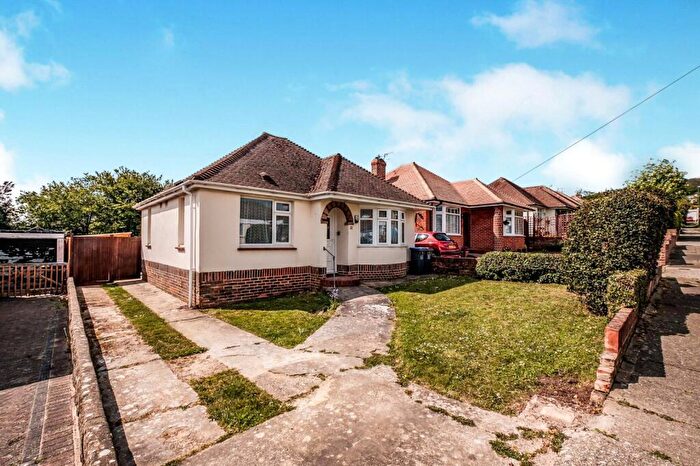
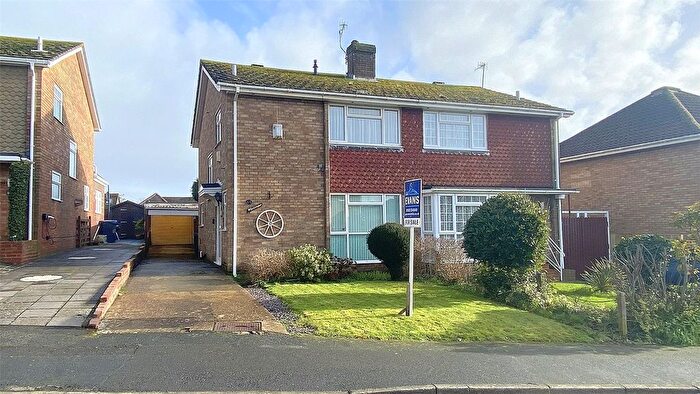
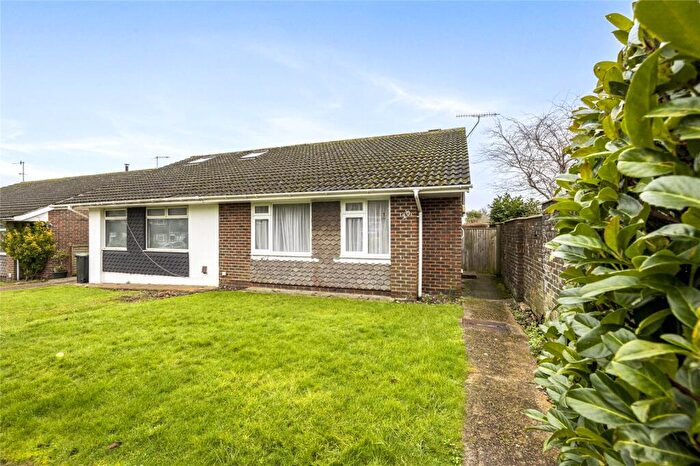
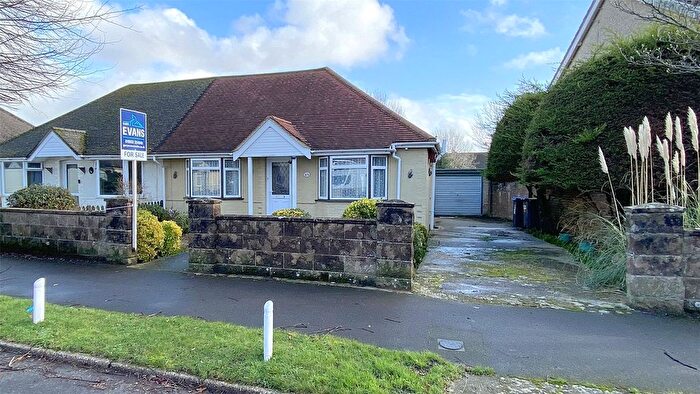
Houses for sale & to rent in Cokeham, Lancing
House Prices in Cokeham
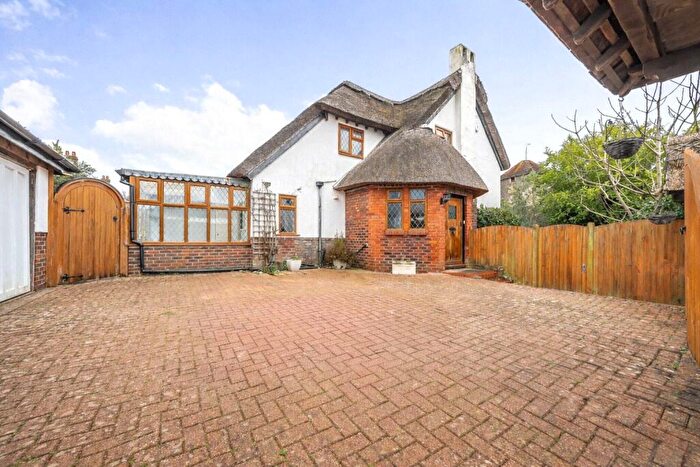
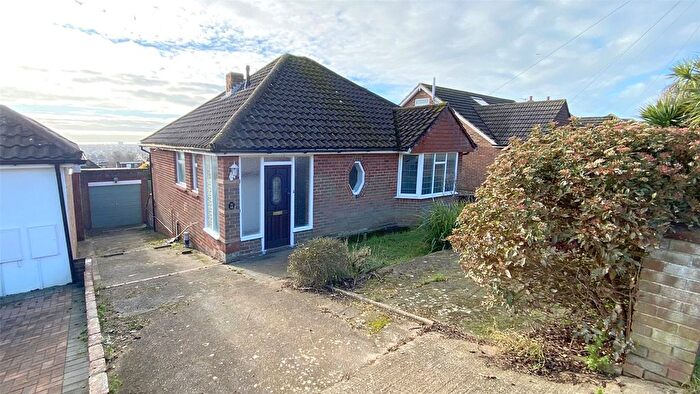
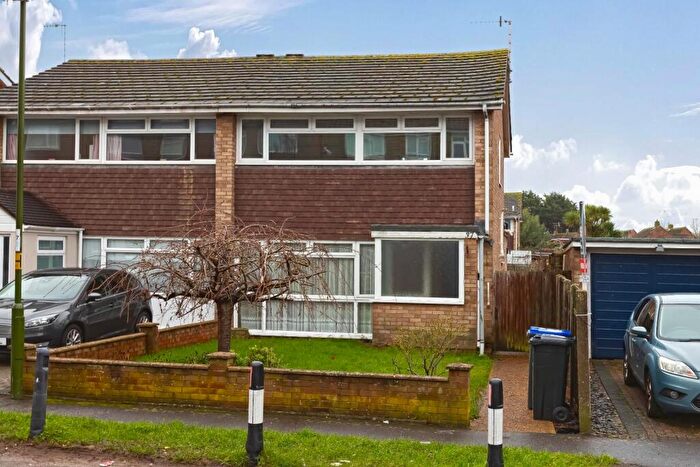
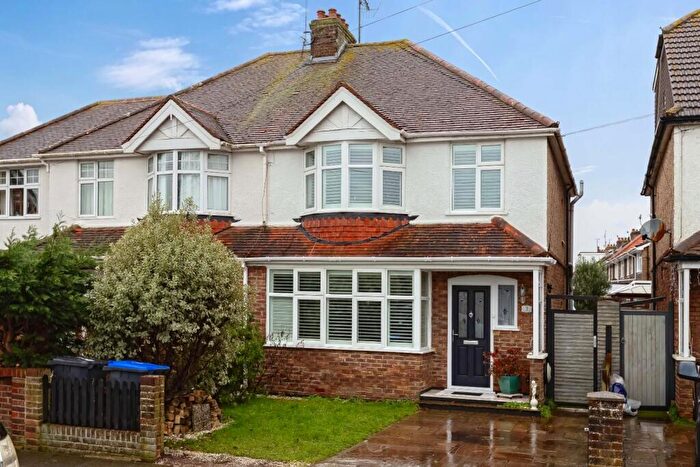
Properties in Cokeham have an average house price of £352,694.00 and had 166 Property Transactions within the last 3 years¹.
Cokeham is an area in Lancing, West Sussex with 1,862 households², where the most expensive property was sold for £733,000.00.
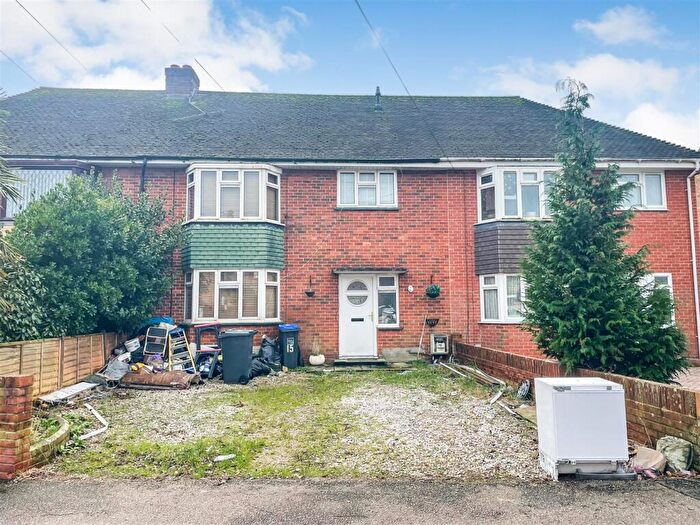
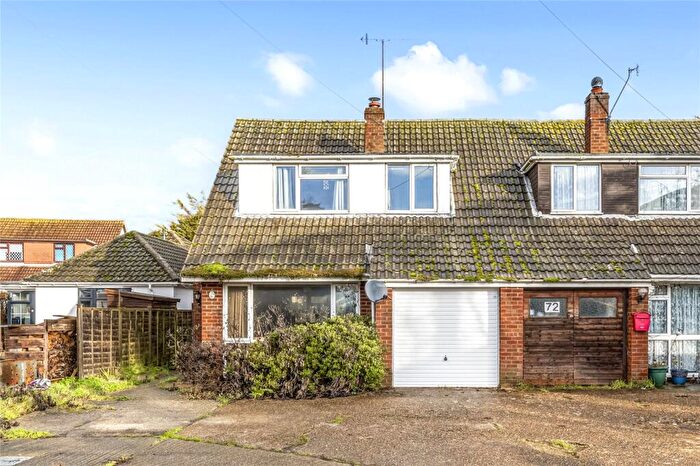
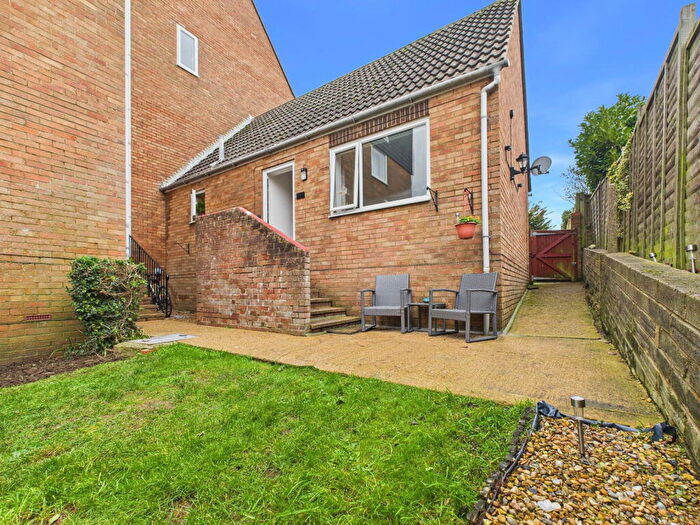
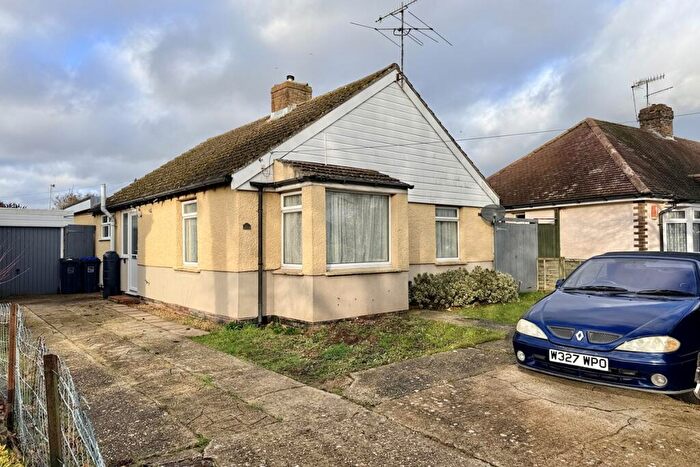
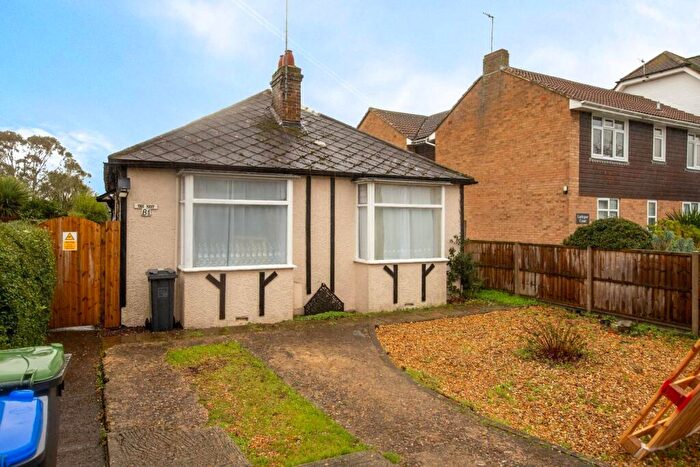
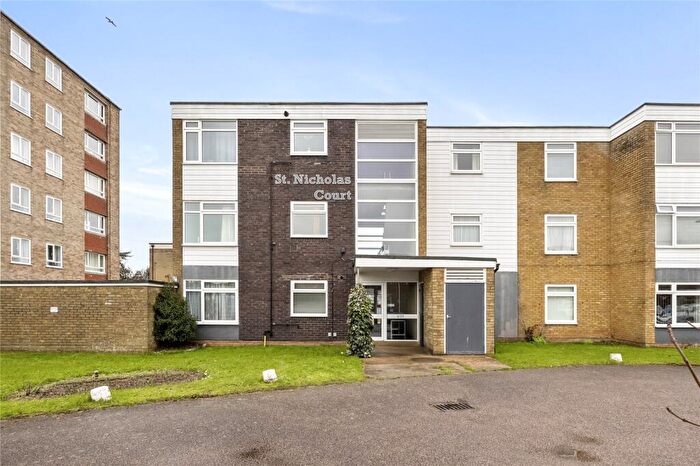
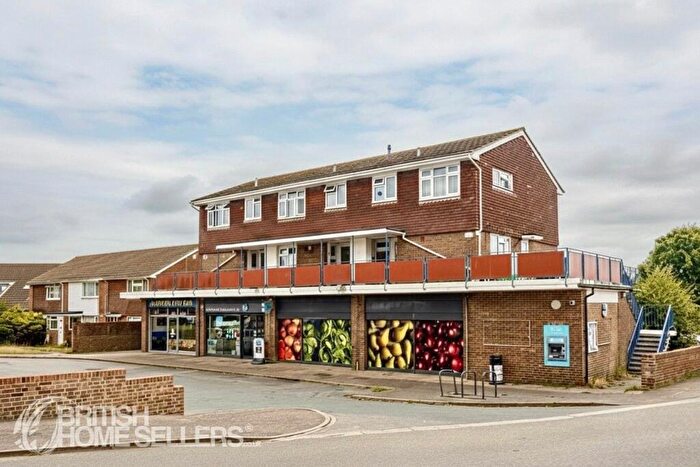
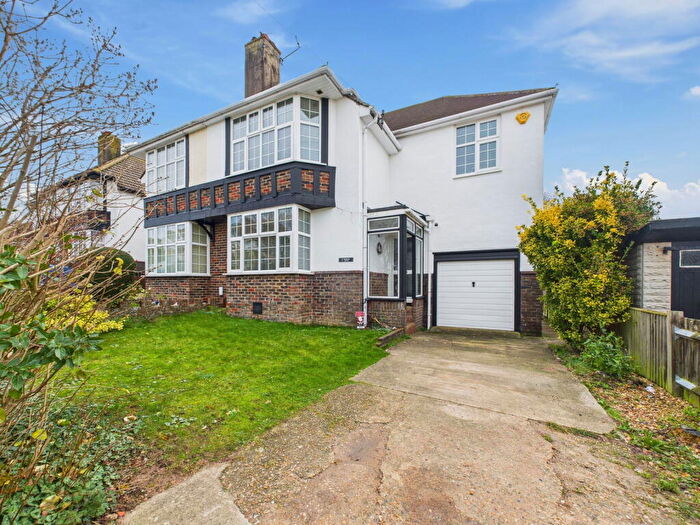
Properties for sale in Cokeham
Roads and Postcodes in Cokeham
Navigate through our locations to find the location of your next house in Cokeham, Lancing for sale or to rent.
| Streets | Postcodes |
|---|---|
| Abbey Road | BN15 0AB BN15 0AD |
| Abbotts View | BN15 0NG |
| Alandale Road | BN15 0JU |
| Arun Close | BN15 0EQ |
| Beeding Close | BN15 0HT |
| Berriedale Close | BN15 0JJ |
| Berriedale Drive | BN15 0LD BN15 0LE |
| Boundstone Lane | BN15 9QL BN15 9QR BN15 9QU |
| Bramber Close | BN15 0JA |
| Busticle Lane | BN15 0DJ BN15 0DL |
| Cokeham Gardens | BN15 9TB |
| Cokeham Lane | BN15 9UN BN15 9UP BN15 9UT BN15 9UW BN15 9WG |
| Cokeham Road | BN15 0AA BN15 0AE BN15 0AG BN15 0AH BN15 0AJ BN15 0AQ BN15 0JB BN15 0JD |
| Downlands Close | BN15 0JL |
| Downsmead | BN15 0NA |
| Edwin Close | BN15 9UU |
| Garden Close | BN15 9SZ |
| Grafton Gardens | BN15 9SP |
| Greentrees Close | BN15 9SX |
| Greentrees Crescent | BN15 9SR BN15 9ST BN15 9SY BN15 9TA |
| Halewick Close | BN15 0NF |
| Halewick Lane | BN15 0ND BN15 0NE |
| Hamilton Mews | BN15 0AL |
| Herbert Road | BN15 0JT |
| Highview | BN15 0QW |
| Hillbarn Avenue | BN15 0LR |
| Hillbarn Parade | BN15 0LH |
| Hillrise Avenue | BN15 0LS BN15 0LT BN15 0LU BN15 0LX BN15 0LZ |
| Hillside Road | BN15 0JY |
| Howard Road | BN15 0LP BN15 0LW |
| Inglecroft Court | BN15 0AN |
| Meadowview Road | BN15 0HU BN15 0HX BN15 0HZ BN15 0NB |
| Millfield | BN15 0DN BN15 0DW |
| Mountview Road | BN15 0JZ |
| Nelson Close | BN15 0LY |
| Northgate Close | BN15 9XA |
| Osborne Close | BN15 9UZ |
| Osborne Drive | BN15 9UY |
| Pende Close | BN15 0HP |
| Sedbury Road | BN15 0LL BN15 0LN |
| Steepdown Road | BN15 0LJ |
| Steyning Close | BN15 0HY |
| The Deneway | BN15 9SU |
| The Martlets | BN15 9SS |
| Trent Close | BN15 0EJ |
| Upper Boundstone Lane | BN15 0HR BN15 0HS BN15 9QZ |
| Upper Brighton Road | BN15 0JG BN15 0JN BN15 0JQ BN15 0JX BN15 0LB BN15 0LA |
| Valley Road | BN15 0JP BN15 0JR BN15 0JS |
| West Street | BN15 0DE |
| Western Road North | BN15 9UX |
Transport near Cokeham
-
Lancing Station
-
East Worthing Station
-
Worthing Station
-
Shoreham-By-Sea Station
-
West Worthing Station
- FAQ
- Price Paid By Year
- Property Type Price
Frequently asked questions about Cokeham
What is the average price for a property for sale in Cokeham?
The average price for a property for sale in Cokeham is £352,694. This amount is 3% higher than the average price in Lancing. There are 1,856 property listings for sale in Cokeham.
What streets have the most expensive properties for sale in Cokeham?
The streets with the most expensive properties for sale in Cokeham are Hillbarn Avenue at an average of £480,000, Cokeham Gardens at an average of £467,500 and Edwin Close at an average of £456,666.
What streets have the most affordable properties for sale in Cokeham?
The streets with the most affordable properties for sale in Cokeham are Millfield at an average of £130,000, Hamilton Mews at an average of £168,333 and West Street at an average of £172,000.
Which train stations are available in or near Cokeham?
Some of the train stations available in or near Cokeham are Lancing, East Worthing and Worthing.
Property Price Paid in Cokeham by Year
The average sold property price by year was:
| Year | Average Sold Price | Price Change |
Sold Properties
|
|---|---|---|---|
| 2025 | £355,699 | 2% |
54 Properties |
| 2024 | £347,736 | -2% |
57 Properties |
| 2023 | £354,882 | 1% |
55 Properties |
| 2022 | £352,047 | 6% |
84 Properties |
| 2021 | £329,928 | 16% |
77 Properties |
| 2020 | £277,328 | -2% |
66 Properties |
| 2019 | £283,689 | -3% |
67 Properties |
| 2018 | £291,960 | - |
75 Properties |
| 2017 | £291,909 | 11% |
61 Properties |
| 2016 | £258,769 | 2% |
82 Properties |
| 2015 | £254,158 | 15% |
72 Properties |
| 2014 | £216,510 | 8% |
79 Properties |
| 2013 | £200,127 | 0,2% |
68 Properties |
| 2012 | £199,689 | 4% |
84 Properties |
| 2011 | £192,500 | 7% |
75 Properties |
| 2010 | £179,295 | -0,3% |
52 Properties |
| 2009 | £179,827 | -11% |
64 Properties |
| 2008 | £200,082 | -1% |
47 Properties |
| 2007 | £202,972 | 8% |
127 Properties |
| 2006 | £186,748 | 12% |
111 Properties |
| 2005 | £164,275 | 0,5% |
98 Properties |
| 2004 | £163,525 | 9% |
95 Properties |
| 2003 | £148,118 | 10% |
95 Properties |
| 2002 | £133,194 | 22% |
117 Properties |
| 2001 | £104,092 | 13% |
114 Properties |
| 2000 | £90,241 | 10% |
107 Properties |
| 1999 | £81,438 | 15% |
113 Properties |
| 1998 | £69,575 | 12% |
102 Properties |
| 1997 | £61,026 | 11% |
100 Properties |
| 1996 | £54,452 | 6% |
108 Properties |
| 1995 | £51,296 | - |
72 Properties |
Property Price per Property Type in Cokeham
Here you can find historic sold price data in order to help with your property search.
The average Property Paid Price for specific property types in the last three years are:
| Property Type | Average Sold Price | Sold Properties |
|---|---|---|
| Semi Detached House | £375,635.00 | 87 Semi Detached Houses |
| Detached House | £440,260.00 | 25 Detached Houses |
| Terraced House | £325,675.00 | 37 Terraced Houses |
| Flat | £165,323.00 | 17 Flats |

