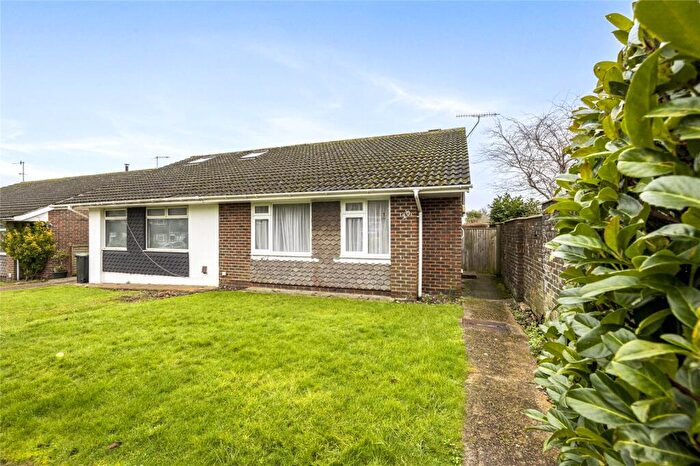
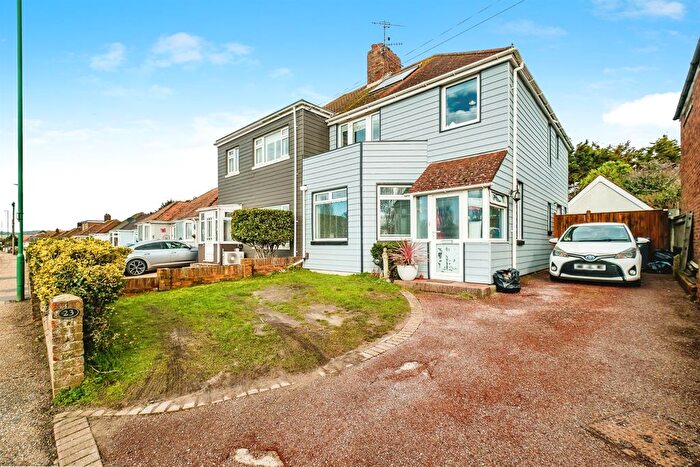
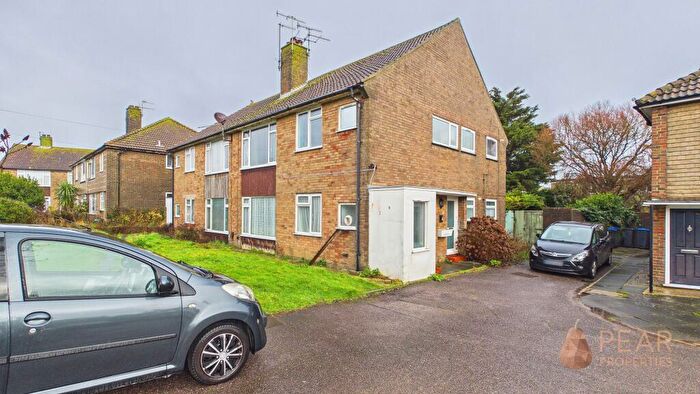
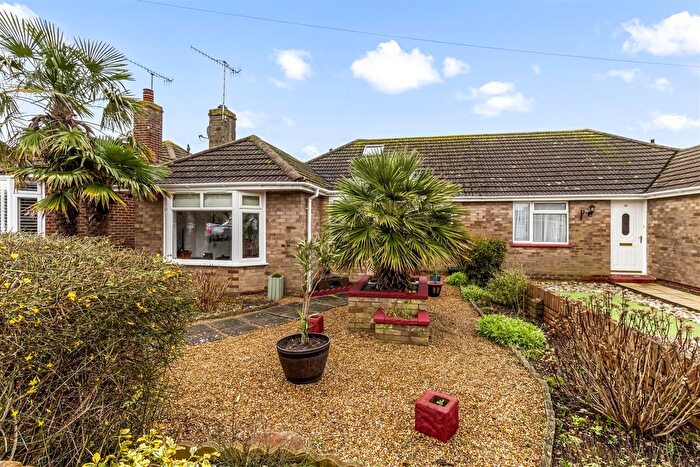
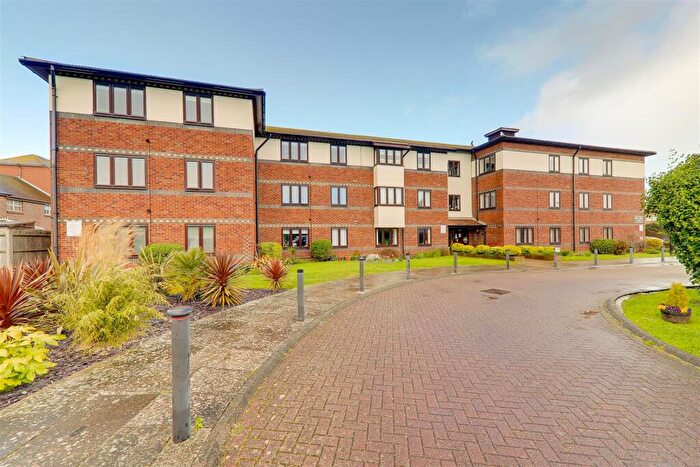
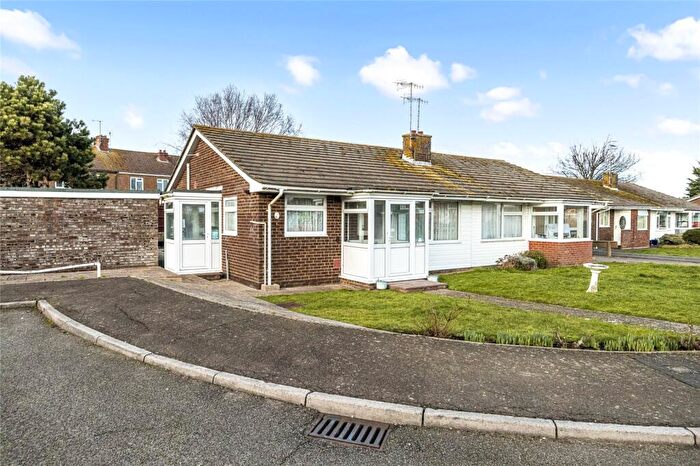
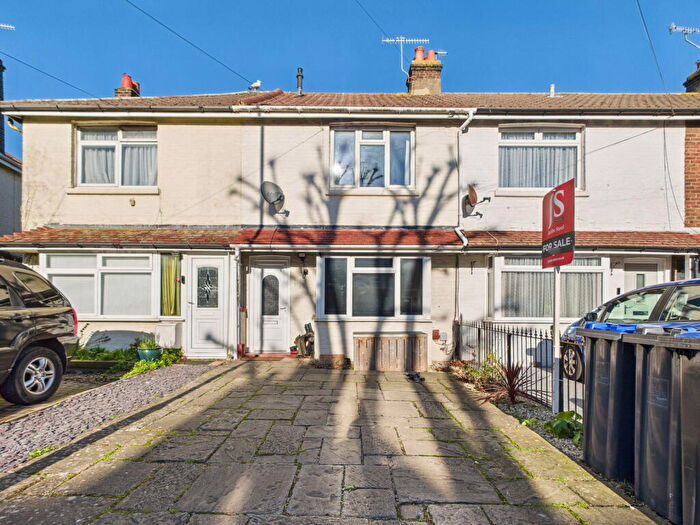
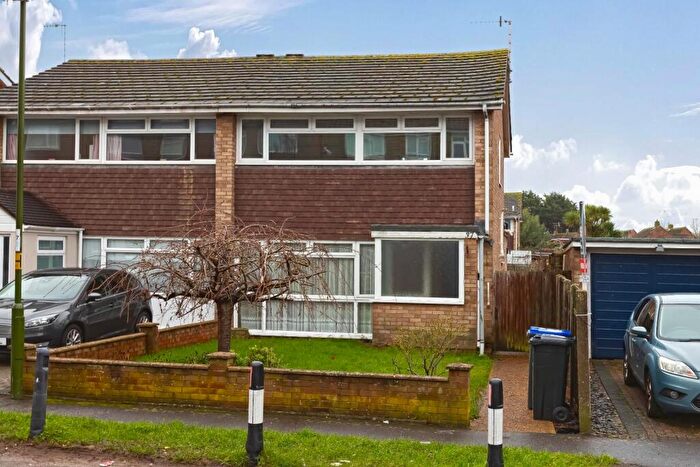
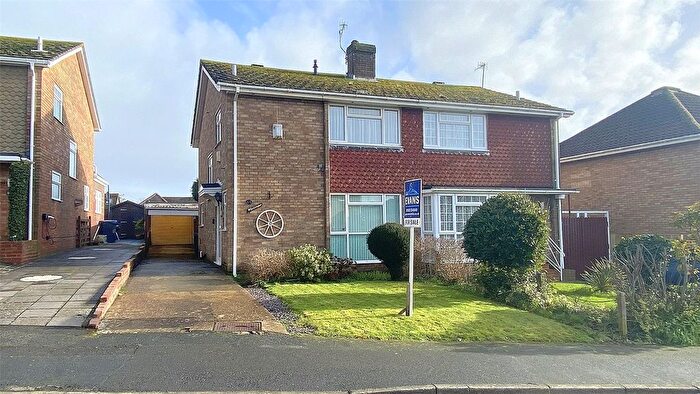
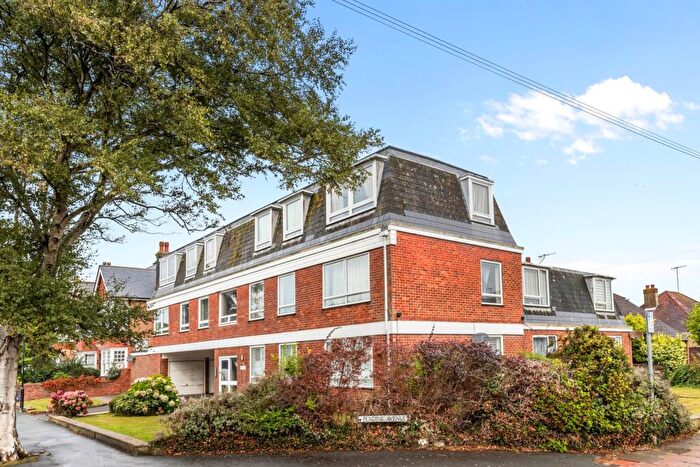
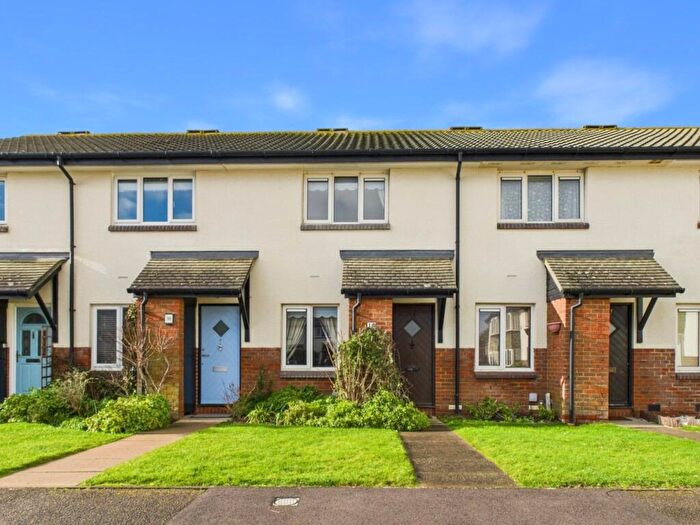
Houses for sale & to rent in Peverel, Lancing
House Prices in Peverel
Properties in Peverel have an average house price of £353,203.00 and had 175 Property Transactions within the last 3 years¹.
Peverel is an area in Lancing, West Sussex with 1,906 households², where the most expensive property was sold for £700,000.00.
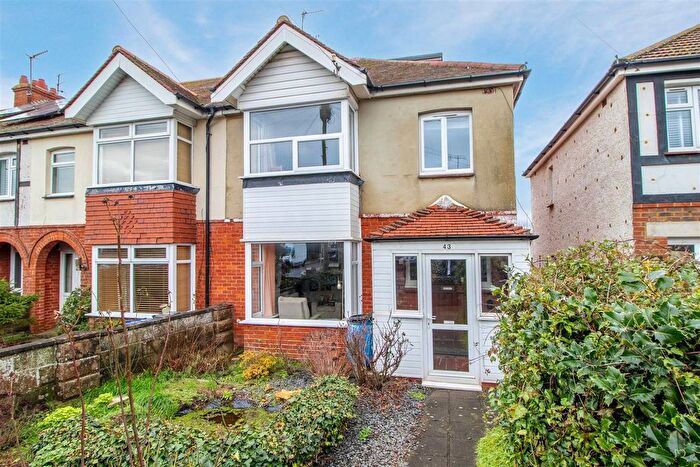
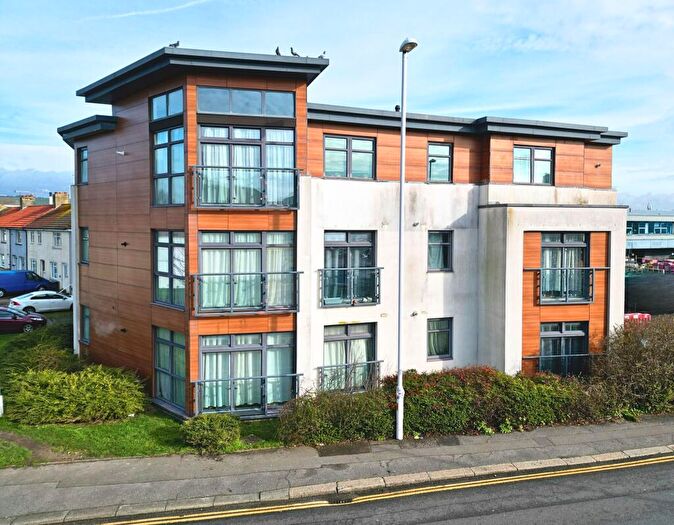
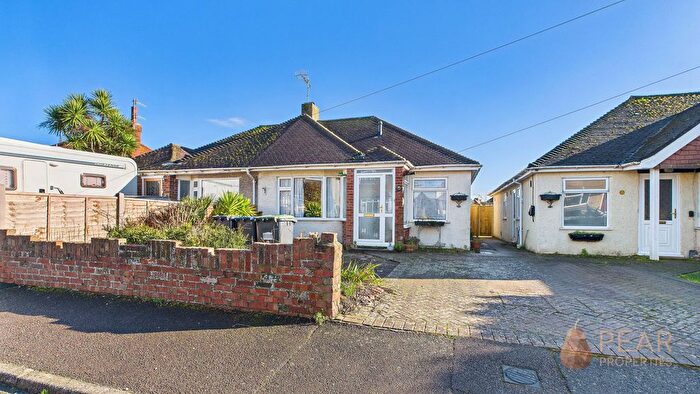
Properties for sale in Peverel
Roads and Postcodes in Peverel
Navigate through our locations to find the location of your next house in Peverel, Lancing for sale or to rent.
| Streets | Postcodes |
|---|---|
| Ambleside Road | BN15 9SE |
| Arnside Close | BN15 9TR |
| Avon Close | BN15 0BS BN15 0BW |
| Ball Tree Close | BN15 0FB |
| Blacksmiths Crescent | BN15 0BX BN15 0BY BN15 0BF |
| Bowness Avenue | BN15 9TS BN15 9TT |
| Burnside Crescent | BN15 9TJ BN15 9TN |
| Burry Cottages | BN15 0AT |
| Bushby Close | BN15 9JW |
| Busticle Lane | BN15 0DH |
| Carnforth Road | BN15 9RX BN15 9TG BN15 9TH BN15 9TQ |
| Church Lane | BN15 0AZ BN15 0BA |
| Cokeham Lane | BN15 9SG BN15 9SJ BN15 9SN BN15 9SQ BN15 9UR BN15 9SL |
| Commerce Way | BN15 8TA BN15 8UP |
| Commerce Way Business Park | BN15 8TQ |
| Coniston Close | BN15 9SA |
| Dankton Gardens | BN15 0DG BN15 0DR BN15 0DX |
| Dankton Lane | BN15 0EA BN15 0EE |
| Derwent Close | BN15 9TW |
| Edwards Terrace | BN15 0AS |
| Elizabeth Place | BN15 9UJ |
| Ennerdale Drive | BN15 9UH |
| Florlandia Close | BN15 0QP |
| Grafton Drive | BN15 9SW |
| Grasmere Avenue | BN15 9UQ |
| Hamble Road | BN15 0ES |
| Kelso Close | BN15 0DZ |
| Kendal Road | BN15 9SF |
| Langdale Close | BN15 9SD |
| Latimer Cottages | BN15 0AR |
| Loose Lane | BN15 0BG BN15 0BH BN15 0BL BN15 0DQ |
| Lotts Lane | BN15 9TX |
| Malthouse Close | BN15 0EF |
| Maple Walk | BN15 0DS |
| Maytree Close | BN15 0ER |
| New Gardens | BN15 0AW |
| Newmans Gardens | BN15 0BD |
| Peveril Close | BN15 0BP |
| Peveril Drive | BN15 0BJ |
| Priory Close | BN15 0EB |
| Rectory Farm Road | BN15 0DP BN15 0ED |
| Rectory Walk | BN15 0DU |
| Rogate Close | BN15 0DY |
| Roman Walk | BN15 0DF |
| Seadown Parade | BN15 9TP |
| Silverdale Drive | BN15 9RY BN15 9RZ BN15 9SB BN15 9SH |
| Southview Terrace | BN15 0AP |
| St Lukes Close | BN15 8SQ |
| St Marks Crescent | BN15 8SG BN15 8SH |
| St Marys Close | BN15 0AF |
| St Pauls Avenue | BN15 8SE BN15 8SF |
| St Peters Place | BN15 8SB |
| Street Barn | BN15 0GN |
| Sylvan Road | BN15 0BT BN15 0BN BN15 0GA BN15 0NQ |
| Test Road | BN15 0EG BN15 0EH BN15 0EL BN15 0EN BN15 0EP BN15 0EW |
| The Lawns | BN15 0DT |
| The Triangle | BN15 8RY |
| Thirlmere Crescent | BN15 9UE |
| Tower Road | BN15 9JL BN15 9JN BN15 9JJ |
| Tristram Close | BN15 0BQ |
| Ullswater Road | BN15 9UF BN15 9UG |
| Wayside | BN15 8SW |
| West Street | BN15 0AX BN15 0BB BN15 0BE BN15 0DA BN15 0DB BN15 0DD |
| Western Road | BN15 8RZ BN15 8SA BN15 8SD BN15 9TL BN15 9TU BN15 9TY BN15 9UA BN15 9UB BN15 9UD |
| Western Terrace | BN15 0AU |
| White Styles Road | BN15 0BU BN15 0BZ |
| BN15 0AY |
Transport near Peverel
- FAQ
- Price Paid By Year
- Property Type Price
Frequently asked questions about Peverel
What is the average price for a property for sale in Peverel?
The average price for a property for sale in Peverel is £353,203. This amount is 3% higher than the average price in Lancing. There are 5,036 property listings for sale in Peverel.
What streets have the most expensive properties for sale in Peverel?
The streets with the most expensive properties for sale in Peverel are Church Lane at an average of £635,000, Priory Close at an average of £545,000 and Kelso Close at an average of £520,000.
What streets have the most affordable properties for sale in Peverel?
The streets with the most affordable properties for sale in Peverel are White Styles Road at an average of £165,000, Sylvan Road at an average of £197,833 and Burry Cottages at an average of £260,250.
Which train stations are available in or near Peverel?
Some of the train stations available in or near Peverel are East Worthing, Lancing and Worthing.
Property Price Paid in Peverel by Year
The average sold property price by year was:
| Year | Average Sold Price | Price Change |
Sold Properties
|
|---|---|---|---|
| 2025 | £336,774 | -6% |
54 Properties |
| 2024 | £357,269 | -2% |
64 Properties |
| 2023 | £364,201 | -5% |
57 Properties |
| 2022 | £383,428 | 14% |
63 Properties |
| 2021 | £330,753 | 7% |
96 Properties |
| 2020 | £306,452 | 5% |
63 Properties |
| 2019 | £292,096 | 3% |
57 Properties |
| 2018 | £282,455 | -17% |
56 Properties |
| 2017 | £329,366 | 17% |
64 Properties |
| 2016 | £273,145 | 7% |
79 Properties |
| 2015 | £254,176 | 3% |
62 Properties |
| 2014 | £247,357 | 14% |
90 Properties |
| 2013 | £211,963 | 0,4% |
66 Properties |
| 2012 | £211,108 | 11% |
63 Properties |
| 2011 | £188,482 | -9% |
46 Properties |
| 2010 | £205,638 | 10% |
54 Properties |
| 2009 | £184,139 | -7% |
73 Properties |
| 2008 | £196,369 | -6% |
43 Properties |
| 2007 | £207,860 | 8% |
100 Properties |
| 2006 | £190,808 | 7% |
128 Properties |
| 2005 | £176,985 | 2% |
77 Properties |
| 2004 | £173,228 | 12% |
93 Properties |
| 2003 | £151,637 | 12% |
105 Properties |
| 2002 | £132,763 | 20% |
128 Properties |
| 2001 | £106,810 | 12% |
103 Properties |
| 2000 | £93,524 | 7% |
75 Properties |
| 1999 | £87,275 | 16% |
124 Properties |
| 1998 | £73,492 | 5% |
77 Properties |
| 1997 | £69,965 | 17% |
92 Properties |
| 1996 | £58,381 | -4% |
104 Properties |
| 1995 | £60,873 | - |
64 Properties |
Property Price per Property Type in Peverel
Here you can find historic sold price data in order to help with your property search.
The average Property Paid Price for specific property types in the last three years are:
| Property Type | Average Sold Price | Sold Properties |
|---|---|---|
| Semi Detached House | £376,350.00 | 72 Semi Detached Houses |
| Detached House | £462,522.00 | 30 Detached Houses |
| Terraced House | £318,243.00 | 54 Terraced Houses |
| Flat | £192,236.00 | 19 Flats |

