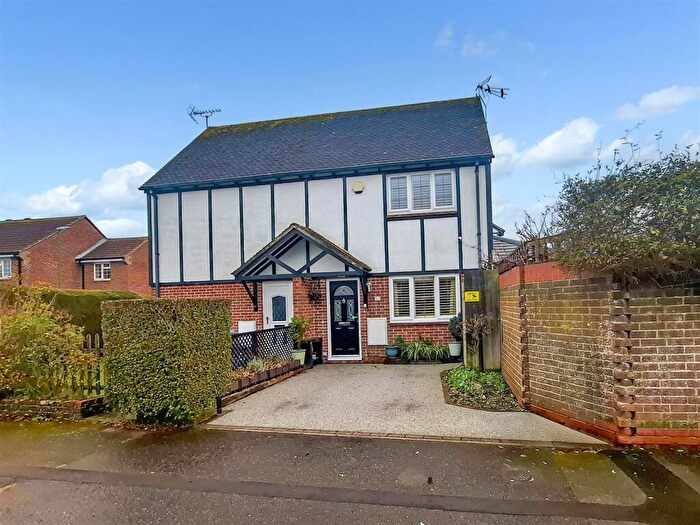
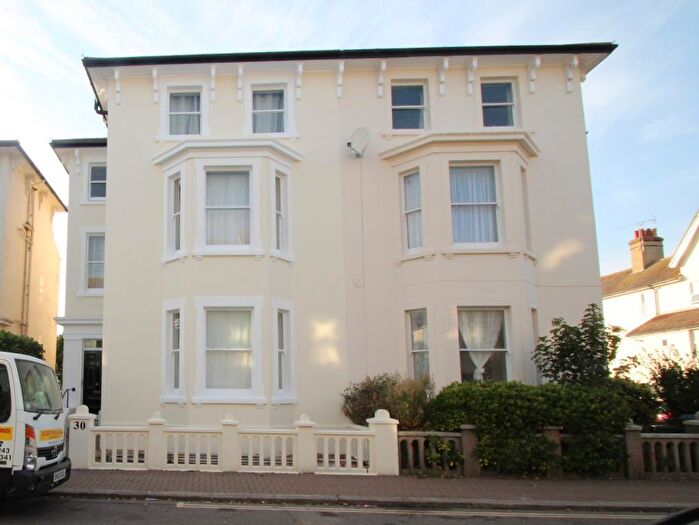
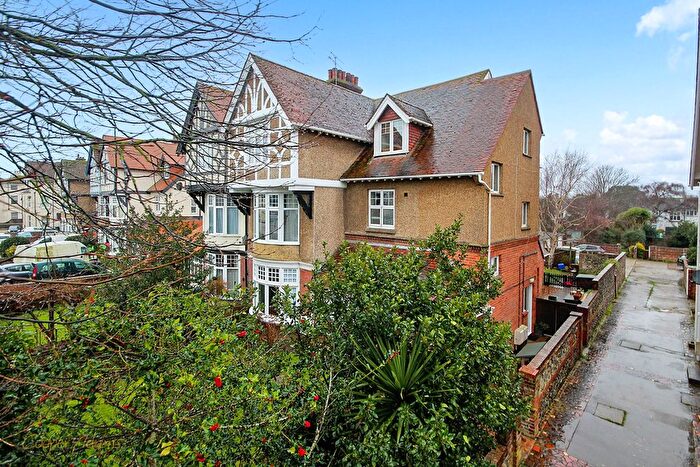
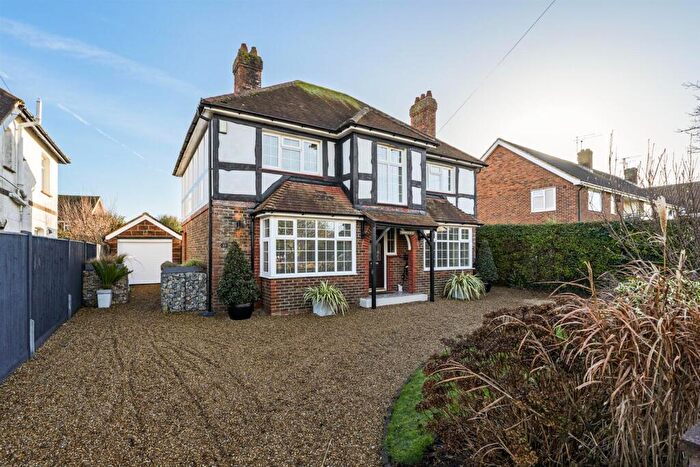
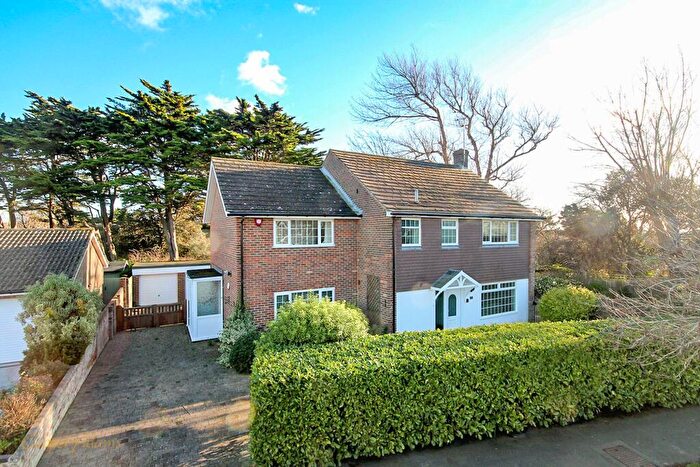
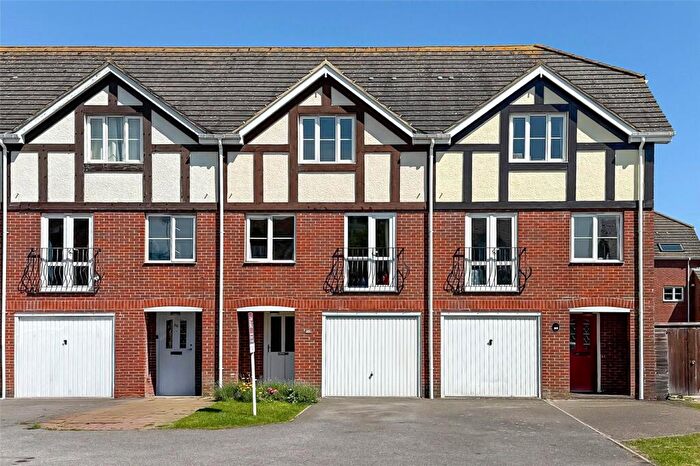
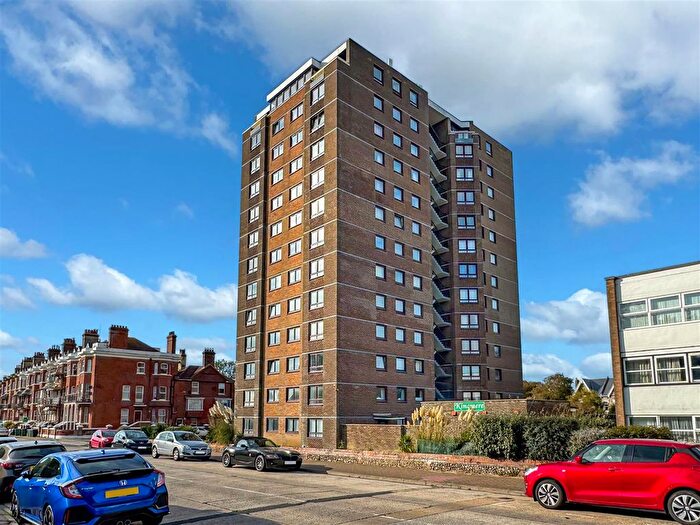
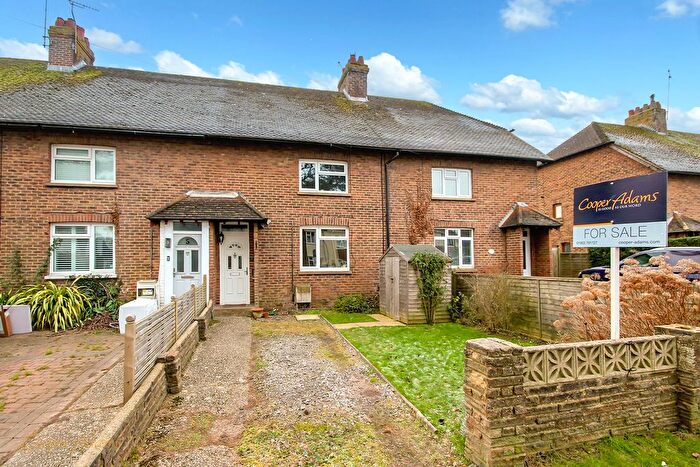
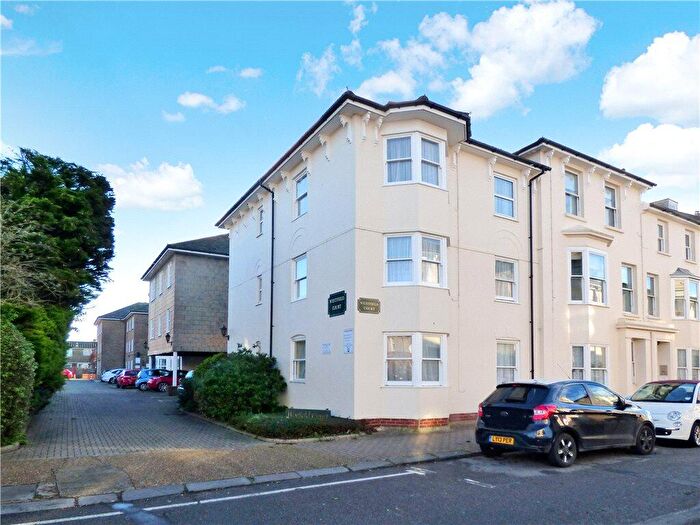
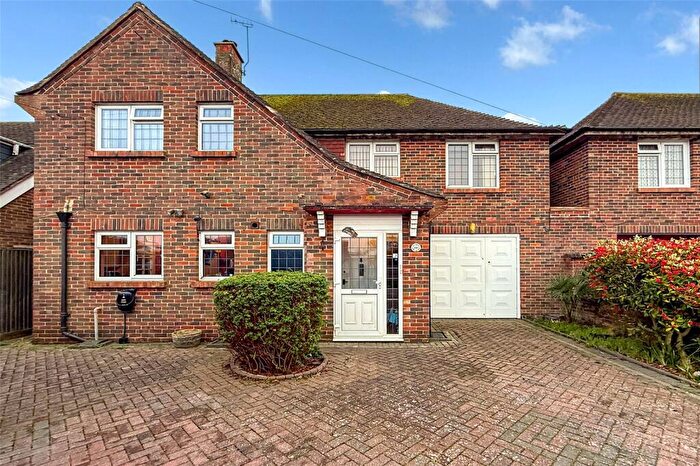
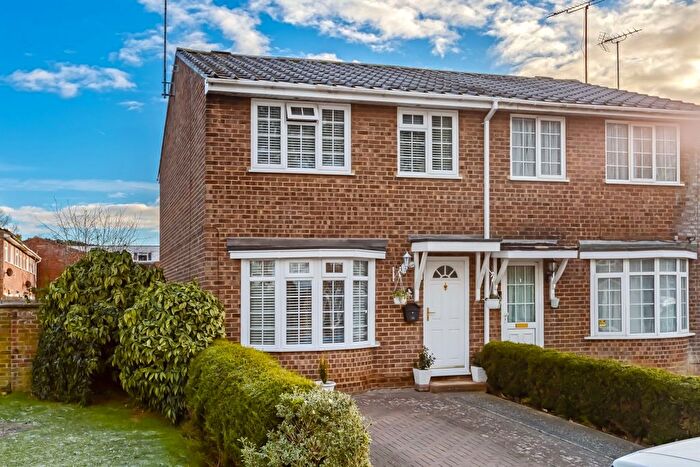
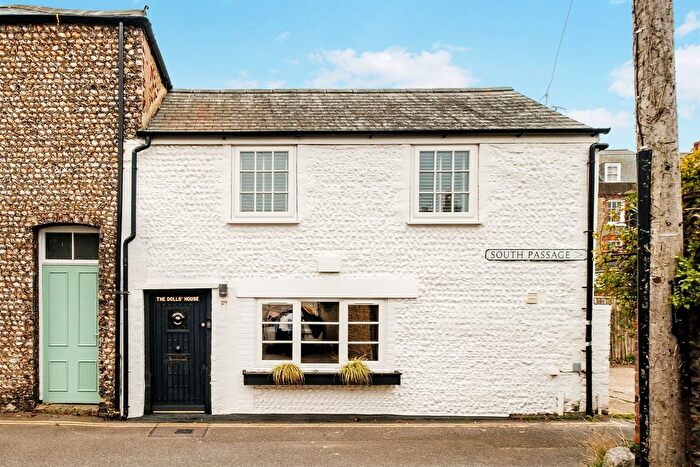
Houses for sale & to rent in Beach, Littlehampton
House Prices in Beach
Properties in Beach have an average house price of £325,703.00 and had 287 Property Transactions within the last 3 years¹.
Beach is an area in Littlehampton, West Sussex with 2,212 households², where the most expensive property was sold for £1,170,000.00.
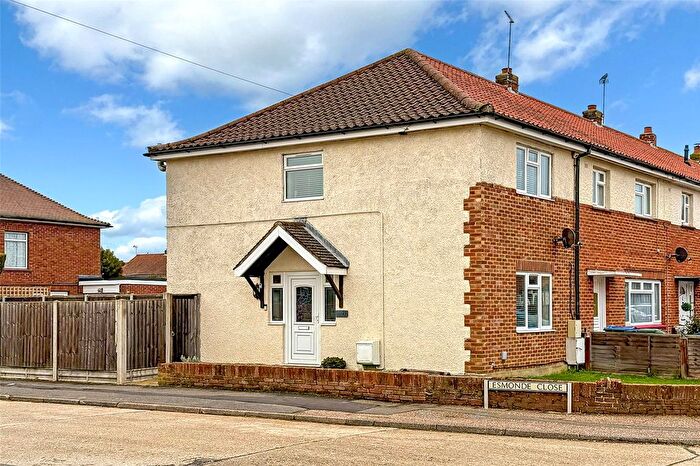
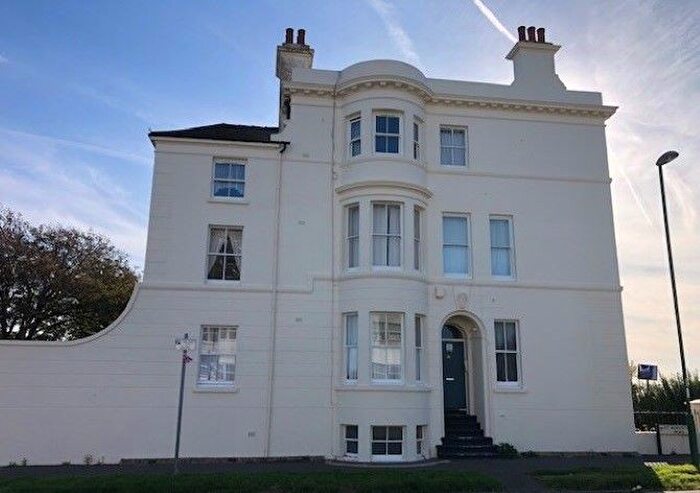
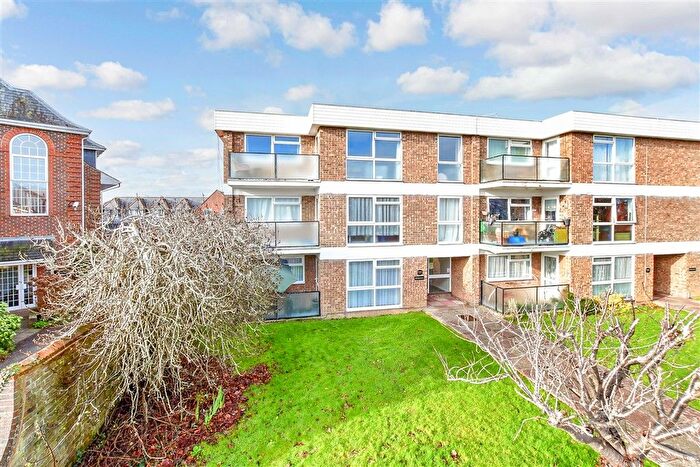
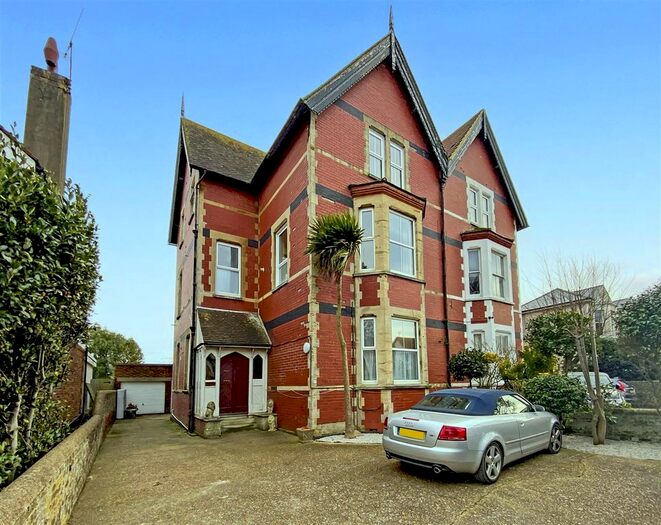
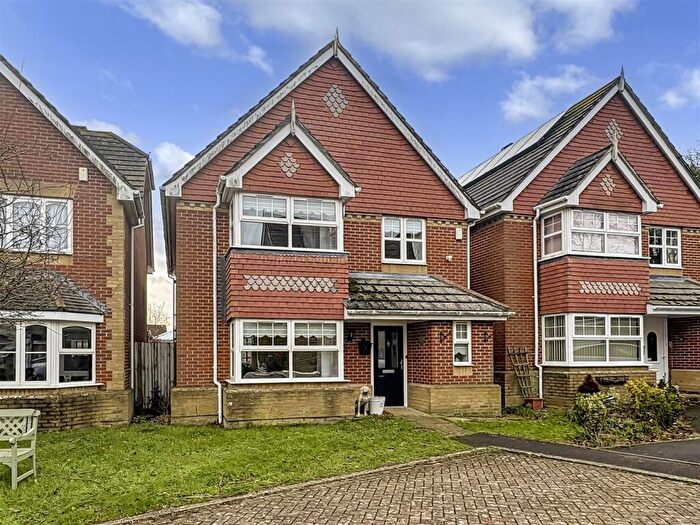
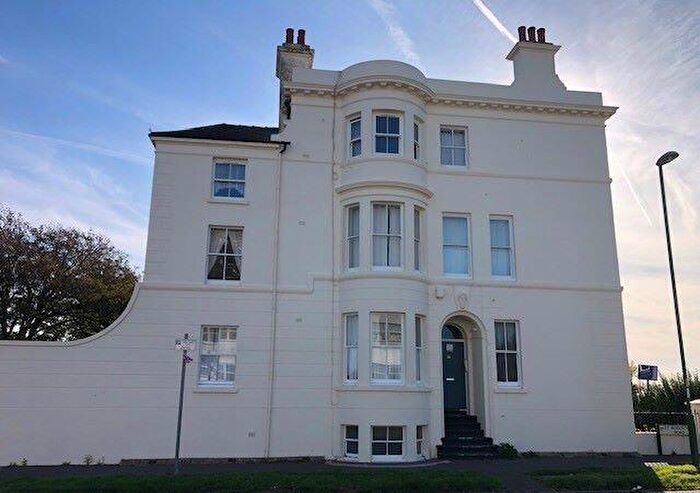
Properties for sale in Beach
Roads and Postcodes in Beach
Navigate through our locations to find the location of your next house in Beach, Littlehampton for sale or to rent.
| Streets | Postcodes |
|---|---|
| Beach Crescent | BN17 5NT |
| Beaumont Park | BN17 6PE BN17 6PF BN17 6PH BN17 6RF |
| Berry Lane | BN17 5HD |
| East Bank Walk | BN17 6PT |
| Esher Drive | BN17 6AA |
| Fairlead | BN17 6QZ |
| Fairway | BN17 6PY |
| Finisterre Way | BN17 6RA |
| Fishers Close | BN17 6PX |
| Hendon Avenue | BN16 2LX BN16 2NB |
| Horsham Road | BN17 6BU BN17 6BX |
| Humber Close | BN17 6RB |
| Ketch Road | BN17 6RE |
| Land Associated With | BN17 5PB |
| Leeward Road | BN17 6PG BN17 6PQ |
| Lundy Close | BN17 6NX |
| Malin Road | BN17 6NN |
| Meadow Way | BN17 6BL BN17 6BN BN17 6BW |
| Middle Mead | BN17 6QH |
| Neptune Way | BN17 6NY |
| Norfolk Gardens | BN17 5PE BN17 5PF |
| Norfolk Mews | BN17 5PS |
| Norfolk Place | BN17 5PD |
| Norfolk Road | BN17 5AQ BN17 5HB BN17 5HE BN17 5PL BN17 5PN BN17 5PW |
| North Place | BN17 5NS |
| Parkside Avenue | BN17 6BG BN17 6BJ BN17 6BQ |
| Reef Close | BN17 6QG |
| Sea Road | BN16 2NG BN16 2LZ BN16 2NA BN17 5GB BN17 5TJ |
| Seagate Walk | BN17 6PU |
| Selborne Road | BN17 5LZ BN17 5NN BN17 5NR BN17 5NW |
| Shannon Close | BN17 6PR |
| Shelley Lodge | BN17 5HQ |
| Short Furlong | BN17 6NG |
| South Passage | BN17 5PJ |
| South Terrace | BN17 5NU BN17 5NX BN17 5NZ BN17 5PA BN17 5PR |
| Southfields Road | BN17 6AE BN17 6PA BN17 6PB BN17 6PD |
| Southway | BN17 6QW |
| Spinnaker Close | BN17 6QJ |
| St Augustine Road | BN17 5NG |
| St Floras Close | BN17 6UA |
| St Floras Road | BN17 6BA BN17 6BB BN17 6BD BN17 6BE BN17 6BH BN17 6BF |
| St Winefrides Road | BN17 5HA BN17 5LY BN17 5NL |
| Starboard Walk | BN17 6QL |
| Sternway | BN17 6PJ |
| Thames Close | BN17 6PZ |
| The Blatchen | BN17 5HF |
| The Cape | BN17 6PL |
| The Chine | BN17 6QQ |
| The Cloisters | BN17 5ST |
| The Estuary | BN17 6NE BN17 6NF |
| The Haven | BN17 6NS BN17 6NT BN17 6NU |
| The Hooe | BN17 6PS |
| The Mole | BN17 6PN |
| The Old Warehouse Mews | BN17 5GE |
| The Whapple | BN17 6QN |
| The Winter Knoll | BN17 6NB BN17 6ND BN17 6NQ |
| Tideway | BN17 6PP BN17 6QT BN17 6QU |
| Trinity Way | BN17 5SR BN17 5SS |
| West Head | BN17 6QP |
| Western Road | BN17 5NP BN17 5PG BN17 5PH |
| White Horses Way | BN17 6NP |
| Whitehorses Way | BN17 6NH BN17 6NJ BN17 6NL BN17 6NR |
| Woodlands Road | BN17 5PP |
Transport near Beach
- FAQ
- Price Paid By Year
- Property Type Price
Frequently asked questions about Beach
What is the average price for a property for sale in Beach?
The average price for a property for sale in Beach is £325,703. This amount is 15% lower than the average price in Littlehampton. There are 1,698 property listings for sale in Beach.
What streets have the most expensive properties for sale in Beach?
The streets with the most expensive properties for sale in Beach are Tideway at an average of £562,500, Southway at an average of £547,357 and Reef Close at an average of £543,500.
What streets have the most affordable properties for sale in Beach?
The streets with the most affordable properties for sale in Beach are St Augustine Road at an average of £75,500, South Terrace at an average of £151,591 and Norfolk Road at an average of £186,384.
Which train stations are available in or near Beach?
Some of the train stations available in or near Beach are Littlehampton, Angmering and Ford.
Property Price Paid in Beach by Year
The average sold property price by year was:
| Year | Average Sold Price | Price Change |
Sold Properties
|
|---|---|---|---|
| 2025 | £353,585 | 10% |
49 Properties |
| 2024 | £318,603 | 2% |
74 Properties |
| 2023 | £310,658 | -6% |
72 Properties |
| 2022 | £328,339 | 10% |
92 Properties |
| 2021 | £296,918 | 5% |
104 Properties |
| 2020 | £282,840 | 1% |
86 Properties |
| 2019 | £281,122 | 3% |
87 Properties |
| 2018 | £273,490 | - |
120 Properties |
| 2017 | £273,584 | 13% |
112 Properties |
| 2016 | £238,965 | 5% |
105 Properties |
| 2015 | £227,182 | 4% |
102 Properties |
| 2014 | £218,905 | 13% |
101 Properties |
| 2013 | £190,715 | -2% |
104 Properties |
| 2012 | £193,651 | -4% |
88 Properties |
| 2011 | £201,153 | -3% |
82 Properties |
| 2010 | £207,740 | 19% |
86 Properties |
| 2009 | £167,856 | -16% |
90 Properties |
| 2008 | £195,481 | -1% |
73 Properties |
| 2007 | £198,231 | 11% |
148 Properties |
| 2006 | £176,822 | -6% |
185 Properties |
| 2005 | £187,027 | 5% |
109 Properties |
| 2004 | £178,410 | 18% |
163 Properties |
| 2003 | £146,413 | 18% |
148 Properties |
| 2002 | £120,658 | 8% |
185 Properties |
| 2001 | £110,776 | 19% |
178 Properties |
| 2000 | £90,265 | 10% |
142 Properties |
| 1999 | £81,318 | -3% |
168 Properties |
| 1998 | £83,541 | 4% |
201 Properties |
| 1997 | £80,022 | 30% |
201 Properties |
| 1996 | £56,214 | -5% |
150 Properties |
| 1995 | £58,924 | - |
106 Properties |
Property Price per Property Type in Beach
Here you can find historic sold price data in order to help with your property search.
The average Property Paid Price for specific property types in the last three years are:
| Property Type | Average Sold Price | Sold Properties |
|---|---|---|
| Semi Detached House | £392,141.00 | 72 Semi Detached Houses |
| Detached House | £508,639.00 | 53 Detached Houses |
| Terraced House | £322,361.00 | 57 Terraced Houses |
| Flat | £189,621.00 | 105 Flats |

