
Houses for sale & to rent in Littlehampton, West Sussex
House Prices in Littlehampton
Properties in Littlehampton have an average house price of £380k and had 3,075 Property Transactions within the last 3 years.¹
Littlehampton is an area in West Sussex with 25,605 households², where the most expensive property was sold for £5.15M.
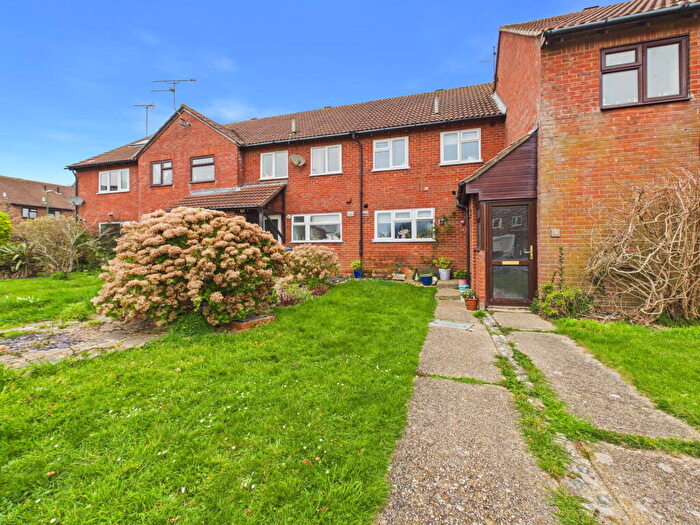
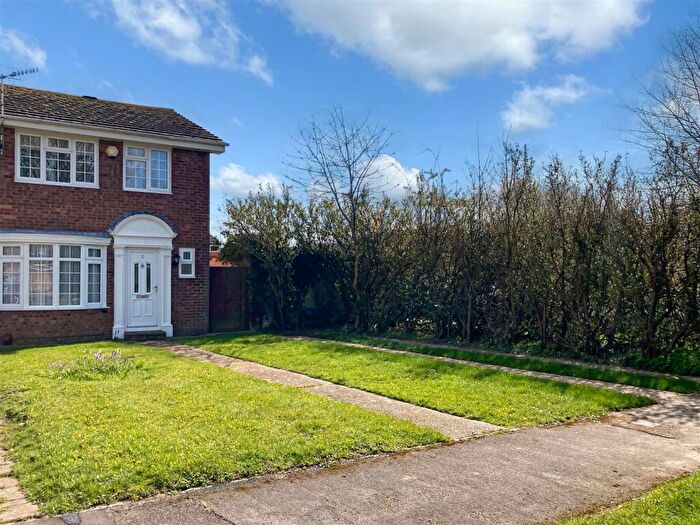
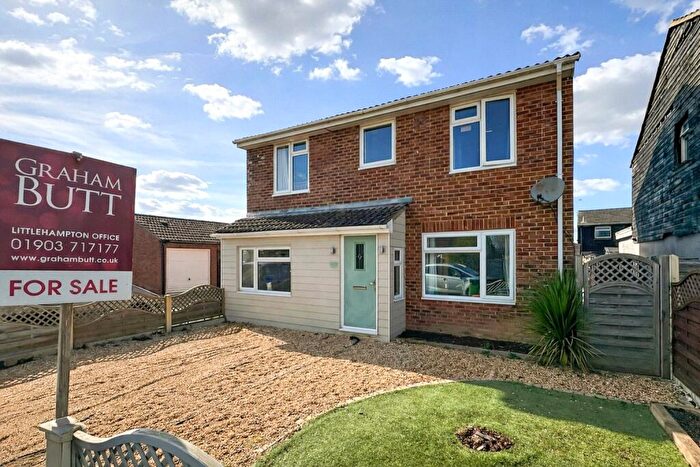
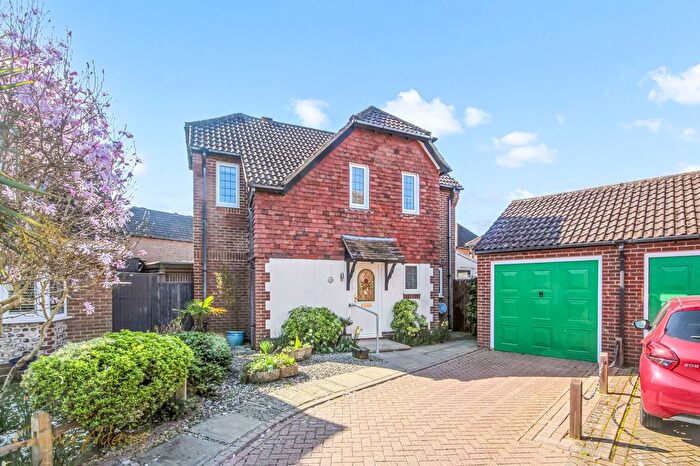
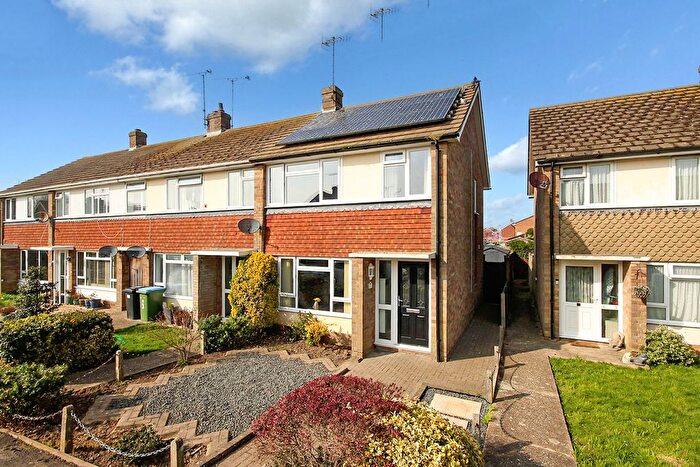
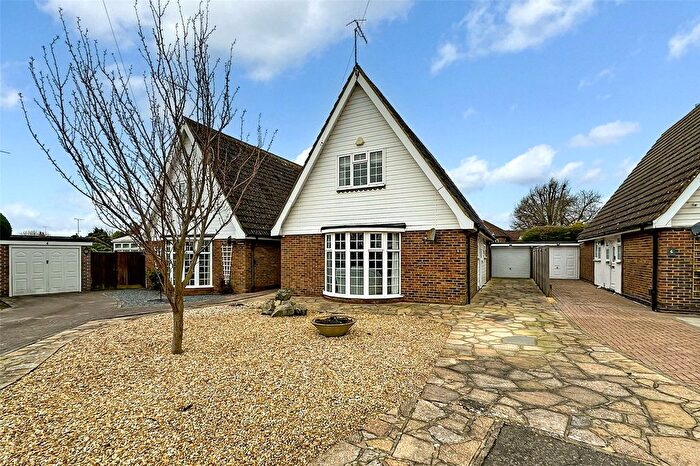
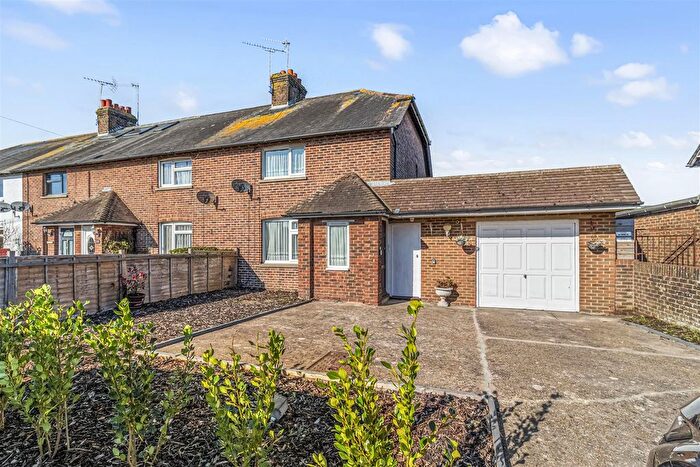
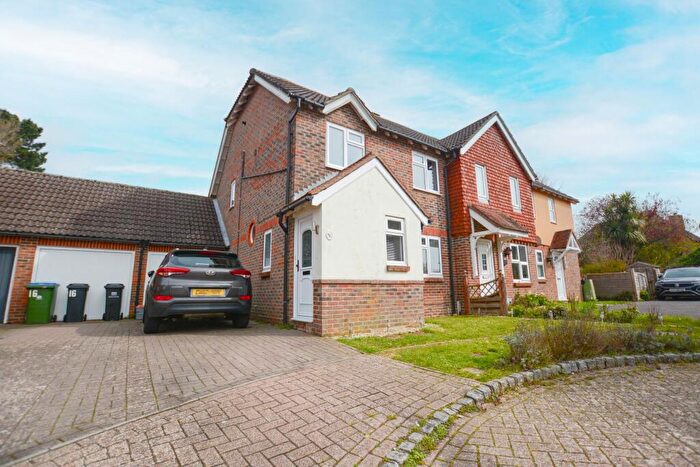
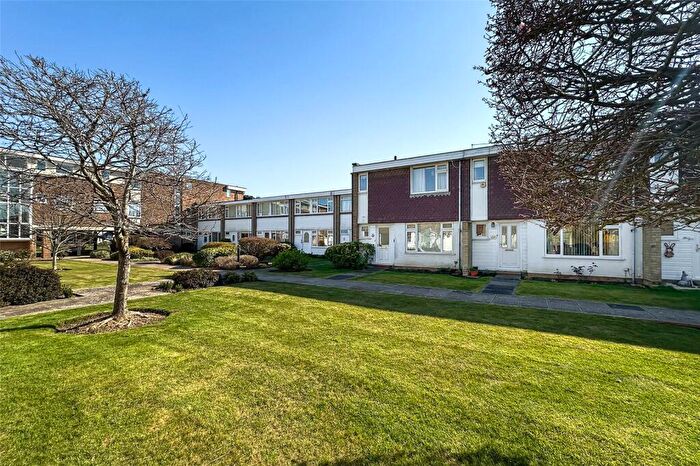
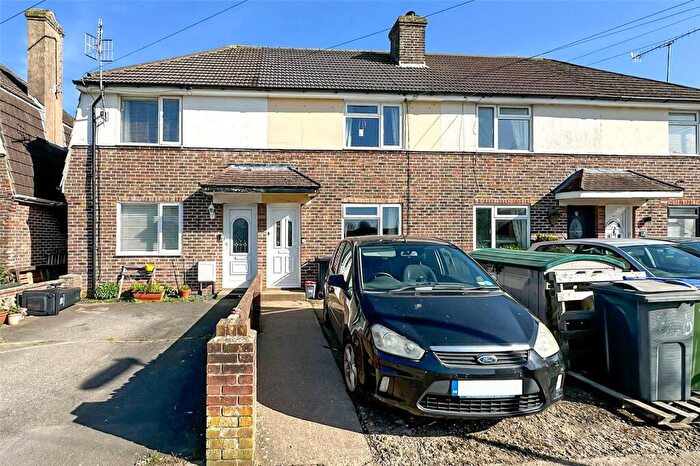
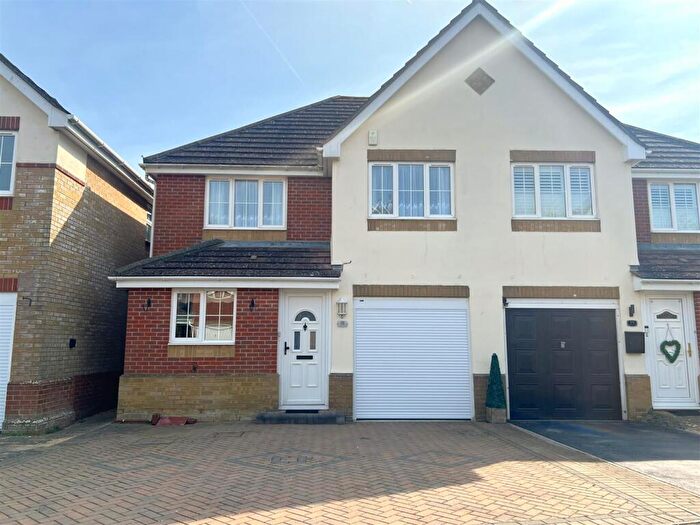
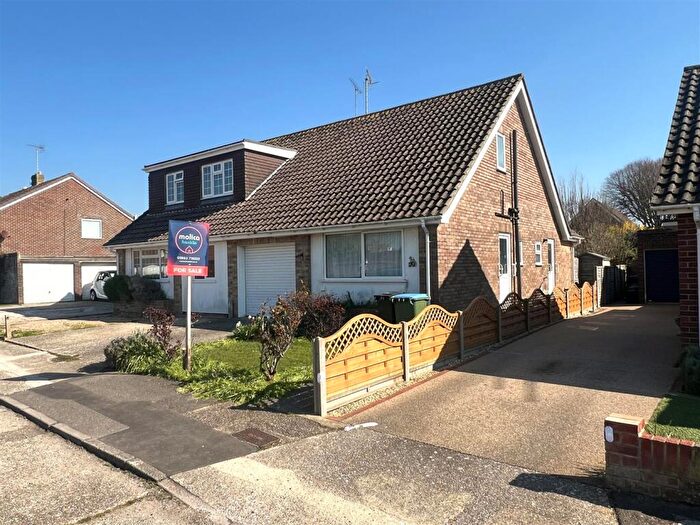
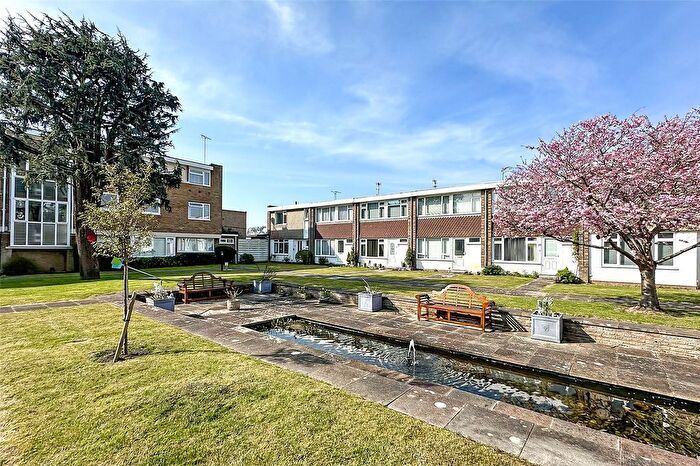
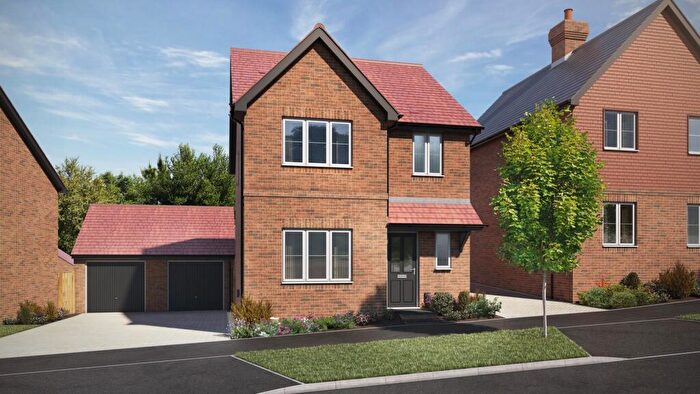
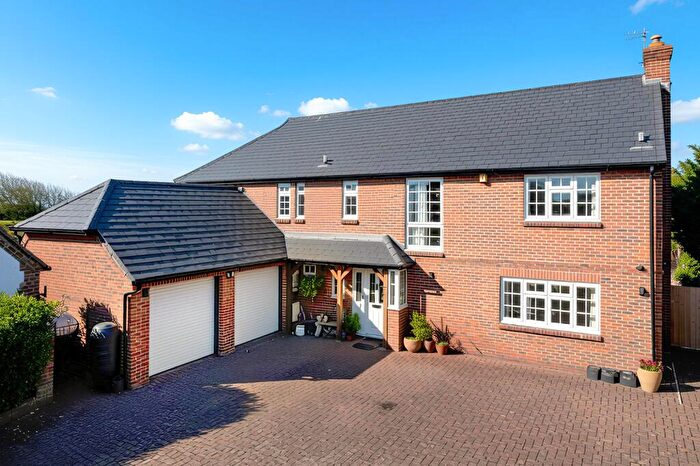
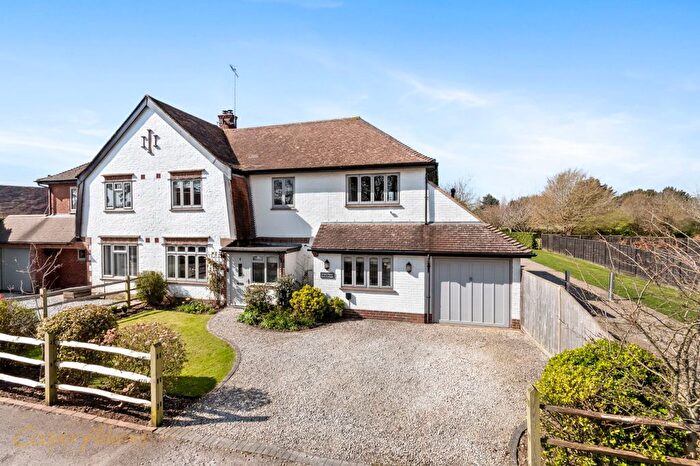
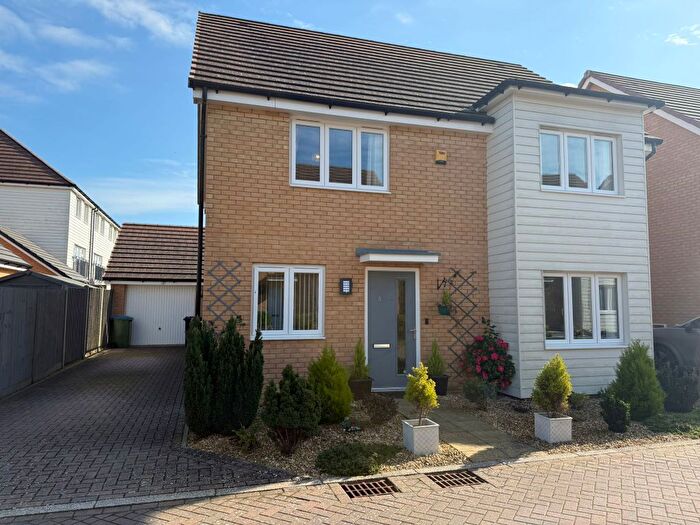
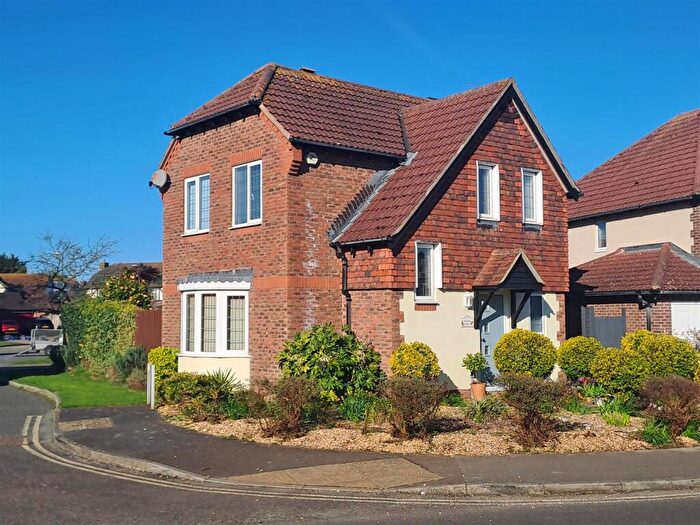
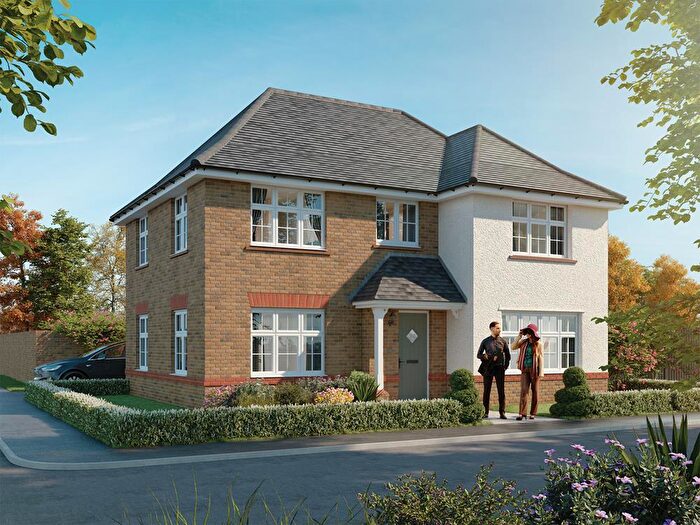
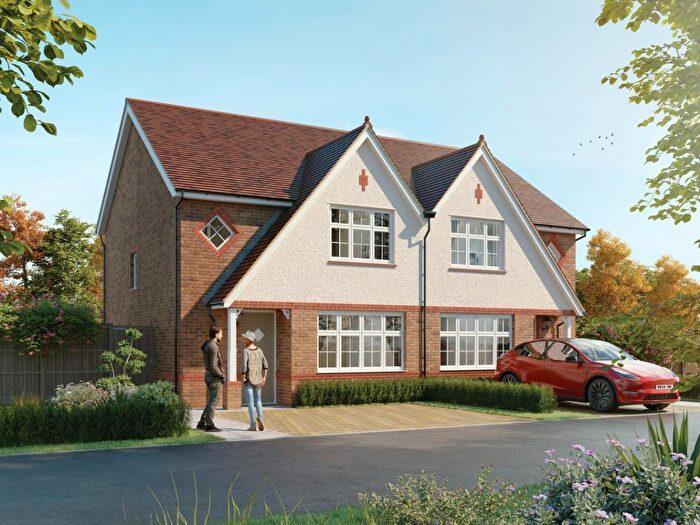
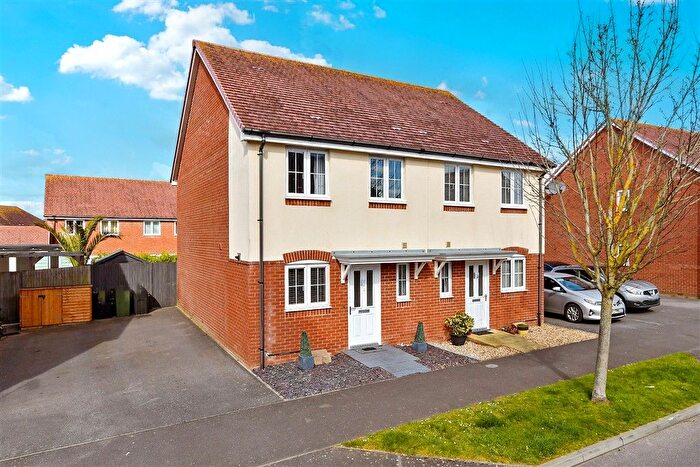
Properties for sale in Littlehampton

![]()
If you are looking to sell your house, let it out, or receive a property valuation, an expert can help you.
Click the button below to get started.
Neighbourhoods in Littlehampton
Navigate through our locations to find the location of your next house in Littlehampton, West Sussex for sale or to rent.
Transport in Littlehampton
Please see below transportation links in this area:

- FAQ
- Price Paid By Year
- Property Type Price
Frequently asked questions about Littlehampton
What is the average price for a property for sale in Littlehampton?
The average price for a property for sale in Littlehampton is £379,851. This amount is 10% lower than the average price in West Sussex. There are 8,308 property listings for sale in Littlehampton.
What locations have the most expensive properties for sale in Littlehampton?
The locations with the most expensive properties for sale in Littlehampton are Arundel at an average of £750,625, East Preston With Kingston at an average of £591,822 and Yapton at an average of £537,500.
What locations have the most affordable properties for sale in Littlehampton?
The locations with the most affordable properties for sale in Littlehampton are River at an average of £226,531, Ham at an average of £246,506 and Wick With Toddington at an average of £302,726.
Which train stations are available in or near Littlehampton?
Some of the train stations available in or near Littlehampton are Angmering, Littlehampton and Arundel.
Property Price Paid in Littlehampton by Year
The average sold property price by year was:
| Year | Average Sold Price | Price Change |
Sold Properties
|
|---|---|---|---|
| 2026 | £421,065 | 9% |
23 Properties |
| 2025 | £381,446 | 1% |
1,015 Properties |
| 2024 | £376,436 | -1% |
1,043 Properties |
| 2023 | £380,852 | -2% |
994 Properties |
| 2022 | £388,672 | 6% |
1,239 Properties |
| 2021 | £365,212 | 9% |
1,479 Properties |
| 2020 | £330,722 | 6% |
1,169 Properties |
| 2019 | £309,379 | -6% |
1,222 Properties |
| 2018 | £328,864 | 7% |
1,420 Properties |
| 2017 | £304,914 | 4% |
1,532 Properties |
| 2016 | £293,833 | 8% |
1,471 Properties |
| 2015 | £270,884 | 5% |
1,527 Properties |
| 2014 | £257,387 | 6% |
1,382 Properties |
| 2013 | £241,242 | 1% |
1,168 Properties |
| 2012 | £238,890 | 6% |
1,154 Properties |
| 2011 | £223,830 | -4% |
1,025 Properties |
| 2010 | £232,500 | 12% |
1,045 Properties |
| 2009 | £205,632 | -14% |
1,104 Properties |
| 2008 | £235,026 | 2% |
952 Properties |
| 2007 | £231,283 | 8% |
1,996 Properties |
| 2006 | £212,098 | 5% |
1,892 Properties |
| 2005 | £201,031 | 1% |
1,376 Properties |
| 2004 | £199,673 | 8% |
1,859 Properties |
| 2003 | £184,596 | 15% |
2,000 Properties |
| 2002 | £157,204 | 19% |
2,131 Properties |
| 2001 | £127,645 | 11% |
1,903 Properties |
| 2000 | £113,229 | 17% |
1,693 Properties |
| 1999 | £94,407 | 9% |
1,874 Properties |
| 1998 | £85,723 | 10% |
1,690 Properties |
| 1997 | £77,497 | 13% |
1,894 Properties |
| 1996 | £67,114 | 4% |
1,594 Properties |
| 1995 | £64,159 | - |
1,225 Properties |
Property Price per Property Type in Littlehampton
Here you can find historic sold price data in order to help with your property search.
The average Property Paid Price for specific property types in the last three years are:
| Property Type | Average Sold Price | Sold Properties |
|---|---|---|
| Semi Detached House | £368,565.00 | 650 Semi Detached Houses |
| Terraced House | £309,270.00 | 839 Terraced Houses |
| Detached House | £626,195.00 | 813 Detached Houses |
| Flat | £206,856.00 | 773 Flats |