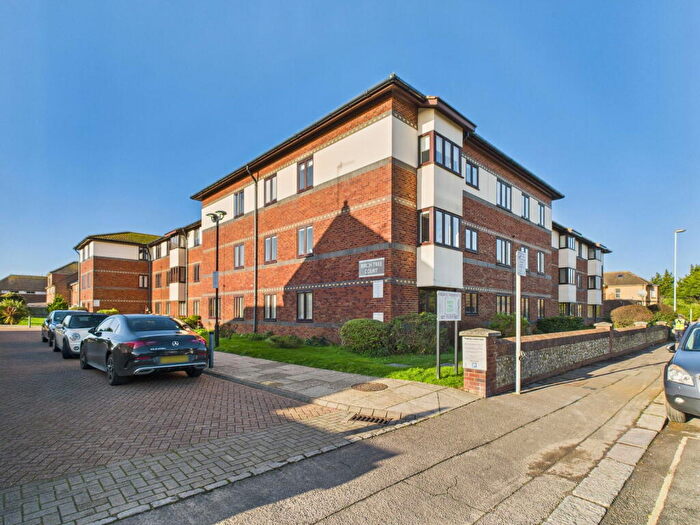
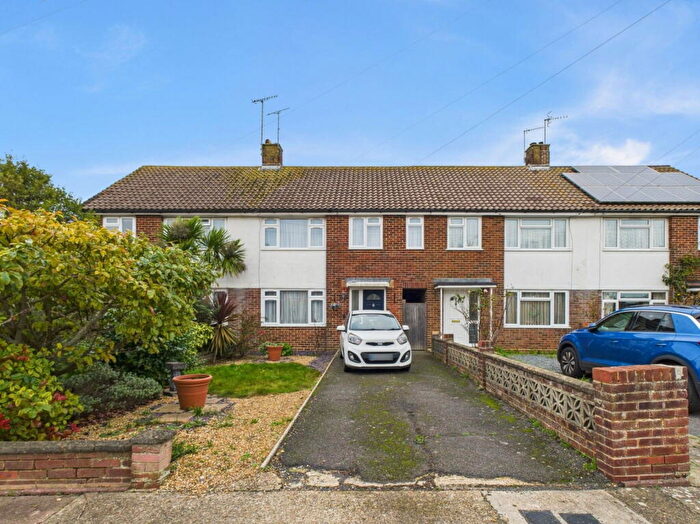
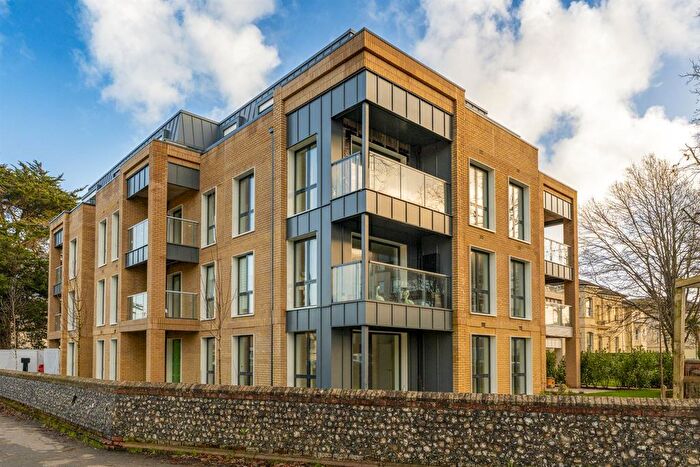
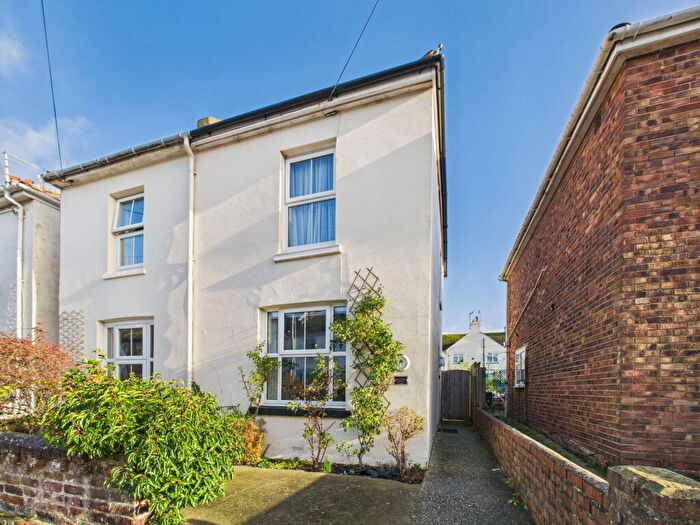
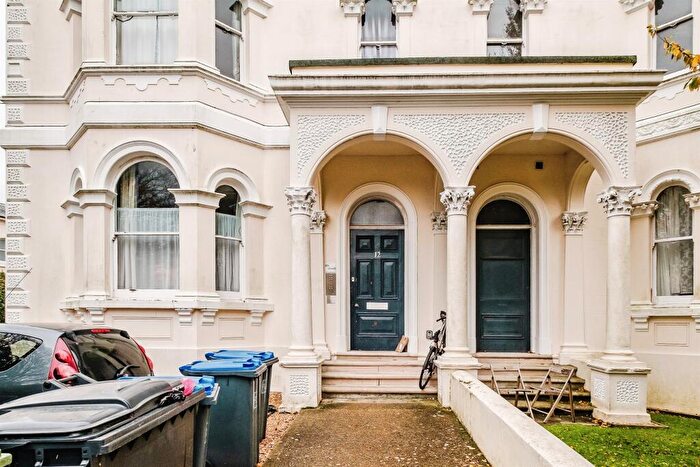
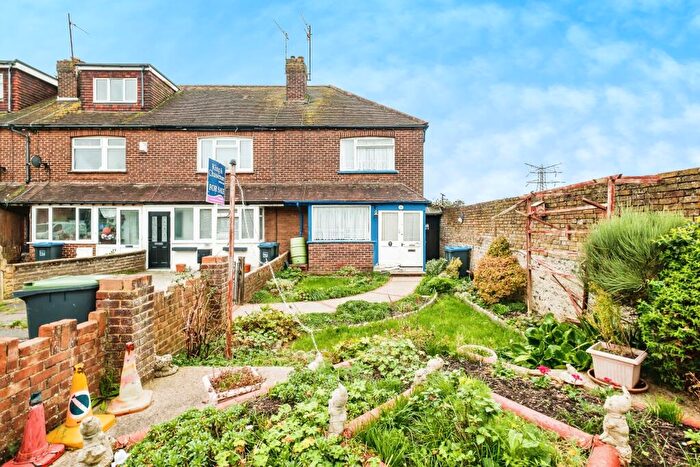
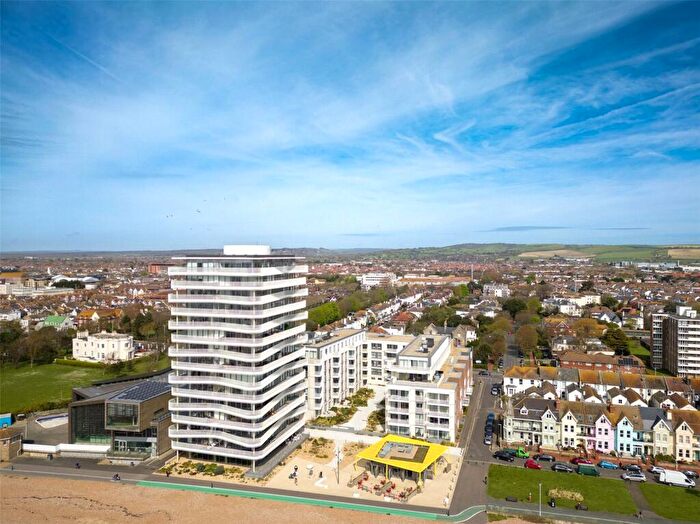
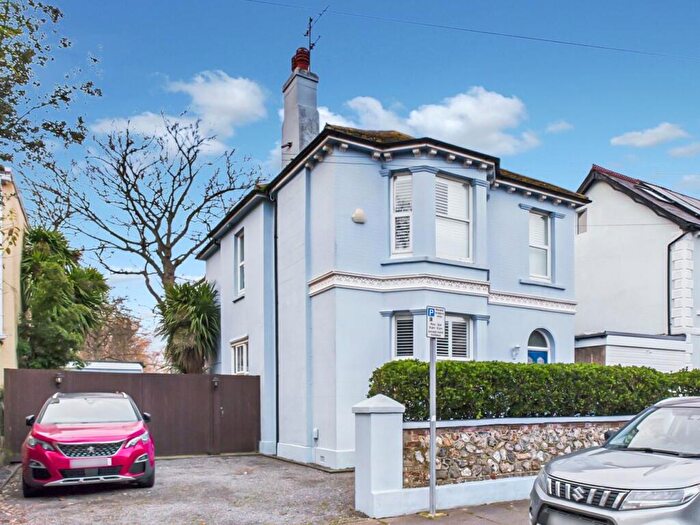
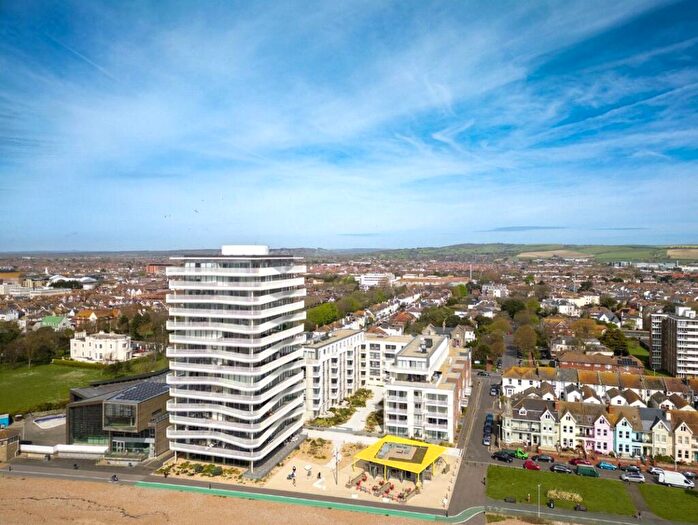
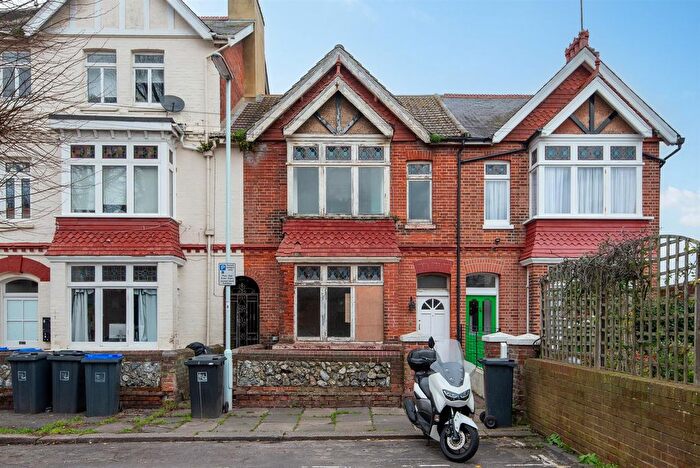
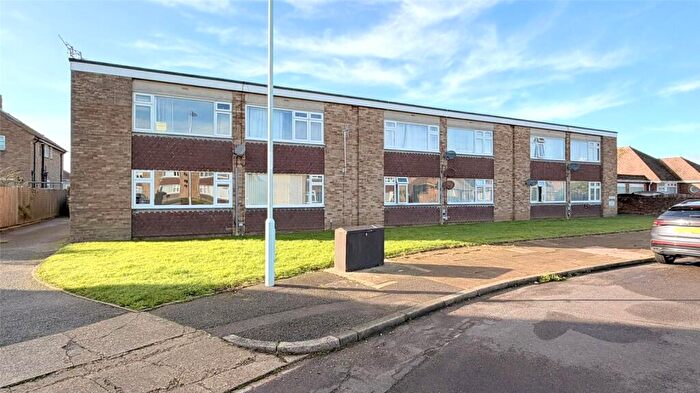
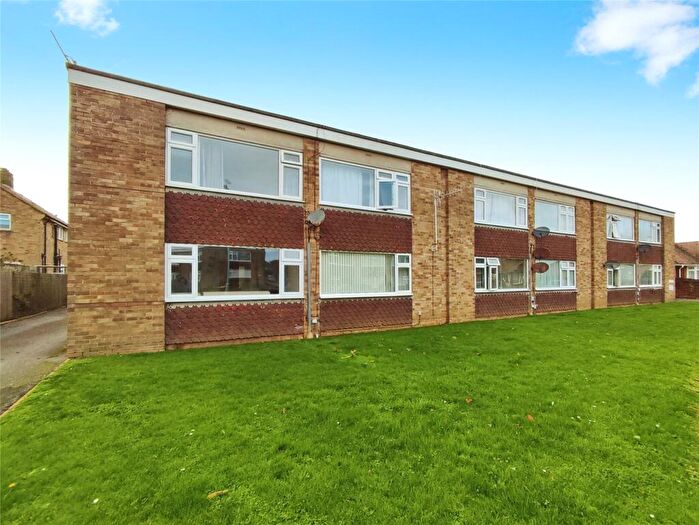
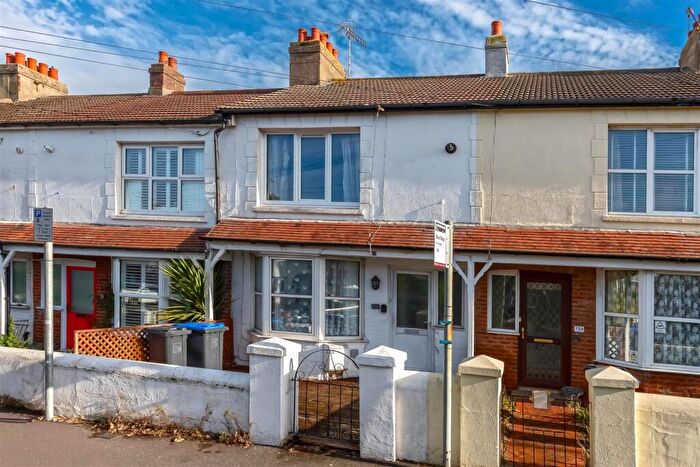
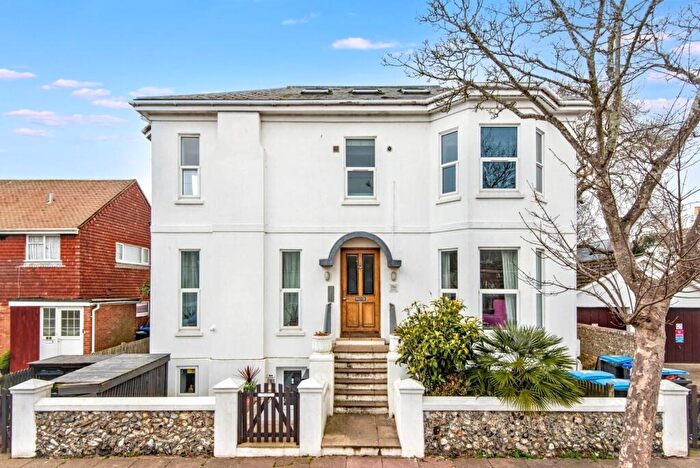
Houses for sale & to rent in Selden, Worthing
House Prices in Selden
Properties in Selden have an average house price of £351,847.00 and had 502 Property Transactions within the last 3 years¹.
Selden is an area in Worthing, West Sussex with 3,821 households², where the most expensive property was sold for £1,500,000.00.
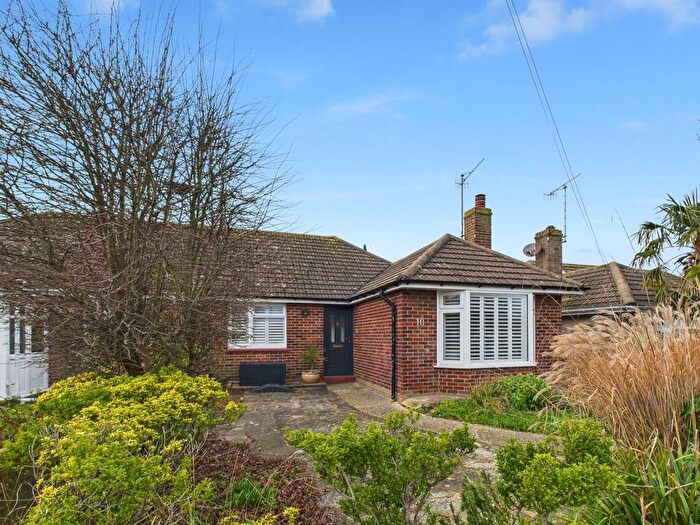
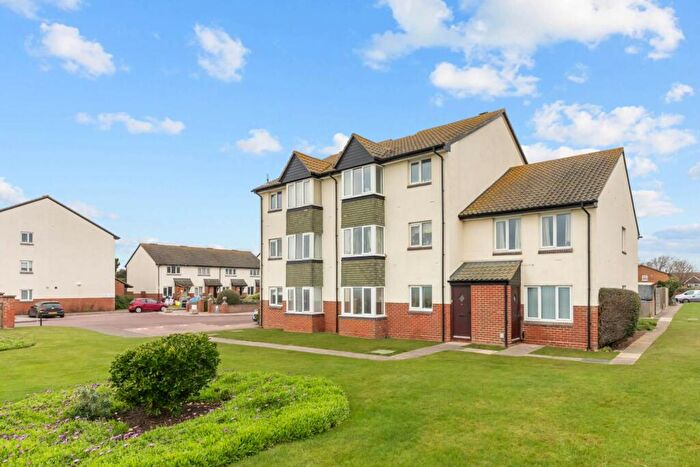
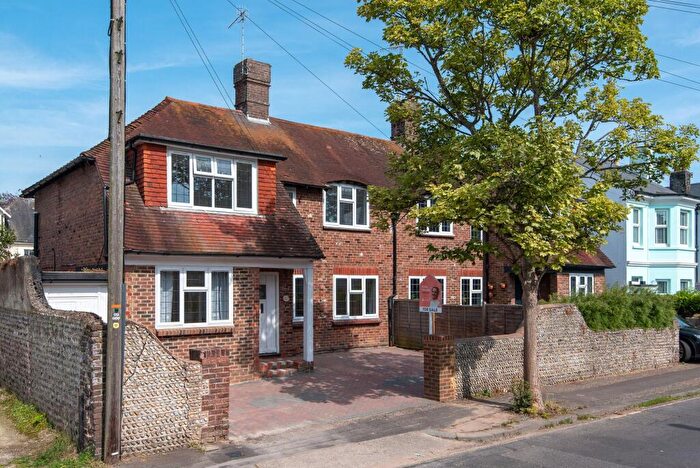
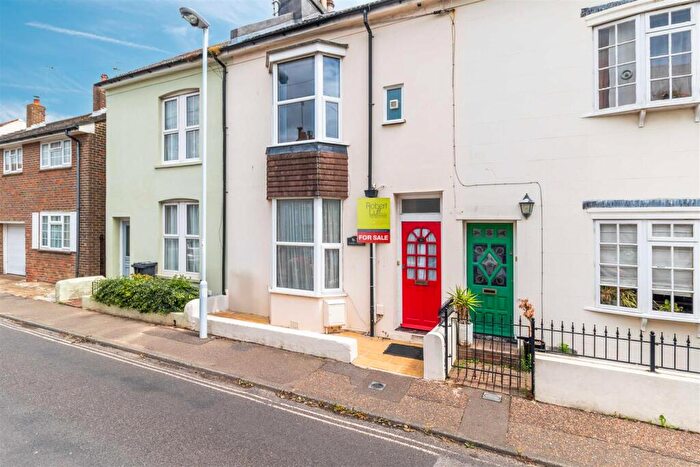
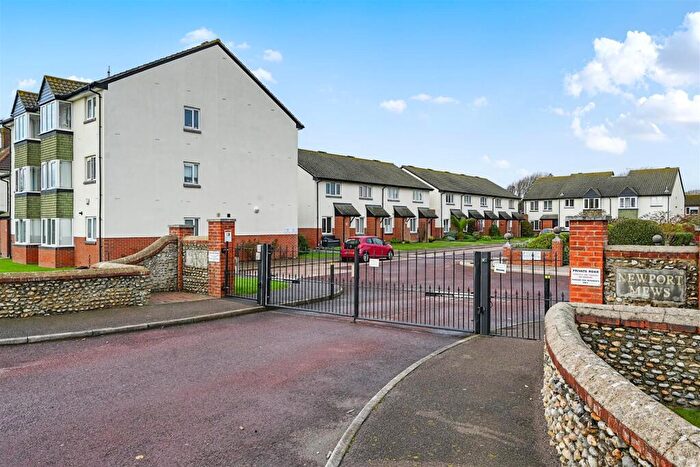
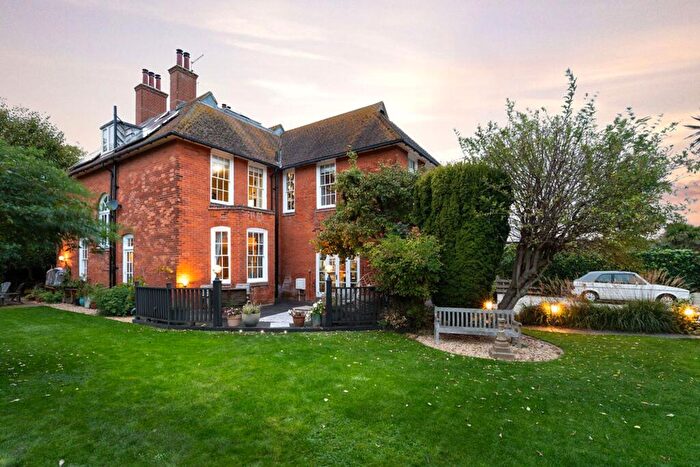
Properties for sale in Selden
Roads and Postcodes in Selden
Navigate through our locations to find the location of your next house in Selden, Worthing for sale or to rent.
Transport near Selden
-
East Worthing Station
-
Worthing Station
-
Lancing Station
-
West Worthing Station
-
Durrington-On-Sea Station
- FAQ
- Price Paid By Year
- Property Type Price
Frequently asked questions about Selden
What is the average price for a property for sale in Selden?
The average price for a property for sale in Selden is £351,847. This amount is 8% lower than the average price in Worthing. There are 1,464 property listings for sale in Selden.
What streets have the most expensive properties for sale in Selden?
The streets with the most expensive properties for sale in Selden are Malvern Close at an average of £578,750, New Parade at an average of £568,169 and Pendine Avenue at an average of £555,000.
What streets have the most affordable properties for sale in Selden?
The streets with the most affordable properties for sale in Selden are Brougham Walk at an average of £177,416, Chatham Road at an average of £197,500 and Selden Road at an average of £219,615.
Which train stations are available in or near Selden?
Some of the train stations available in or near Selden are East Worthing, Worthing and Lancing.
Property Price Paid in Selden by Year
The average sold property price by year was:
| Year | Average Sold Price | Price Change |
Sold Properties
|
|---|---|---|---|
| 2025 | £350,020 | -4% |
79 Properties |
| 2024 | £365,481 | 3% |
136 Properties |
| 2023 | £354,274 | 4% |
133 Properties |
| 2022 | £338,648 | 8% |
154 Properties |
| 2021 | £313,238 | 3% |
173 Properties |
| 2020 | £303,452 | 7% |
122 Properties |
| 2019 | £283,706 | -6% |
157 Properties |
| 2018 | £299,348 | 10% |
146 Properties |
| 2017 | £269,626 | 8% |
160 Properties |
| 2016 | £249,280 | 12% |
173 Properties |
| 2015 | £220,488 | -2% |
183 Properties |
| 2014 | £225,046 | 13% |
180 Properties |
| 2013 | £196,712 | 5% |
152 Properties |
| 2012 | £186,413 | -5% |
140 Properties |
| 2011 | £195,682 | 2% |
110 Properties |
| 2010 | £191,272 | 2% |
131 Properties |
| 2009 | £186,733 | 4% |
122 Properties |
| 2008 | £179,380 | -11% |
121 Properties |
| 2007 | £198,368 | 7% |
244 Properties |
| 2006 | £185,129 | 10% |
296 Properties |
| 2005 | £167,309 | 5% |
209 Properties |
| 2004 | £159,555 | 7% |
263 Properties |
| 2003 | £149,133 | 19% |
252 Properties |
| 2002 | £120,694 | 18% |
284 Properties |
| 2001 | £98,399 | 16% |
305 Properties |
| 2000 | £83,046 | 10% |
217 Properties |
| 1999 | £74,810 | 13% |
284 Properties |
| 1998 | £64,921 | 5% |
271 Properties |
| 1997 | £61,668 | 12% |
301 Properties |
| 1996 | £54,440 | 10% |
231 Properties |
| 1995 | £48,824 | - |
178 Properties |
Property Price per Property Type in Selden
Here you can find historic sold price data in order to help with your property search.
The average Property Paid Price for specific property types in the last three years are:
| Property Type | Average Sold Price | Sold Properties |
|---|---|---|
| Flat | £215,575.00 | 206 Flats |
| Semi Detached House | £446,154.00 | 112 Semi Detached Houses |
| Detached House | £581,089.00 | 42 Detached Houses |
| Terraced House | £407,350.00 | 142 Terraced Houses |

