
Houses for sale & to rent in SN11 0SJ, Bentley Lane, Calne South And Cherhill, Calne
House Prices in SN11 0SJ, Bentley Lane, Calne South And Cherhill
Properties in SN11 0SJ have no sales history available within the last 3 years. SN11 0SJ is a postcode in Bentley Lane located in Calne South And Cherhill, an area in Calne, Wiltshire, with 2 households².
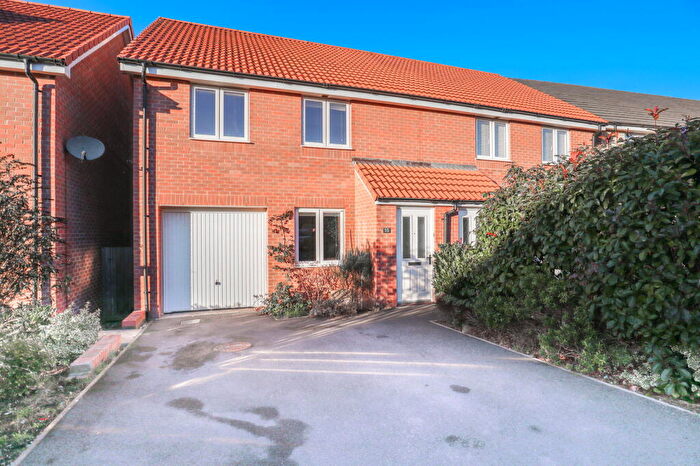
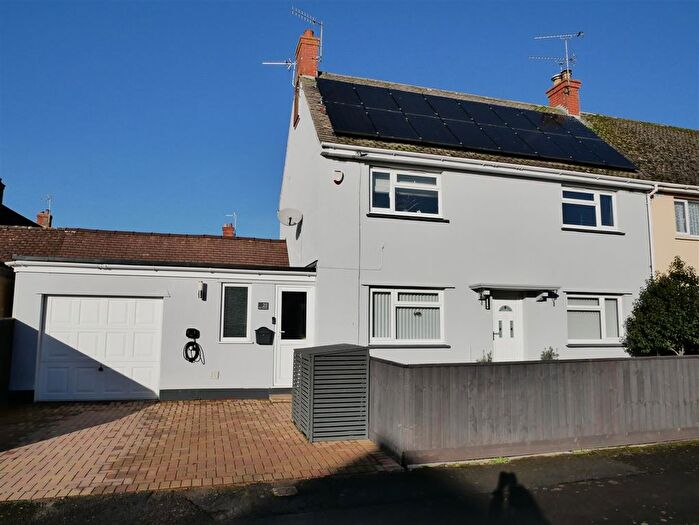
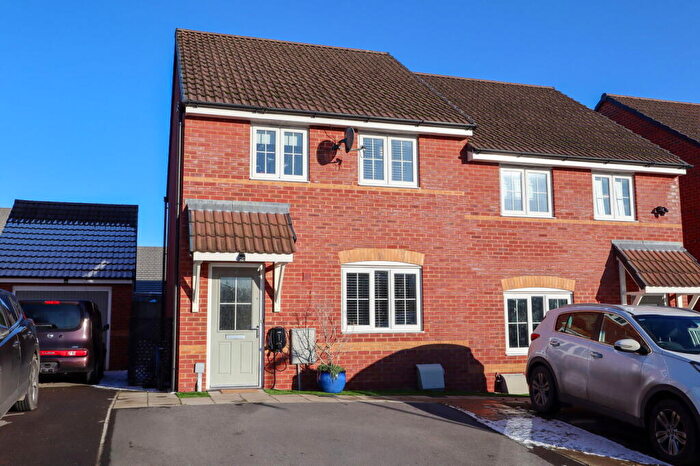
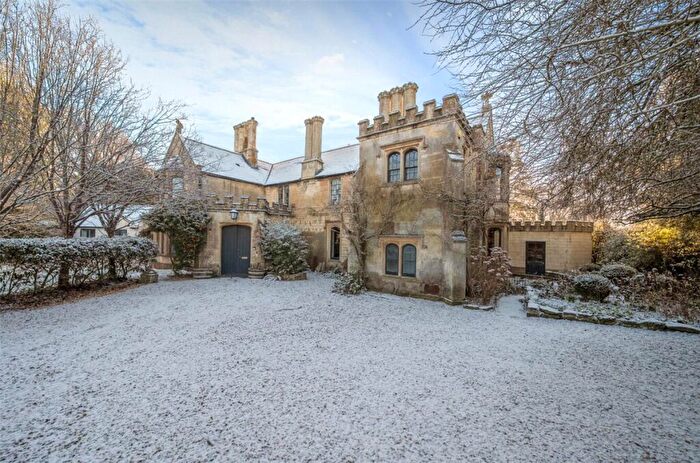
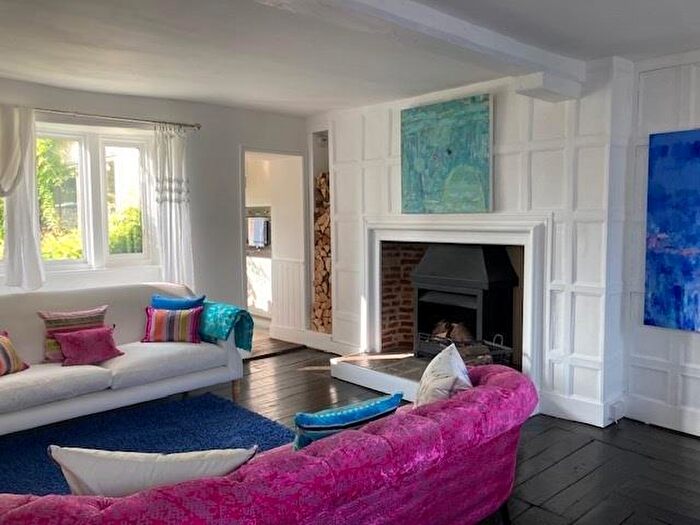
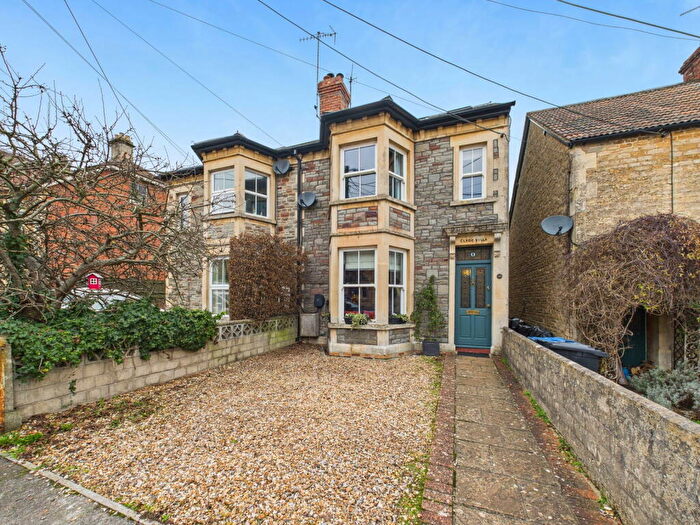
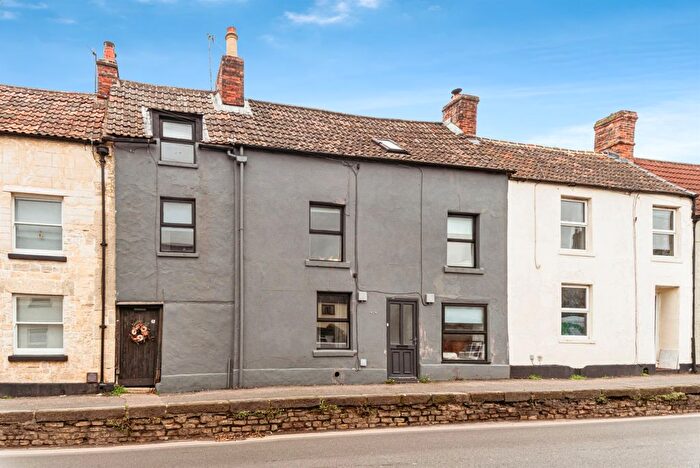
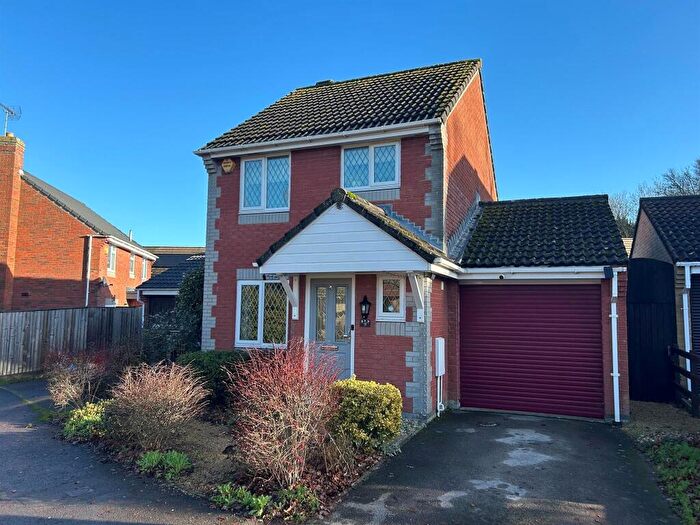
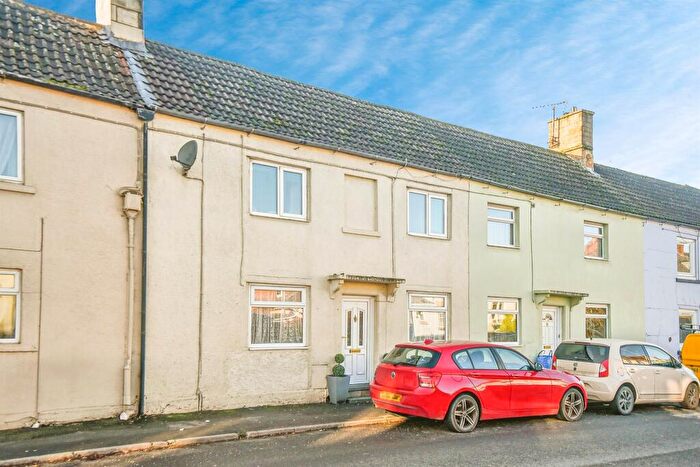
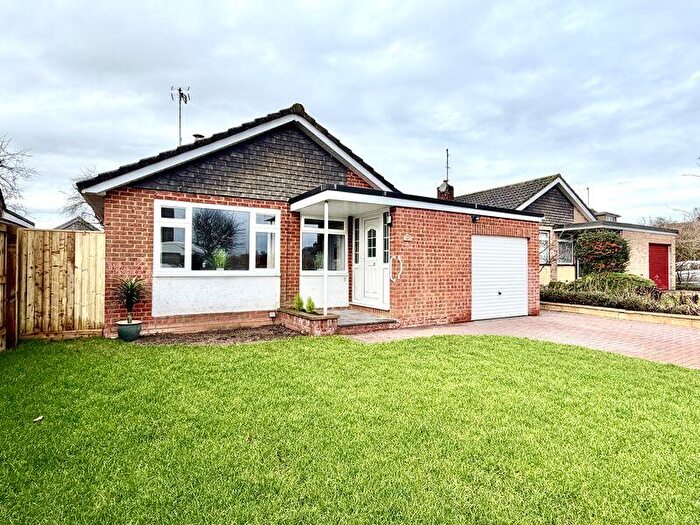
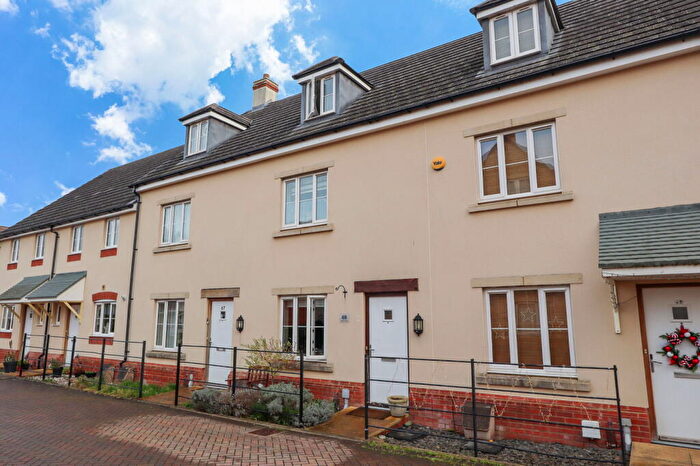
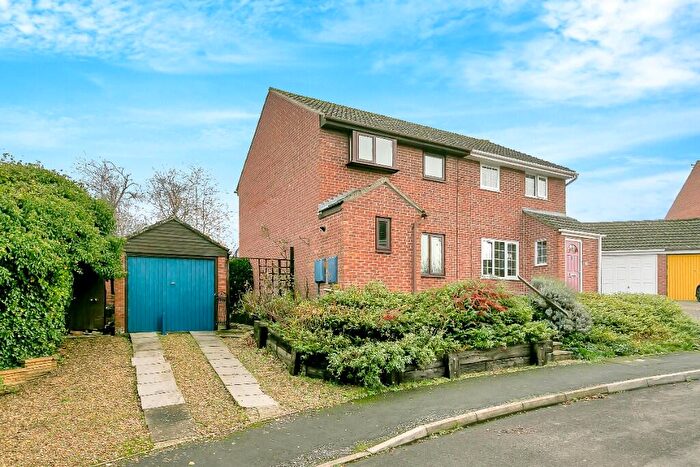
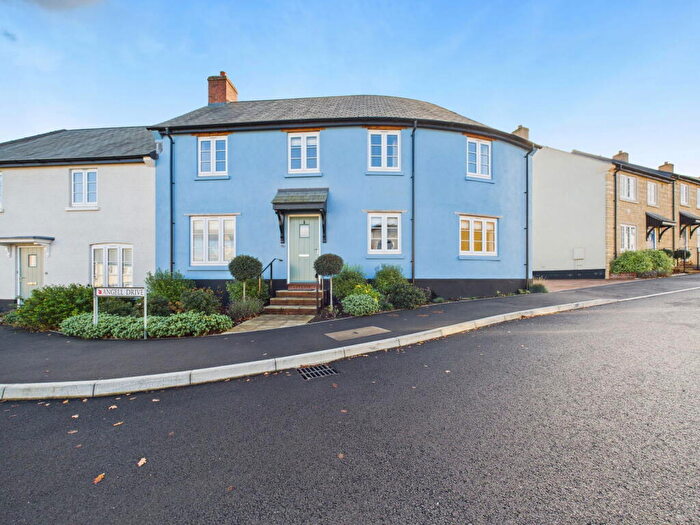
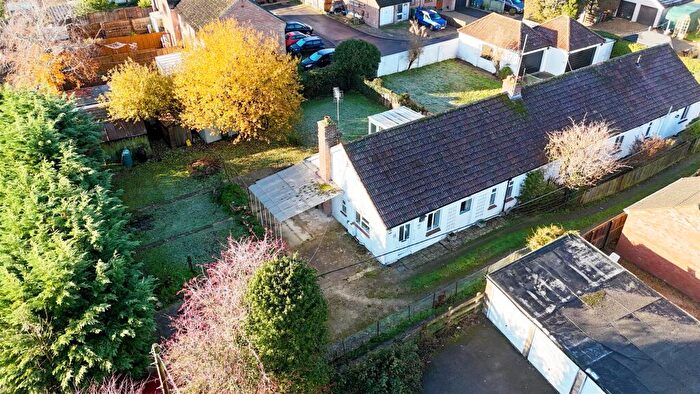
Properties for sale near SN11 0SJ, Bentley Lane
![]()
If you are looking to sell your house, let it out, or receive a property valuation, an expert can help you.
Click the button below to get started.
Price Paid in Bentley Lane, SN11 0SJ, Calne South And Cherhill
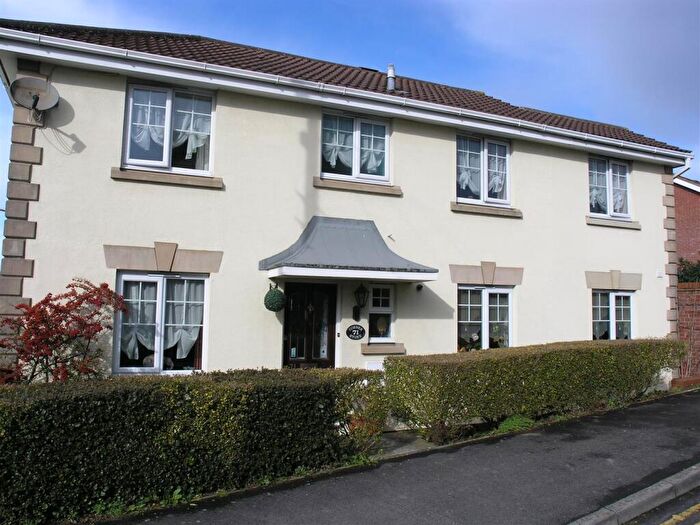
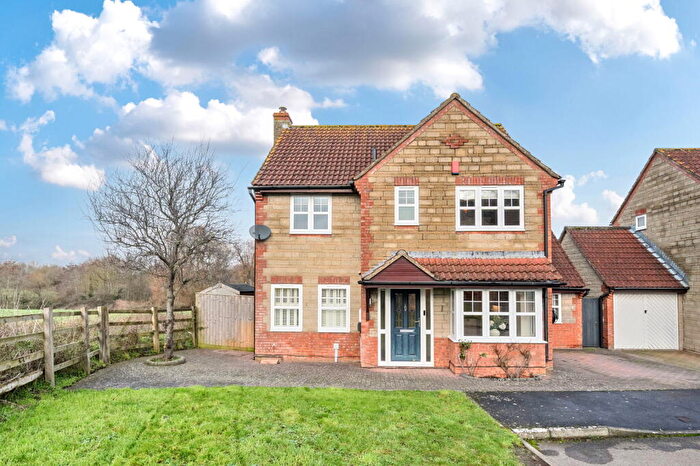
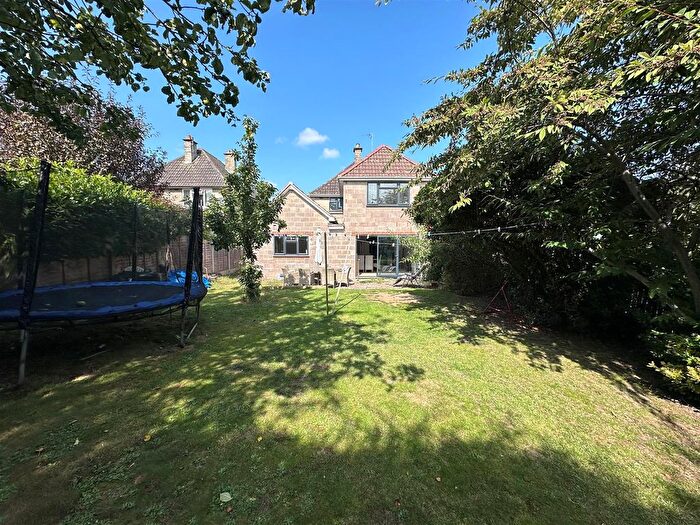
1 Bentley Lane, SN11 0SJ, Calne South And Cherhill Calne
Property 1 has been sold 4 times. The last time it was sold was in 17/03/2021 and the sold price was £470,000.00.
This detached house, sold as a freehold on 17/03/2021, is a 125 sqm detached house with an EPC rating of D.
| Date | Price | Property Type | Tenure | Classification |
|---|---|---|---|---|
| 17/03/2021 | £470,000.00 | Detached House | freehold | Established Building |
| 27/08/2014 | £365,000.00 | Detached House | freehold | Established Building |
| 31/08/2007 | £295,000.00 | Detached House | freehold | Established Building |
| 19/04/1996 | £123,000.00 | Semi Detached House | freehold | New Build |
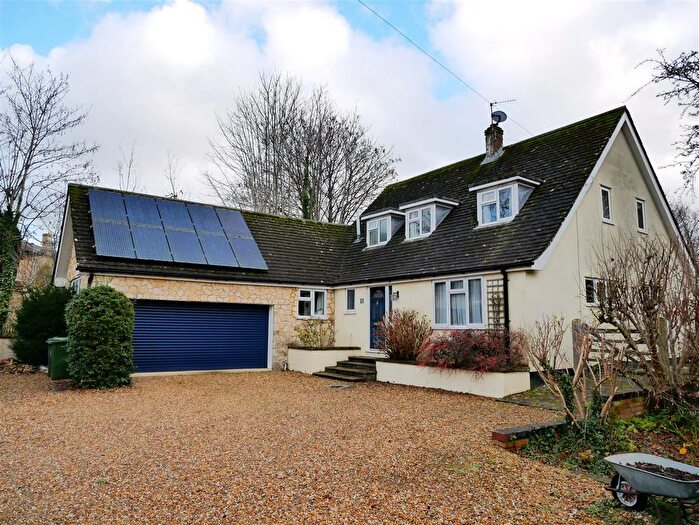
2 Bentley Lane, SN11 0SJ, Calne South And Cherhill Calne
Property 2 has been sold 2 times. The last time it was sold was in 31/08/1999 and the sold price was £158,500.00.
This is a Detached House which was sold as a freehold in 31/08/1999
| Date | Price | Property Type | Tenure | Classification |
|---|---|---|---|---|
| 31/08/1999 | £158,500.00 | Detached House | freehold | Established Building |
| 12/04/1996 | £129,000.00 | Detached House | freehold | New Build |
Transport near SN11 0SJ, Bentley Lane
-
 Chippenham Station
 -
Melksham Station
-
Pewsey Station
-
Trowbridge Station
-
Bradford-On-Avon Station
-
Swindon Station
-
Avoncliff Station
-
Westbury Station
-
Freshford Station
House price paid reports for SN11 0SJ, Bentley Lane
Click on the buttons below to see price paid reports by year or property price:
- Price Paid By Year
Property Price Paid in SN11 0SJ, Bentley Lane by Year
The average sold property price by year was:
| Year | Average Sold Price | Price Change |
Sold Properties
|
|---|---|---|---|
| 2021 | £470,000 | 22% |
1 Property |
| 2014 | £365,000 | 19% |
1 Property |
| 2007 | £295,000 | 46% |
1 Property |
| 1999 | £158,500 | 21% |
1 Property |
| 1996 | £126,000 | - |
2 Properties |