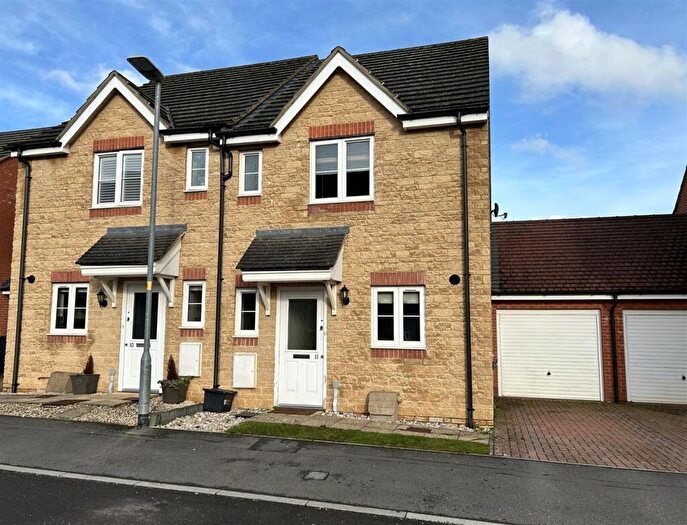
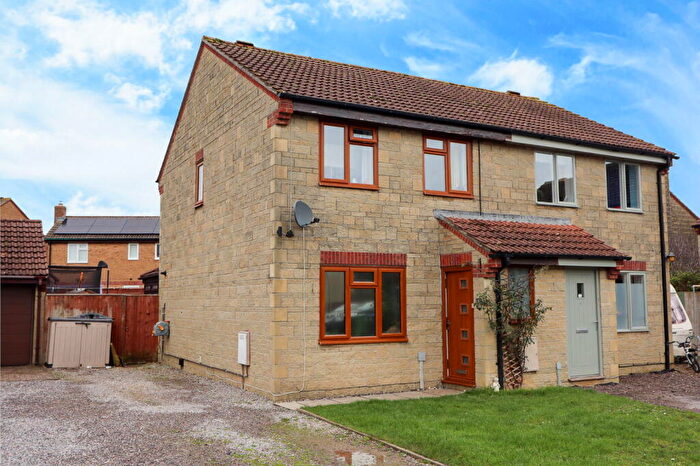
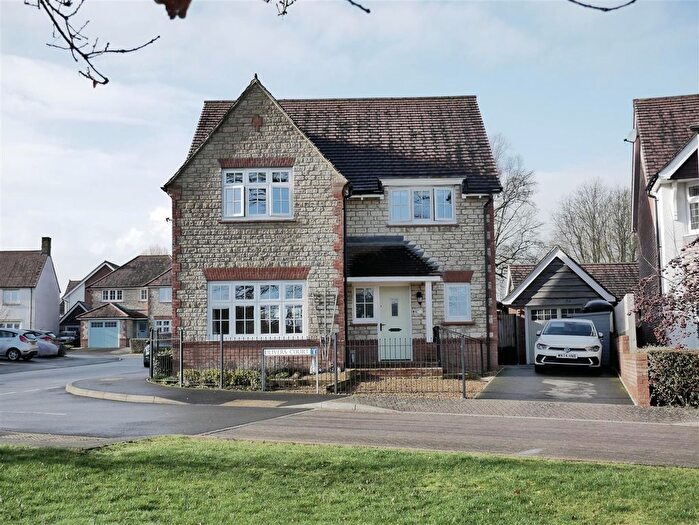
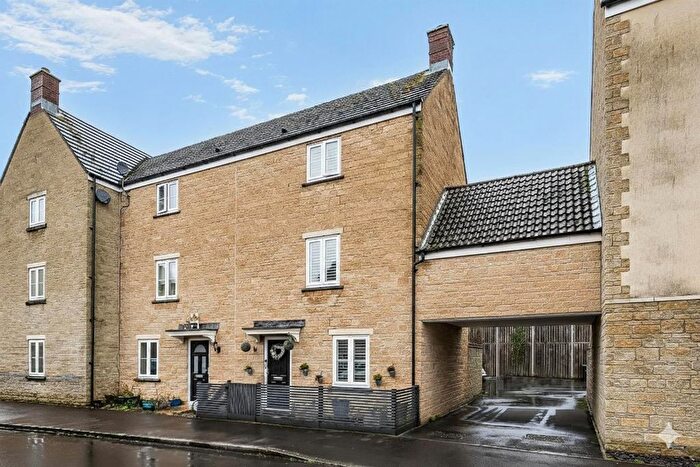
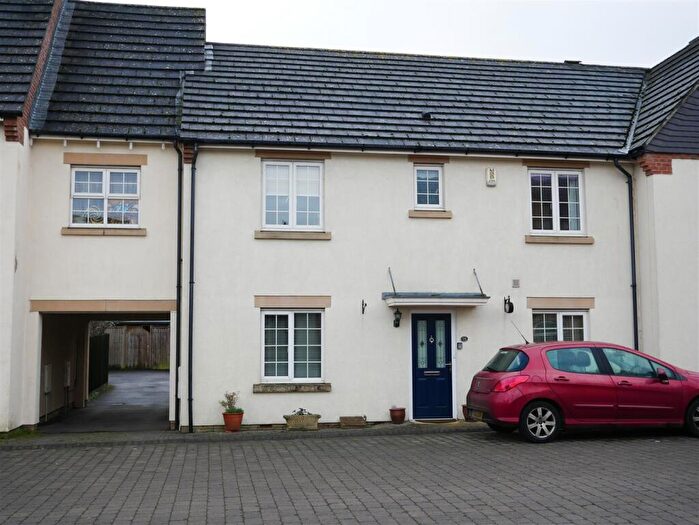
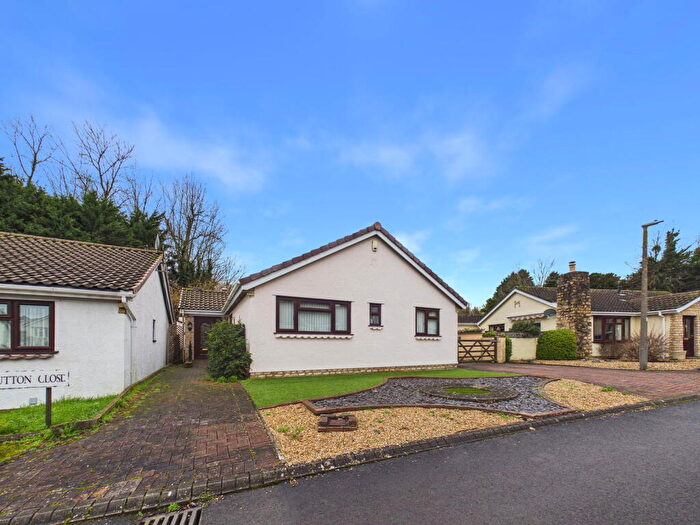
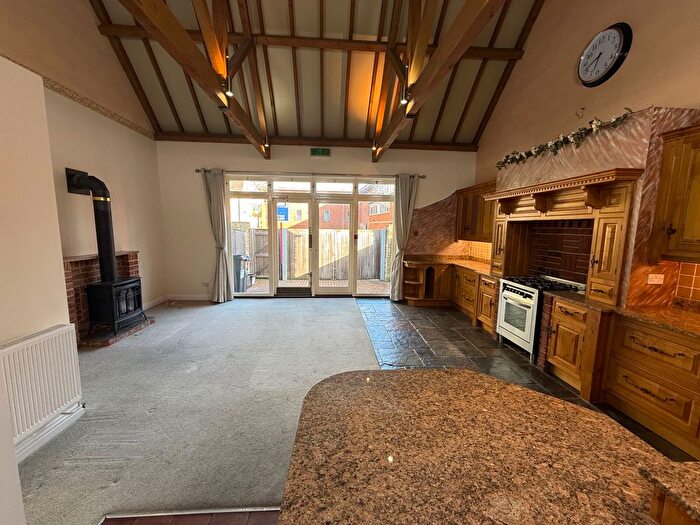
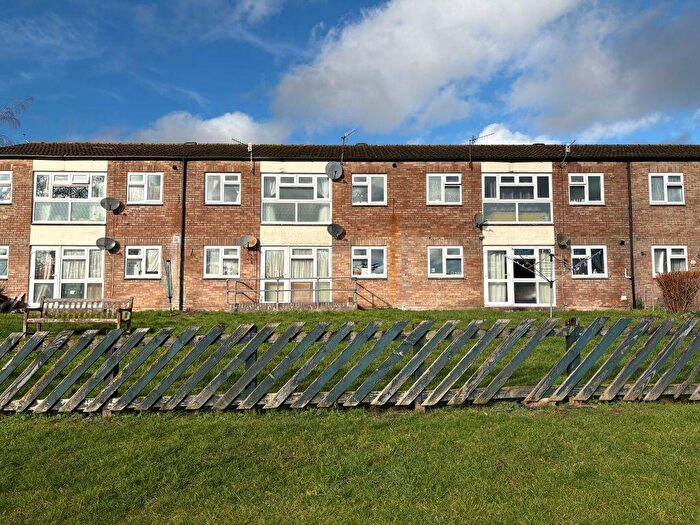
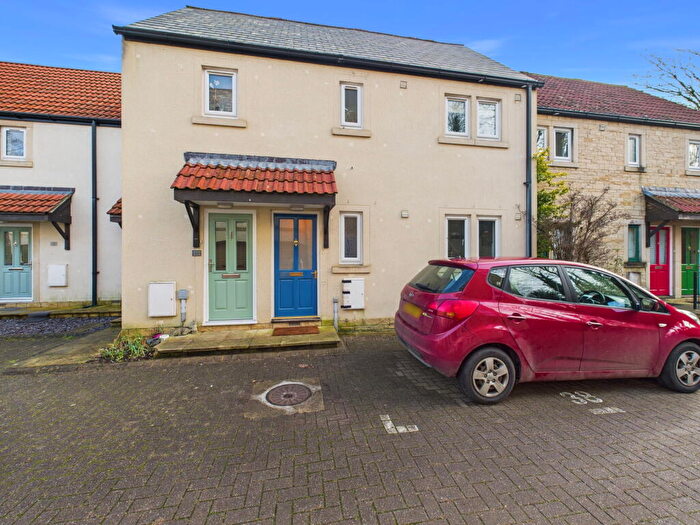
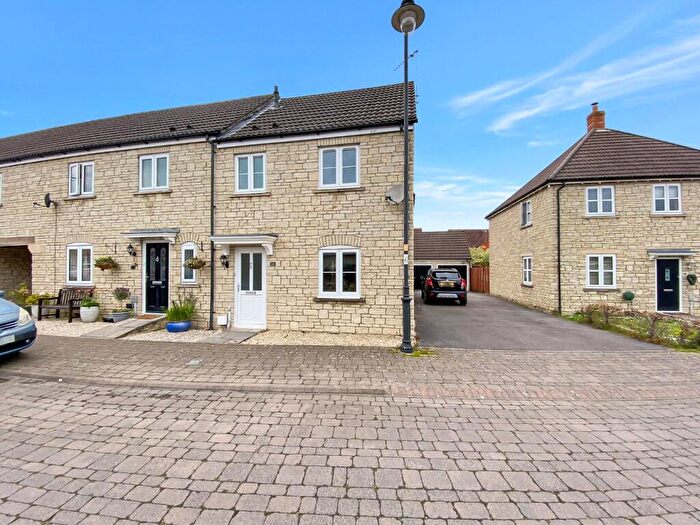
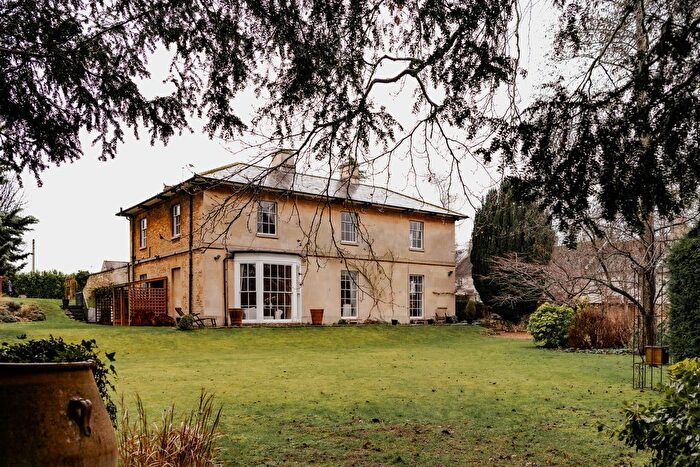
Houses for sale & to rent in Calne, Wiltshire
House Prices in Calne
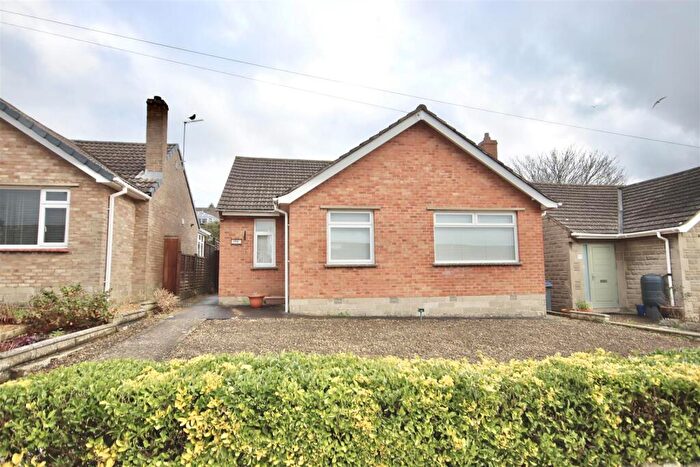
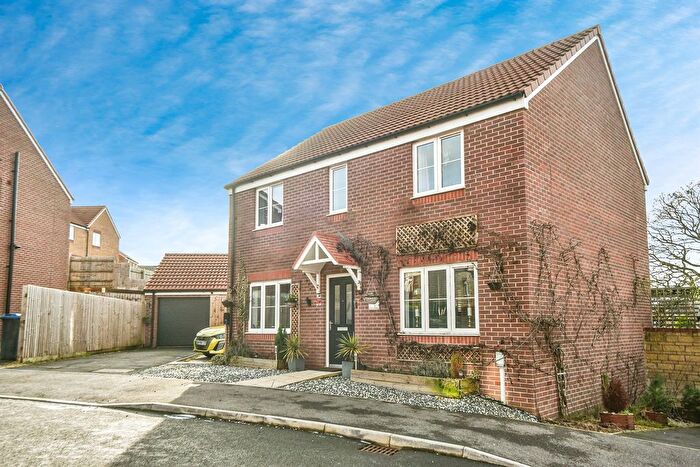
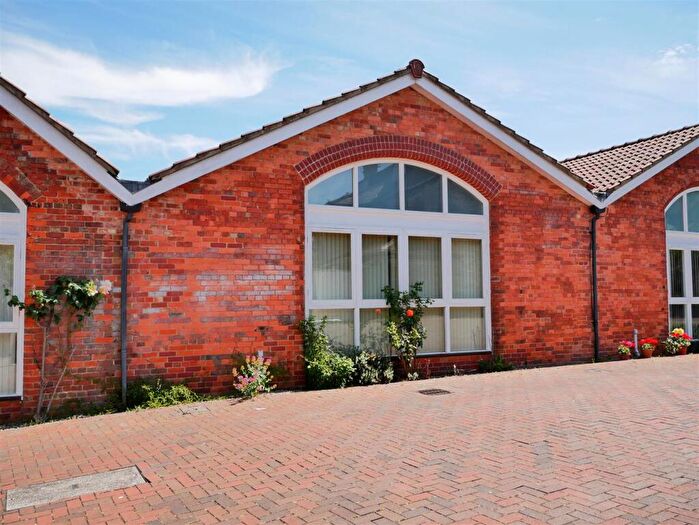
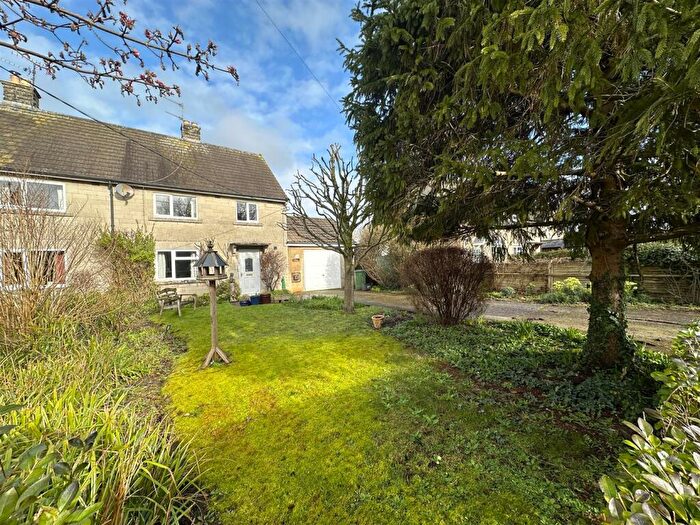
Properties in Calne have an average house price of £306,266.00 and had 995 Property Transactions within the last 3 years.¹
Calne is an area in Wiltshire with 9,146 households², where the most expensive property was sold for £1,710,000.00.
Properties for sale in Calne
Neighbourhoods in Calne
Navigate through our locations to find the location of your next house in Calne, Wiltshire for sale or to rent.
Transport in Calne
Please see below transportation links in this area:
-
Chippenham Station
-
Melksham Station
-
Pewsey Station
-
Trowbridge Station
-
Swindon Station
-
Bradford-On-Avon Station
-
Avoncliff Station
-
Freshford Station
-
Westbury Station
- FAQ
- Price Paid By Year
- Property Type Price
Frequently asked questions about Calne
What is the average price for a property for sale in Calne?
The average price for a property for sale in Calne is £306,266. This amount is 16% lower than the average price in Wiltshire. There are 6,696 property listings for sale in Calne.
What locations have the most expensive properties for sale in Calne?
The locations with the most expensive properties for sale in Calne are Calne Rural at an average of £488,219, Calne South And Cherhill at an average of £346,569 and Calne Central at an average of £268,278.
What locations have the most affordable properties for sale in Calne?
The locations with the most affordable properties for sale in Calne are Calne Chilvester And Abberd at an average of £255,123 and Calne North at an average of £255,584.
Which train stations are available in or near Calne?
Some of the train stations available in or near Calne are Chippenham, Melksham and Pewsey.
Property Price Paid in Calne by Year
The average sold property price by year was:
| Year | Average Sold Price | Price Change |
Sold Properties
|
|---|---|---|---|
| 2025 | £311,598 | 3% |
347 Properties |
| 2024 | £301,261 | -2% |
361 Properties |
| 2023 | £306,114 | -5% |
287 Properties |
| 2022 | £320,167 | 5% |
442 Properties |
| 2021 | £303,823 | 9% |
526 Properties |
| 2020 | £275,110 | -2% |
403 Properties |
| 2019 | £281,368 | 3% |
456 Properties |
| 2018 | £271,679 | 0,1% |
550 Properties |
| 2017 | £271,347 | 12% |
529 Properties |
| 2016 | £239,371 | 9% |
541 Properties |
| 2015 | £218,488 | 6% |
497 Properties |
| 2014 | £205,437 | 2% |
577 Properties |
| 2013 | £200,837 | -1% |
449 Properties |
| 2012 | £203,712 | -1% |
370 Properties |
| 2011 | £206,440 | -1% |
270 Properties |
| 2010 | £208,937 | 14% |
302 Properties |
| 2009 | £180,347 | -8% |
298 Properties |
| 2008 | £195,560 | -1% |
364 Properties |
| 2007 | £196,793 | 8% |
745 Properties |
| 2006 | £181,593 | 0,4% |
856 Properties |
| 2005 | £180,874 | -5% |
699 Properties |
| 2004 | £189,697 | 15% |
639 Properties |
| 2003 | £161,095 | 11% |
637 Properties |
| 2002 | £143,462 | 15% |
755 Properties |
| 2001 | £121,457 | 8% |
647 Properties |
| 2000 | £111,678 | 14% |
566 Properties |
| 1999 | £95,976 | 20% |
633 Properties |
| 1998 | £76,912 | 6% |
502 Properties |
| 1997 | £72,511 | 9% |
459 Properties |
| 1996 | £66,342 | 1% |
499 Properties |
| 1995 | £65,776 | - |
383 Properties |
Property Price per Property Type in Calne
Here you can find historic sold price data in order to help with your property search.
The average Property Paid Price for specific property types in the last three years are:
| Property Type | Average Sold Price | Sold Properties |
|---|---|---|
| Semi Detached House | £292,546.00 | 271 Semi Detached Houses |
| Detached House | £464,710.00 | 276 Detached Houses |
| Terraced House | £238,679.00 | 340 Terraced Houses |
| Flat | £148,552.00 | 108 Flats |

