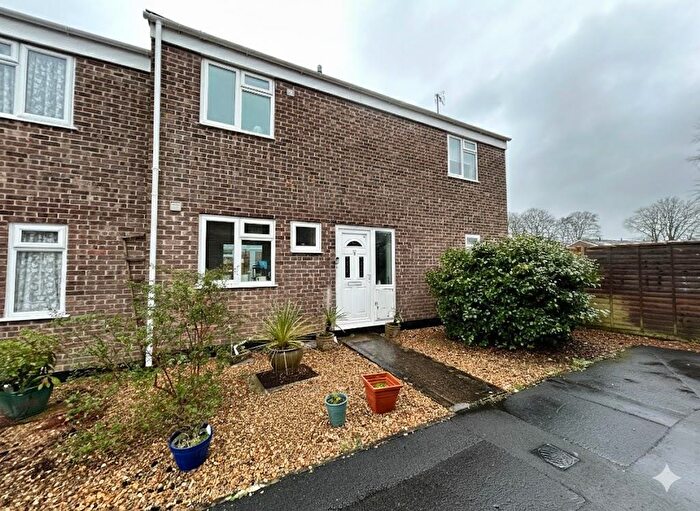
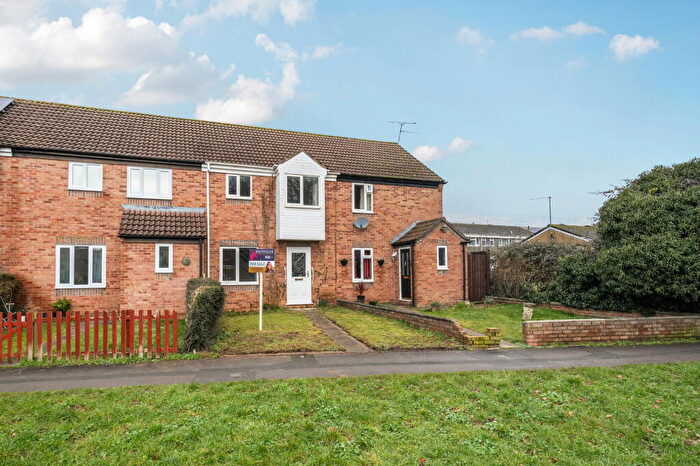
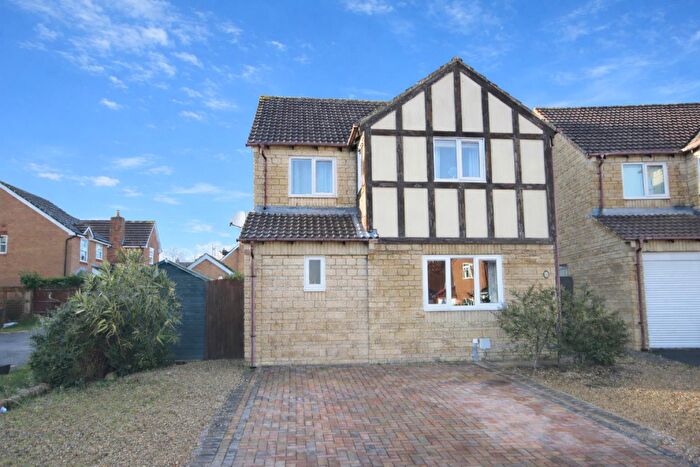
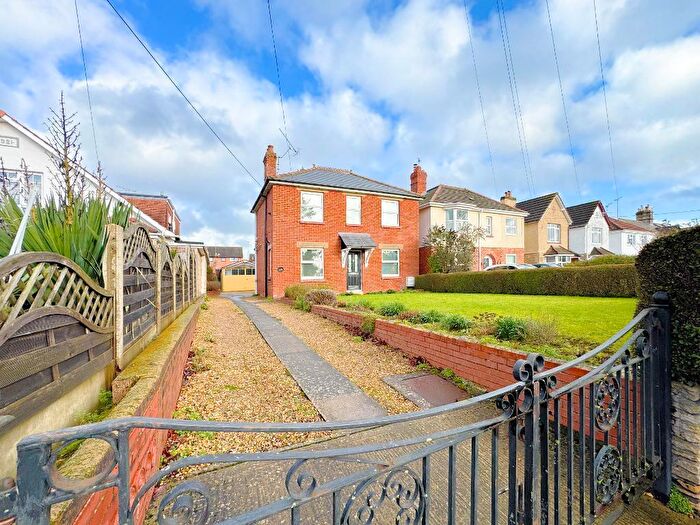
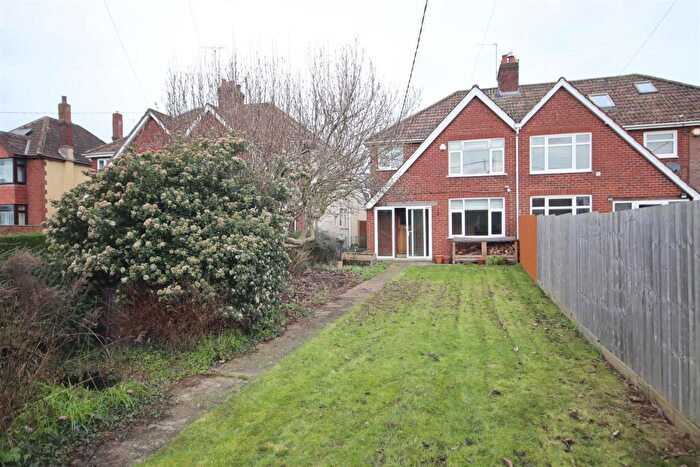
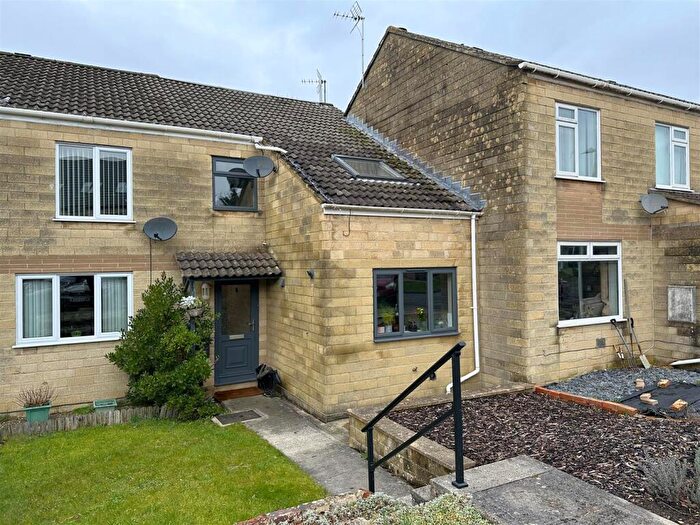
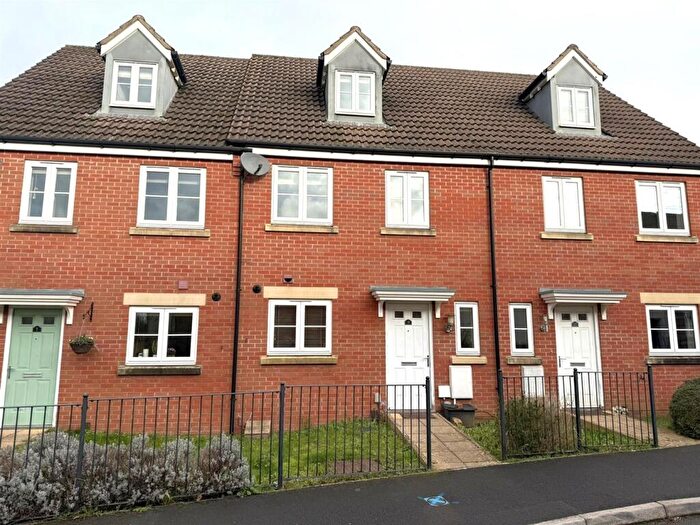
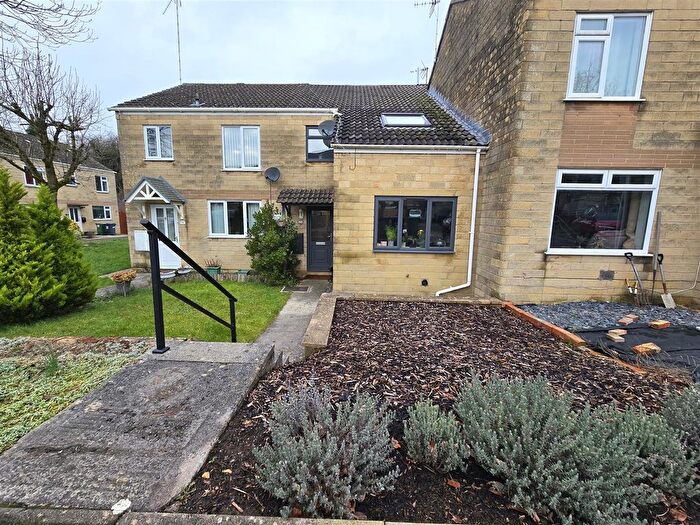
Houses for sale & to rent in Chippenham Queens And Sheldon, Chippenham
House Prices in Chippenham Queens And Sheldon
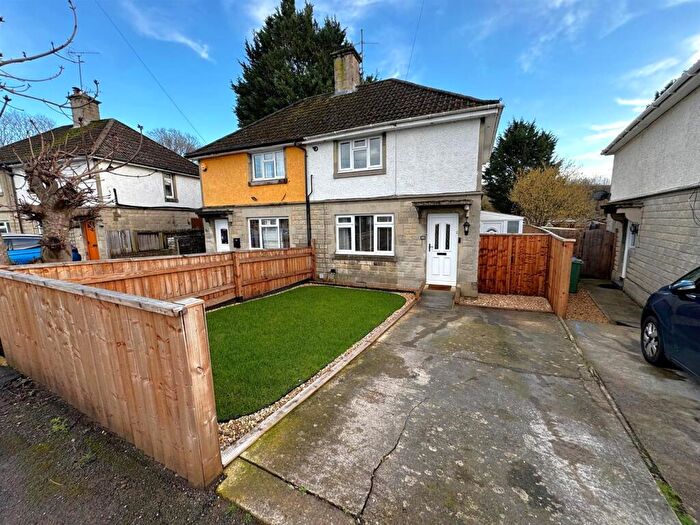
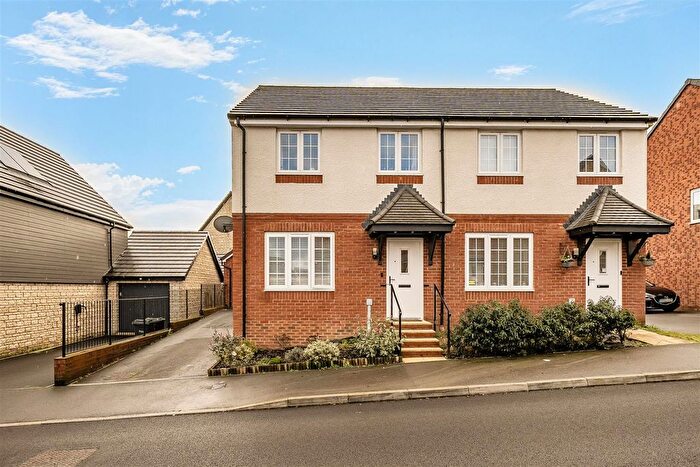
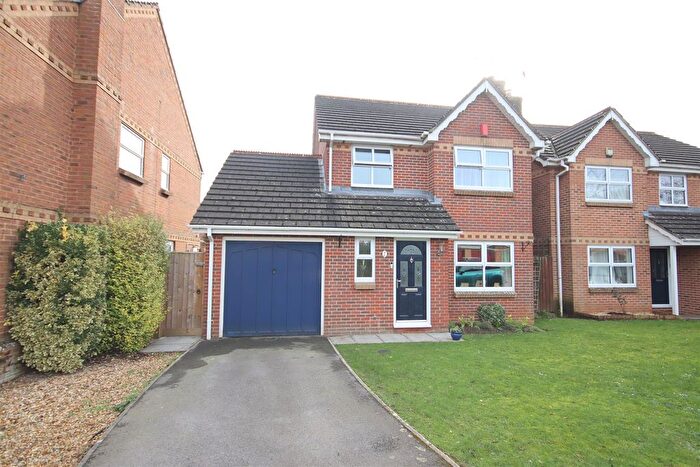
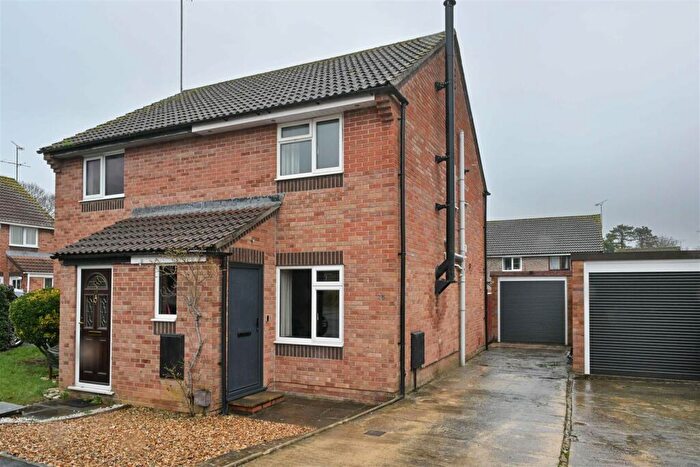
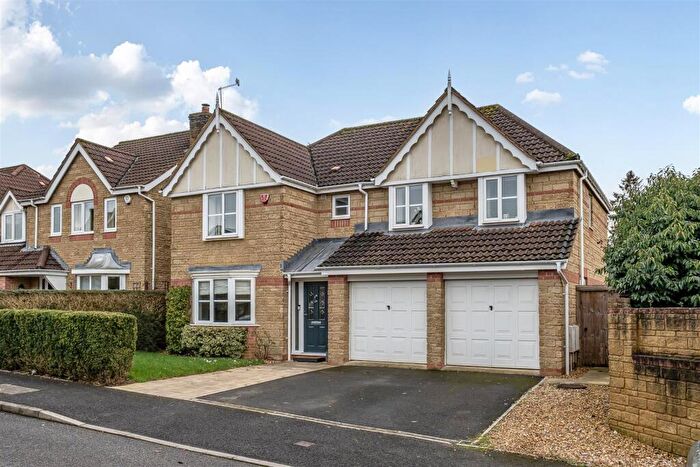
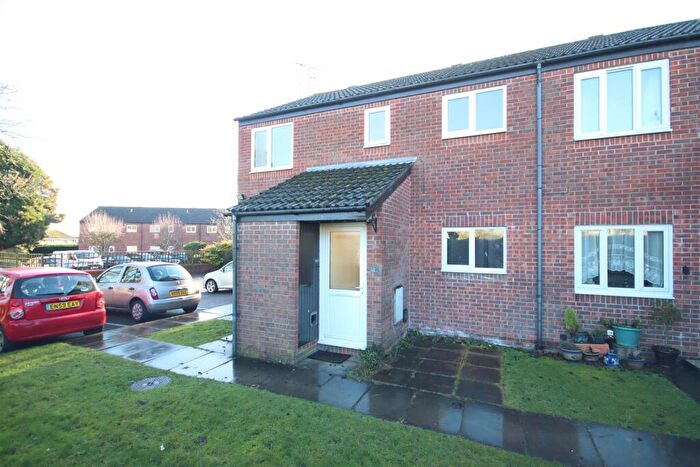
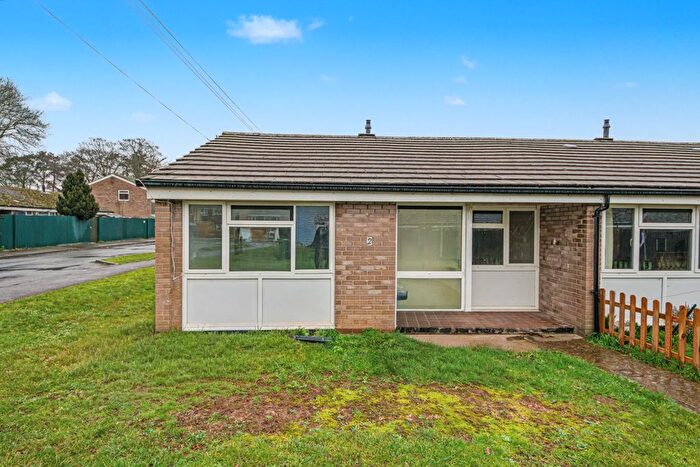
Properties in Chippenham Queens And Sheldon have an average house price of £275,019.00 and had 148 Property Transactions within the last 3 years¹.
Chippenham Queens And Sheldon is an area in Chippenham, Wiltshire with 1,869 households², where the most expensive property was sold for £480,000.00.
Properties for sale in Chippenham Queens And Sheldon
Roads and Postcodes in Chippenham Queens And Sheldon
Navigate through our locations to find the location of your next house in Chippenham Queens And Sheldon, Chippenham for sale or to rent.
| Streets | Postcodes |
|---|---|
| Andrews Close | SN14 0TU SN14 0TX |
| Arundel Close | SN14 0PR |
| Avebury Road | SN14 0NX |
| Bath Road | SN14 0AD SN14 0AB SN14 0AE SN14 0AT |
| Berkeley Close | SN14 0PS |
| Brook Street | SN14 0HN |
| Carnarvon Close | SN14 0PN |
| Chelwood Close | SN14 0SA |
| Clover Dean | SN14 0PH |
| Coniston Road | SN14 0PX |
| Conway Road | SN14 0PP SN14 0PW |
| Cranwell Close | SN14 0QG |
| Fairfoot Close | SN14 0PJ SN14 0PL |
| Farleigh Close | SN14 0PT |
| Gloucester Close | SN14 0NS |
| Hungerdown Lane | SN14 0BA SN14 0BB |
| Kent Close | SN14 0QE |
| Kilverts Close | SN14 0PU |
| Kingsley Road | SN14 0AS SN14 0BF |
| Lackham Circus | SN14 0AU |
| Ladyfield Road | SN14 0AL SN14 0AN SN14 0AP SN14 0AW |
| Litherland Close | SN14 0FH |
| Little Down | SN14 0DW |
| Littlecote Road | SN14 0NY |
| Lydiard Road | SN14 0NZ |
| Minster Way | SN14 0PY |
| Orchard Crescent | SN14 0BG |
| Orchard Road | SN14 0BE |
| Parliament Street | SN14 0DE |
| Portway | SN14 0BQ |
| Queens Crescent | SN14 0NF SN14 0NG SN14 0NJ SN14 0NL SN14 0NP SN14 0NQ SN14 0NR SN14 0NT SN14 0NW SN14 0NH SN14 0NN |
| Ripon Close | SN14 0QF |
| Salisbury Close | SN14 0QX |
| Sarum Road | SN14 0QA |
| Sheldon Road | SN14 0BS SN14 0BX SN14 0BY SN14 0BZ SN14 0DA SN14 0BU |
| Silbury Close | SN14 0QQ |
| Southmead | SN14 0RT SN14 0RU SN14 0SB |
| Spinney Close | SN14 0PQ |
| Stockwood Road | SN14 0RY SN14 0RZ |
| Stonelea Close | SN14 0DB SN14 0DD |
| The Firs | SN14 0PG |
| Trenchard Close | SN14 0PZ |
| Truro Walk | SN14 0QY |
| Wardour Road | SN14 0PA |
| Wells Close | SN14 0QD |
| Wessex Close | SN14 0JQ |
| Westcroft | SN14 0LY SN14 0LZ SN14 0NA SN14 0NB SN14 0ND SN14 0NU |
| Westerleigh Close | SN14 0RX |
| Westminster Gardens | SN14 0DF |
| Winchester Close | SN14 0QU |
| Windsor Close | SN14 0QT |
| Woodlands Bungalows | SN14 0HL |
| Woodlands Road | SN14 0HH SN14 0HJ |
| York Close | SN14 0QB |
| SN14 0LS SN14 0NE |
Transport near Chippenham Queens And Sheldon
- FAQ
- Price Paid By Year
- Property Type Price
Frequently asked questions about Chippenham Queens And Sheldon
What is the average price for a property for sale in Chippenham Queens And Sheldon?
The average price for a property for sale in Chippenham Queens And Sheldon is £275,019. This amount is 25% lower than the average price in Chippenham. There are 953 property listings for sale in Chippenham Queens And Sheldon.
What streets have the most expensive properties for sale in Chippenham Queens And Sheldon?
The streets with the most expensive properties for sale in Chippenham Queens And Sheldon are Truro Walk at an average of £455,000, Kilverts Close at an average of £433,500 and Bath Road at an average of £420,000.
What streets have the most affordable properties for sale in Chippenham Queens And Sheldon?
The streets with the most affordable properties for sale in Chippenham Queens And Sheldon are Spinney Close at an average of £122,000, Stockwood Road at an average of £175,666 and The Firs at an average of £190,275.
Which train stations are available in or near Chippenham Queens And Sheldon?
Some of the train stations available in or near Chippenham Queens And Sheldon are Chippenham, Melksham and Bradford-On-Avon.
Property Price Paid in Chippenham Queens And Sheldon by Year
The average sold property price by year was:
| Year | Average Sold Price | Price Change |
Sold Properties
|
|---|---|---|---|
| 2025 | £274,978 | -1% |
42 Properties |
| 2024 | £276,573 | 1% |
61 Properties |
| 2023 | £272,952 | -12% |
45 Properties |
| 2022 | £305,432 | 20% |
53 Properties |
| 2021 | £244,008 | 3% |
75 Properties |
| 2020 | £237,500 | -3% |
49 Properties |
| 2019 | £244,057 | -3% |
67 Properties |
| 2018 | £252,363 | 9% |
50 Properties |
| 2017 | £229,972 | 2% |
77 Properties |
| 2016 | £225,170 | 8% |
67 Properties |
| 2015 | £207,482 | 16% |
59 Properties |
| 2014 | £175,250 | 4% |
53 Properties |
| 2013 | £168,775 | 4% |
52 Properties |
| 2012 | £162,454 | -3% |
62 Properties |
| 2011 | £166,885 | -5% |
31 Properties |
| 2010 | £175,000 | 6% |
39 Properties |
| 2009 | £164,344 | 2% |
45 Properties |
| 2008 | £161,837 | -4% |
41 Properties |
| 2007 | £167,961 | -0,1% |
78 Properties |
| 2006 | £168,169 | 8% |
81 Properties |
| 2005 | £155,422 | -0,2% |
75 Properties |
| 2004 | £155,676 | 13% |
71 Properties |
| 2003 | £136,077 | 12% |
59 Properties |
| 2002 | £119,399 | 17% |
94 Properties |
| 2001 | £98,628 | 15% |
76 Properties |
| 2000 | £83,352 | 9% |
59 Properties |
| 1999 | £75,633 | 14% |
86 Properties |
| 1998 | £65,145 | 11% |
76 Properties |
| 1997 | £58,118 | 3% |
74 Properties |
| 1996 | £56,338 | 8% |
83 Properties |
| 1995 | £51,700 | - |
54 Properties |
Property Price per Property Type in Chippenham Queens And Sheldon
Here you can find historic sold price data in order to help with your property search.
The average Property Paid Price for specific property types in the last three years are:
| Property Type | Average Sold Price | Sold Properties |
|---|---|---|
| Semi Detached House | £283,877.00 | 70 Semi Detached Houses |
| Detached House | £374,797.00 | 22 Detached Houses |
| Terraced House | £240,385.00 | 48 Terraced Houses |
| Flat | £130,937.00 | 8 Flats |

