
Houses for sale in Chippenham, Wiltshire
House Prices in Chippenham
Properties in Chippenham have an average house price of £368k and had 2,609 Property Transactions within the last 3 years.¹
Chippenham is an area in Wiltshire with 25,737 households², where the most expensive property was sold for £6.5M.
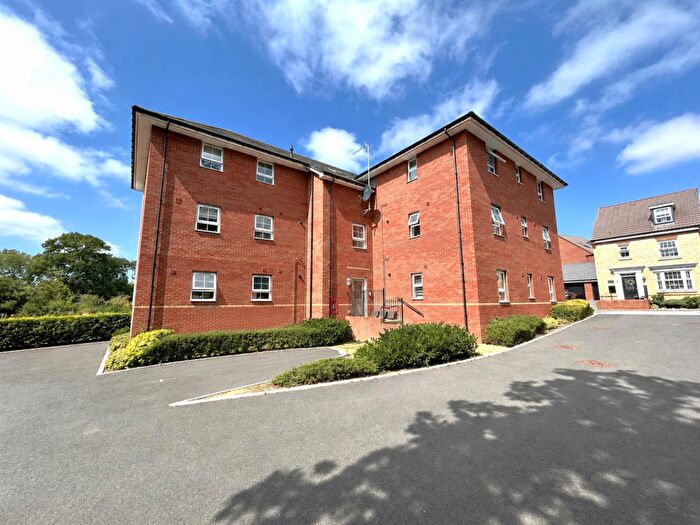
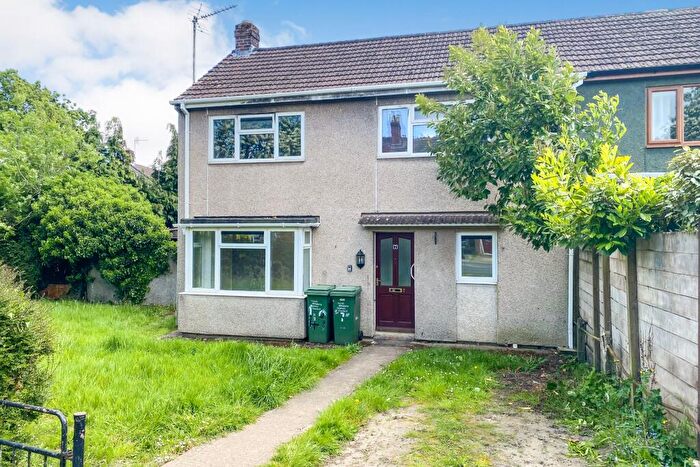
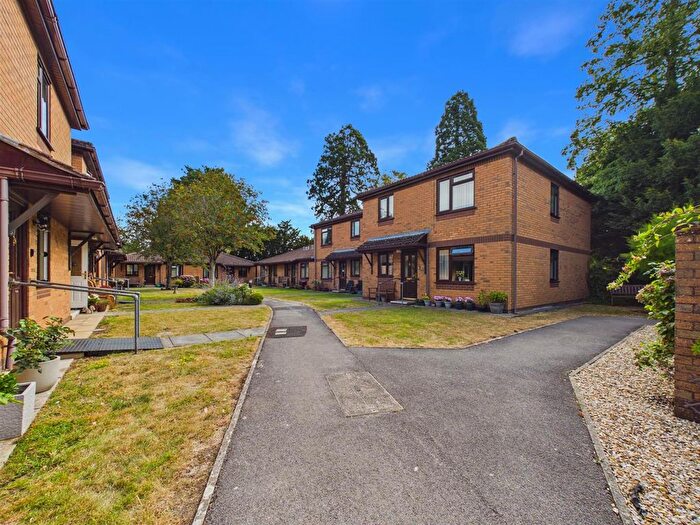
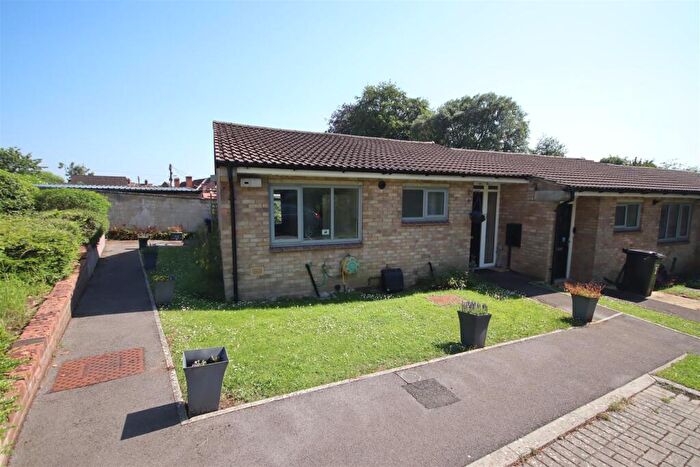
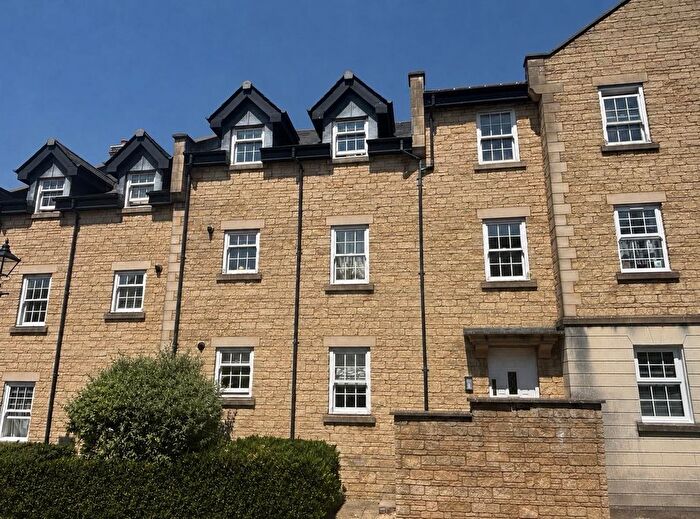
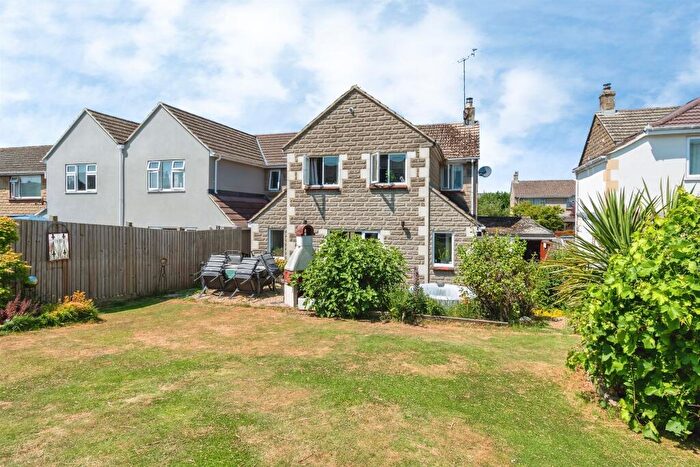
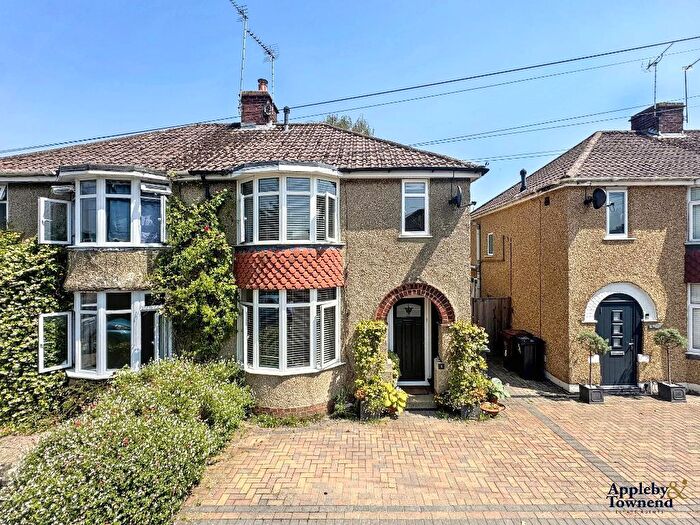
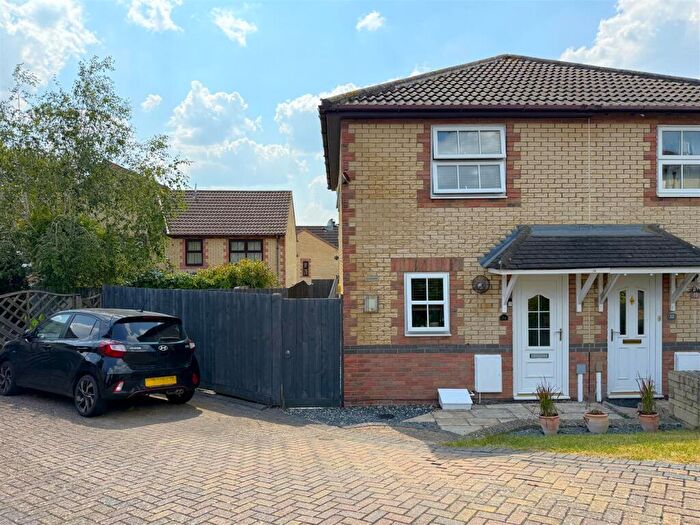
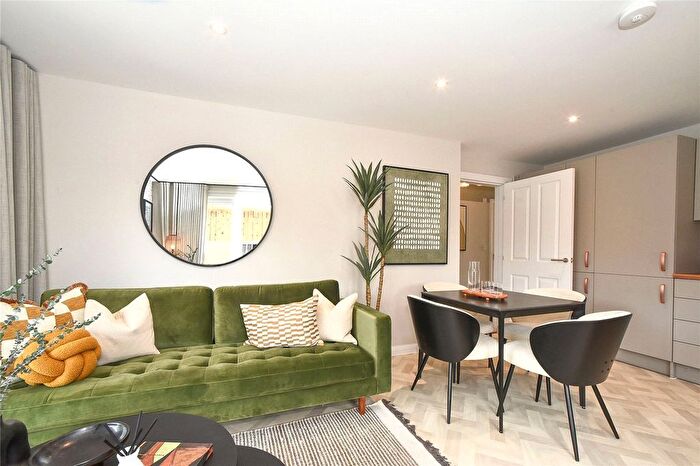
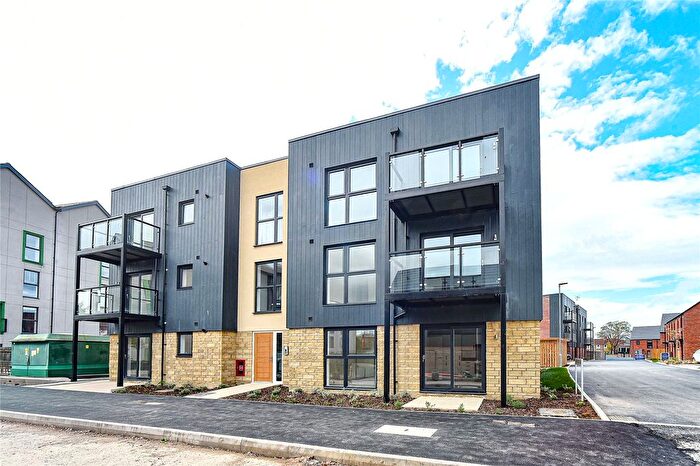
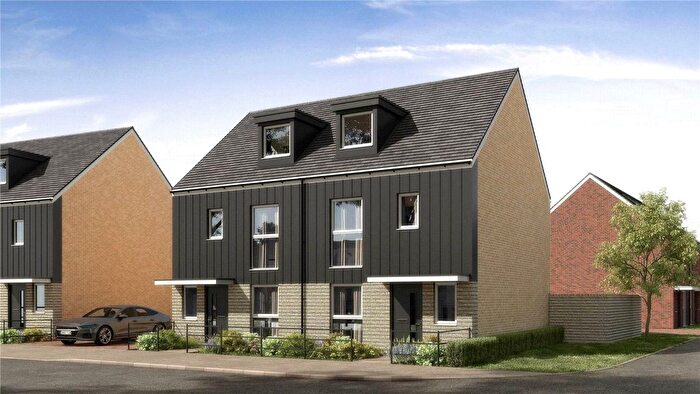
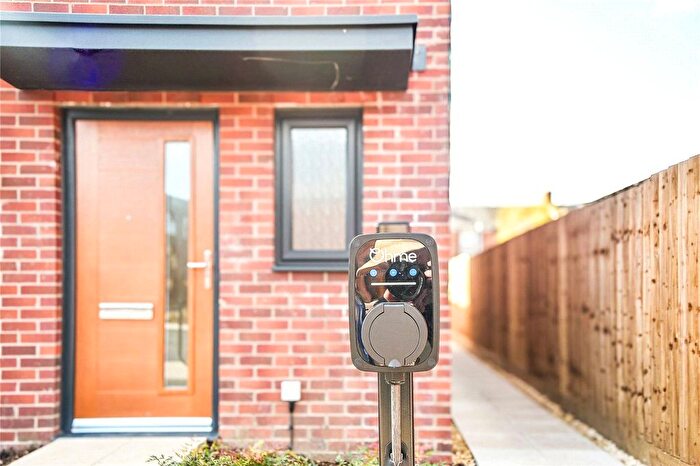
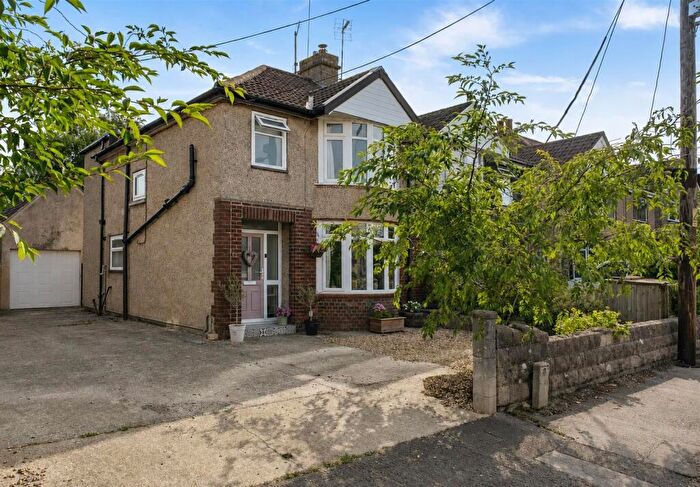
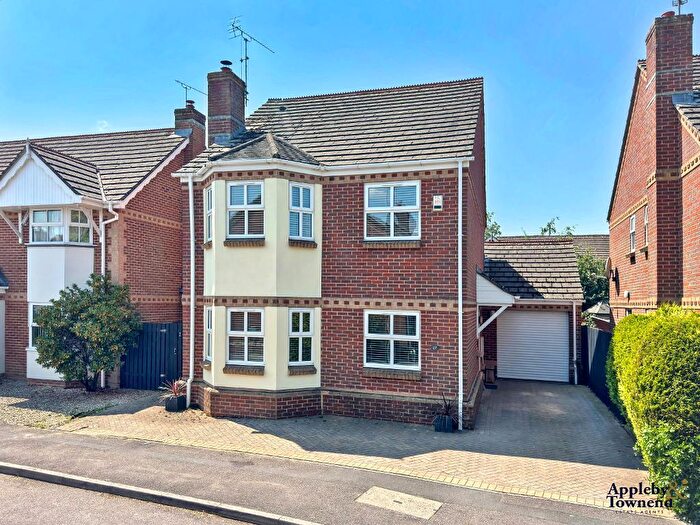
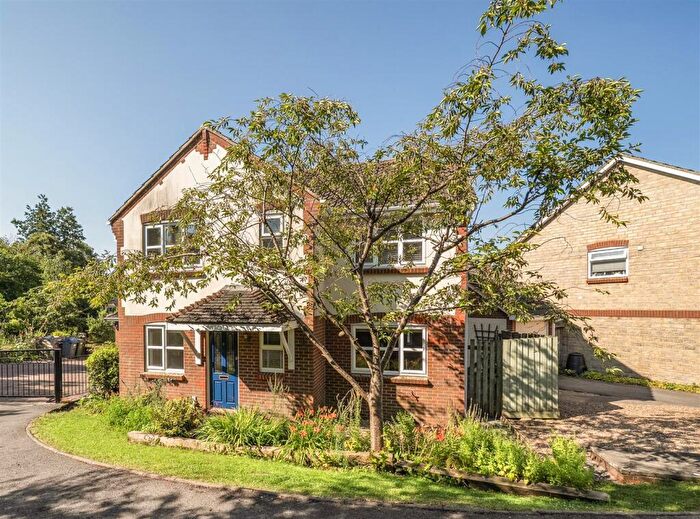
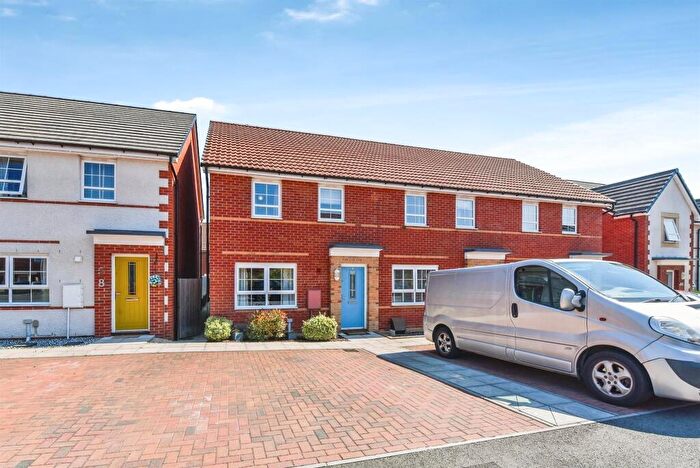
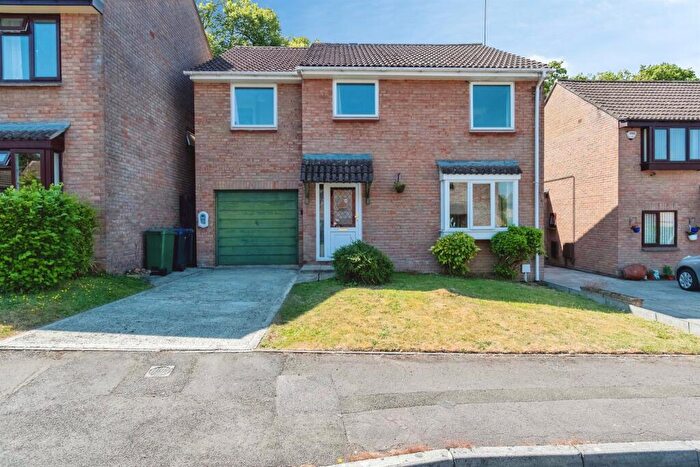
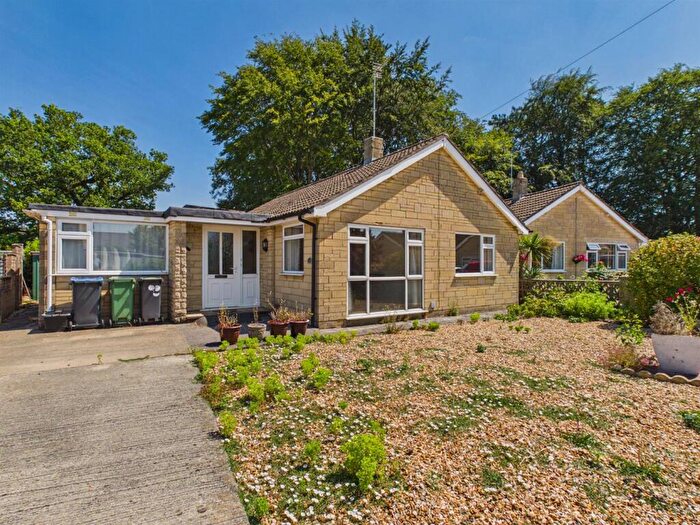
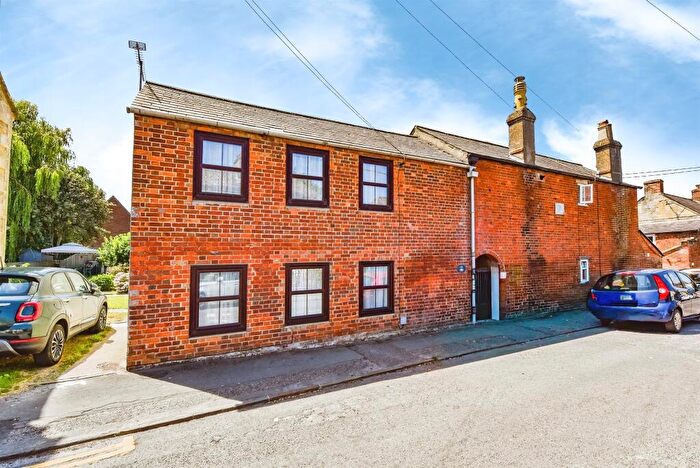
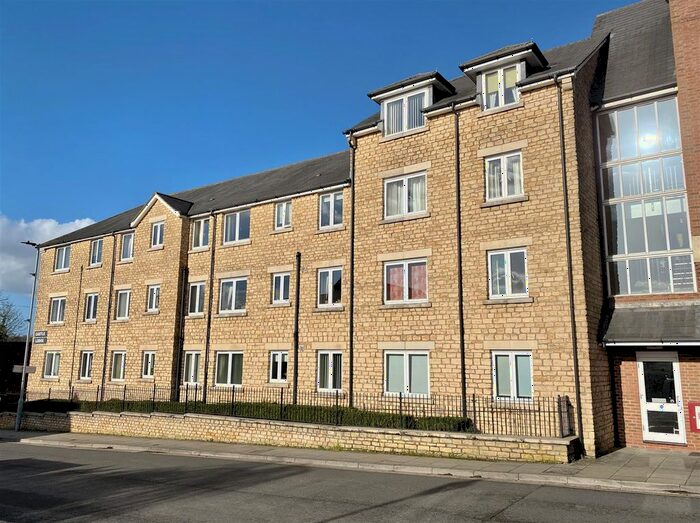
Properties for sale in Chippenham
![]()
If you are looking to sell your house, let it out, or receive a property valuation, an expert can help you.
Click the button below to get started.
Neighbourhoods in Chippenham
Navigate through our locations to find the location of your next house in Chippenham, Wiltshire for sale or to rent.
- Corsham Town
- Box And Colerne
- Brinkworth
- Bromham, Rowde And Potterne
- By Brook
- Calne Rural
- Chippenham Cepen Park And Derriads
- Chippenham Cepen Park And Redlands
- Chippenham Hardenhuish
- Chippenham Hardens And England
- Chippenham Lowden And Rowden
- Chippenham Monkton
- Chippenham Pewsham
- Chippenham Queens And Sheldon
- Corsham Without And Box Hill
- Kington
- Lyneham
- Melksham Without North
- Royal Wootton Bassett East
- Sherston
- Chippenham Cepen Park & Hunters Moon
- Chippenham Cepen Park & Derriads
Property price trends in Chippenham
According to the latest Land Registry data, the average home in Chippenham sold for £350,086 in 2026. That figure comes from a substantial record of 34,294 sales logged over the past 31 years.
Prices have fallen back over the last three years. Compared with 2023, when the typical sale came in around £376,548, that's a fall of roughly 7%.
Looking back five years, average prices are up about 3.2% since 2021, a gain of around £10,968 in cash terms.
Zoom out to the past decade for the fuller picture. Back in 2016, homes here averaged £276,276, so the typical sold price has climbed about 26.7% since then, roughly 2.4% a year. Stretch the view to fifteen years and that annual pace holds at about 2.2%.
Frequently asked questions about Chippenham
What is the average price for a property for sale in Chippenham?
The average price for a property for sale in Chippenham is £367,790. This amount is 0.92% higher than the average price in Wiltshire. There are more than 10,000 property listings for sale in Chippenham.
What locations have the most expensive properties for sale in Chippenham?
The locations with the most expensive properties for sale in Chippenham are By Brook at an average of £628,268, Sherston at an average of £603,055 and Brinkworth at an average of £581,096.
What locations have the most affordable properties for sale in Chippenham?
The locations with the most affordable properties for sale in Chippenham are Chippenham Hardens And England at an average of £263,009, Chippenham Pewsham at an average of £264,079 and Chippenham Queens And Sheldon at an average of £272,808.
Which train stations are available in or near Chippenham?
Some of the train stations available in or near Chippenham are Chippenham, Melksham and Bradford-On-Avon.
Property Price Paid in Chippenham by Year
The average sold property price by year was:
| Year | Average Sold Price | Price Change |
Sold Properties
|
|---|---|---|---|
| 2026 | £350,086 | -3% |
77 Properties |
| 2025 | £360,850 | -2% |
830 Properties |
| 2024 | £367,803 | -2% |
890 Properties |
| 2023 | £376,548 | -0,3% |
812 Properties |
| 2022 | £377,810 | 10% |
1,025 Properties |
| 2021 | £339,118 | 3% |
1,275 Properties |
| 2020 | £329,601 | 8% |
807 Properties |
| 2019 | £301,697 | -2% |
904 Properties |
| 2018 | £309,195 | 6% |
909 Properties |
| 2017 | £291,353 | 5% |
971 Properties |
Property Price per Property Type in Chippenham
Here you can find historic sold price data in order to help with your property search.
The average Property Paid Price for specific property types in the last three years are:
| Property Type | Average Sold Price | Sold Properties |
|---|---|---|
| Semi Detached House | £322,056.00 | 775 Semi Detached Houses |
| Terraced House | £264,486.00 | 707 Terraced Houses |
| Detached House | £567,264.00 | 841 Detached Houses |
| Flat | £160,523.00 | 286 Flats |
Transport in Chippenham
Please see below transportation links in this area:
