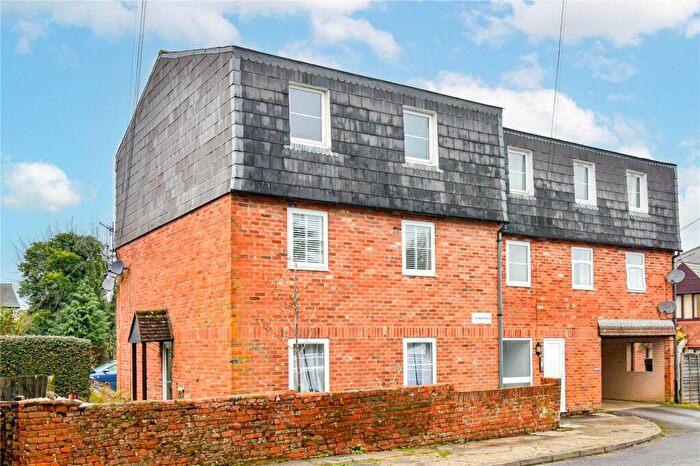
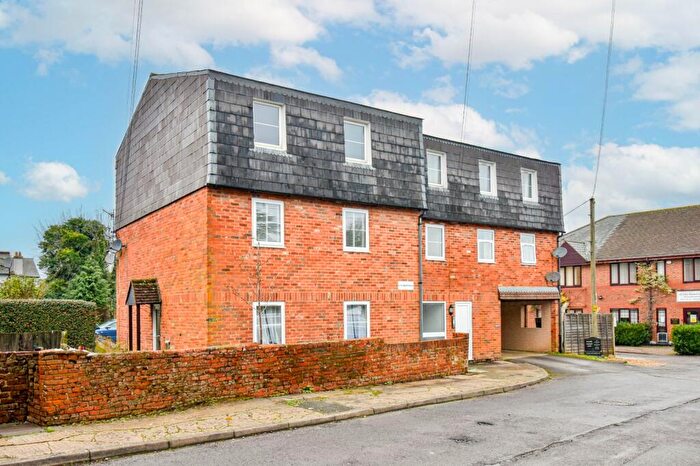
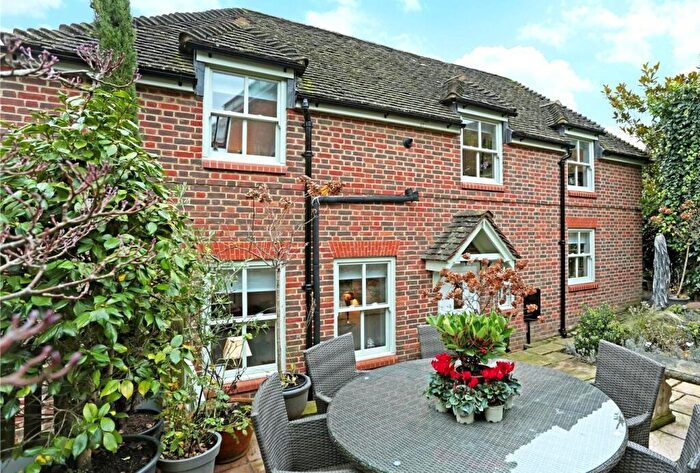
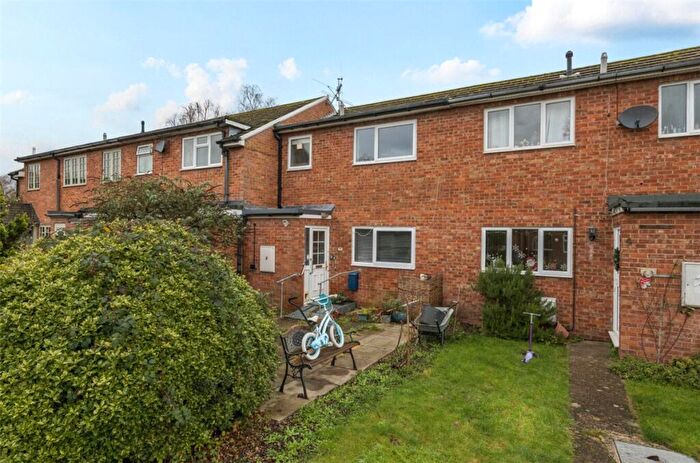
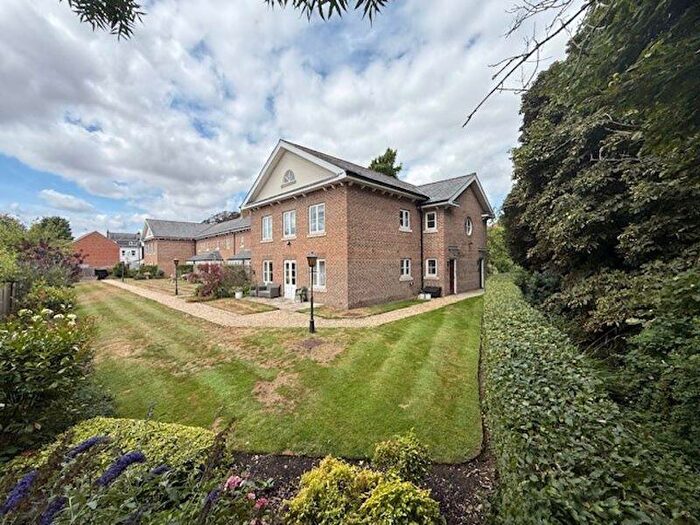
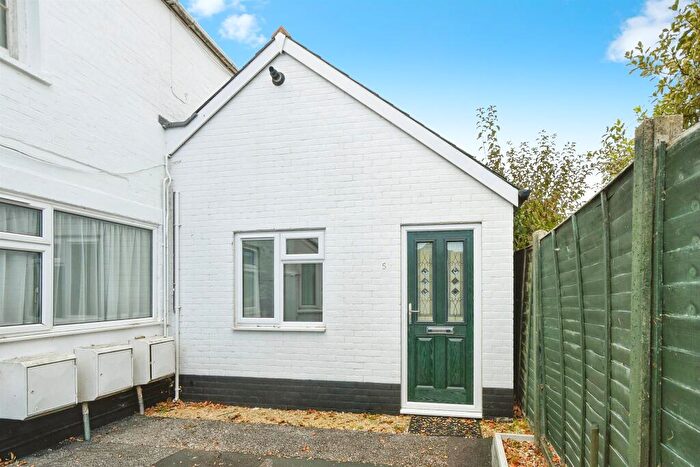
Houses for sale & to rent in Marlborough East, Marlborough
House Prices in Marlborough East
Properties in Marlborough East have an average house price of £370,981.00 and had 159 Property Transactions within the last 3 years¹.
Marlborough East is an area in Marlborough, Wiltshire with 1,784 households², where the most expensive property was sold for £900,000.00.
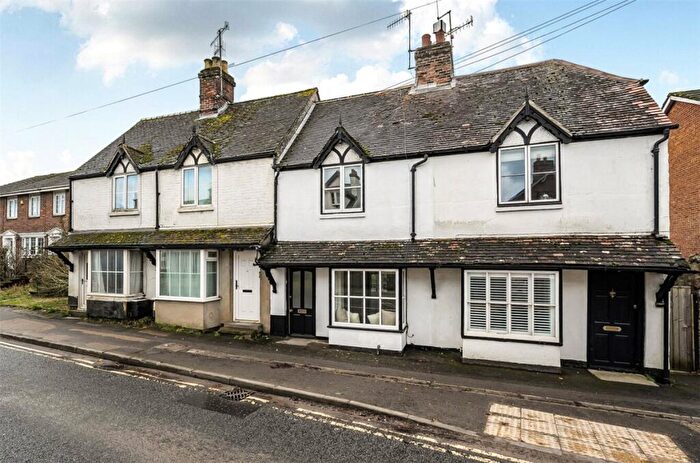
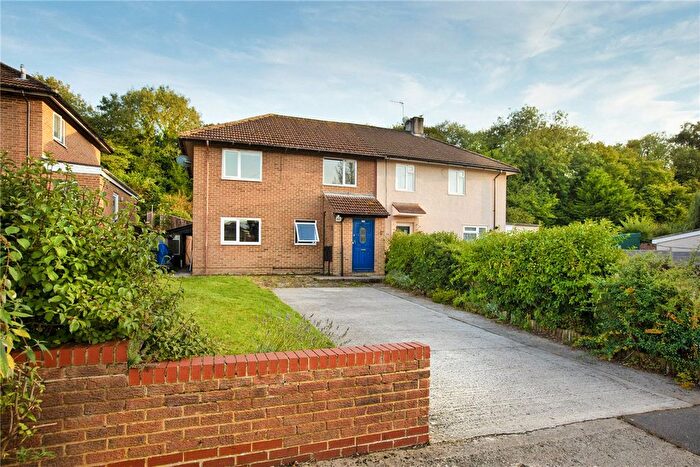
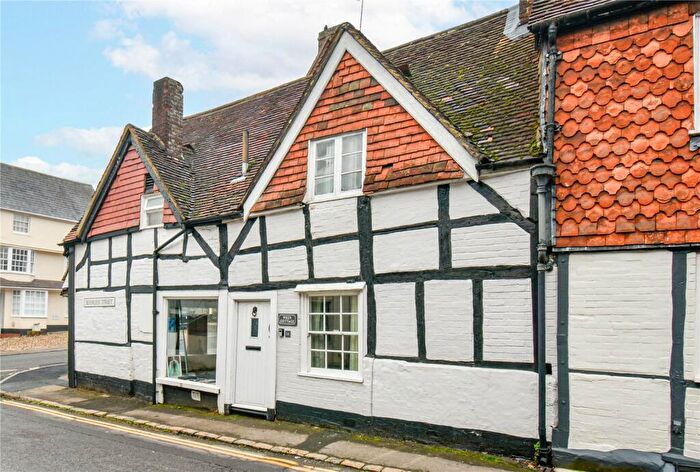
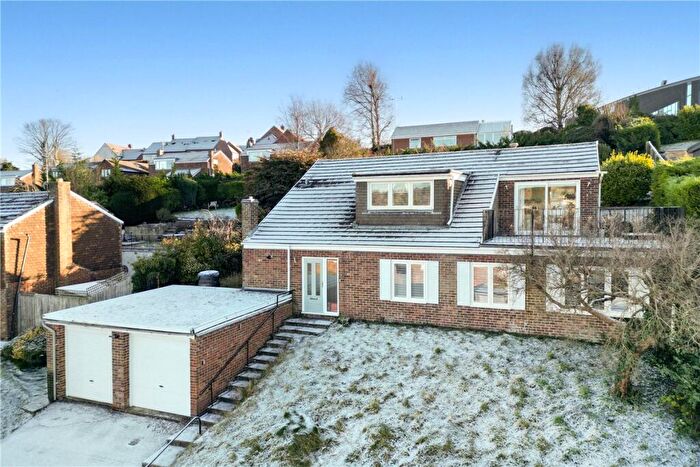
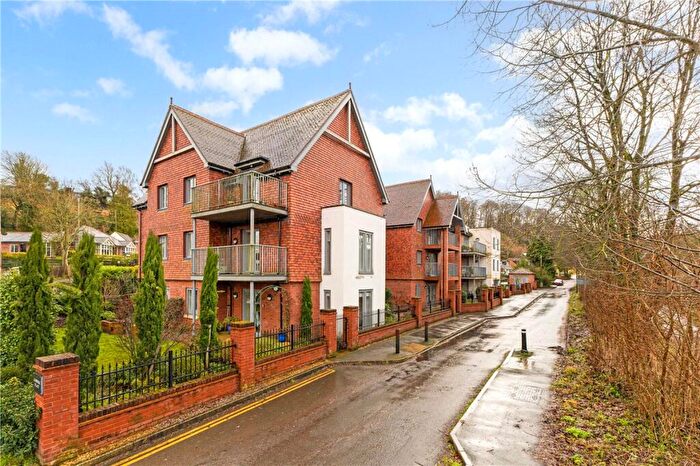
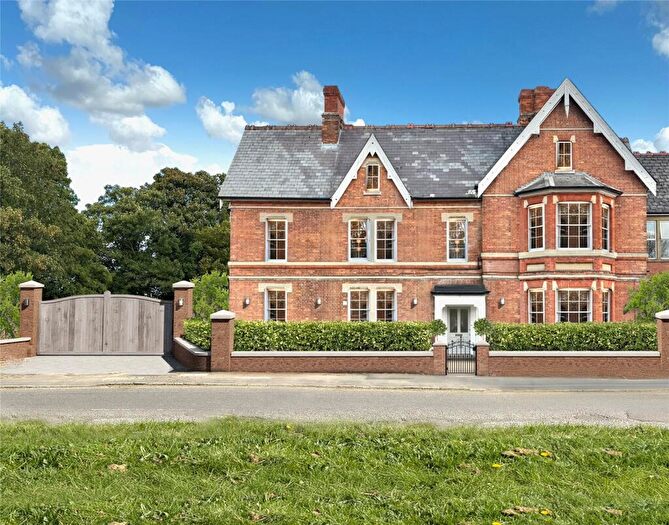
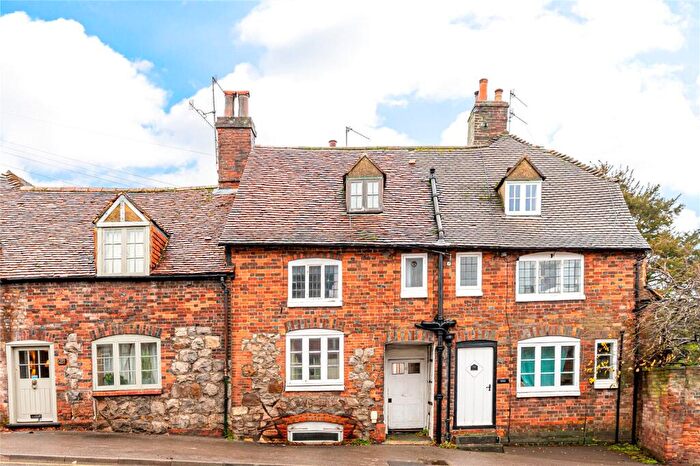
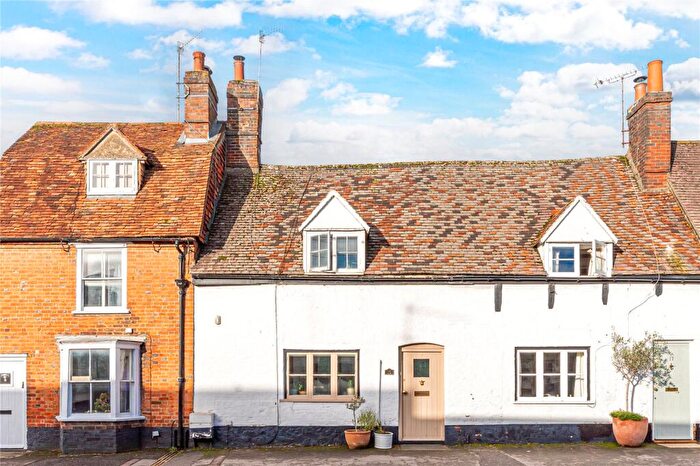
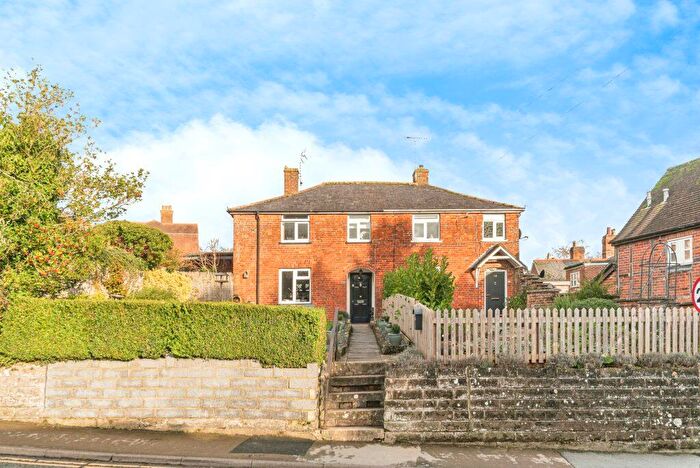
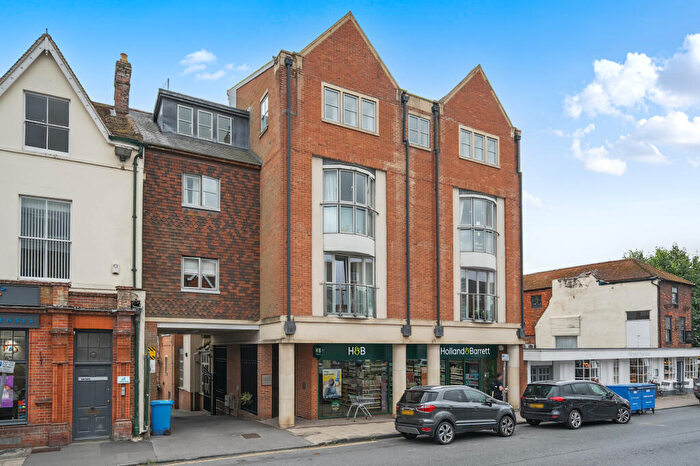
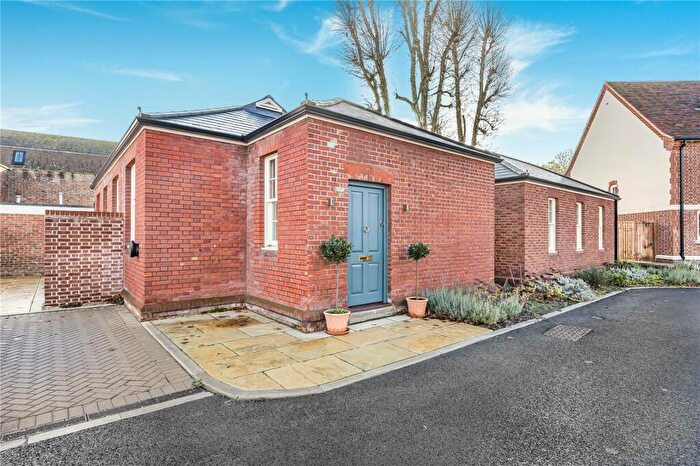
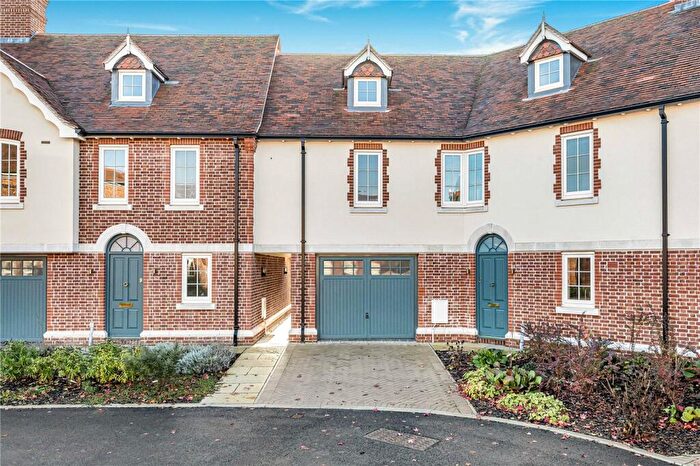
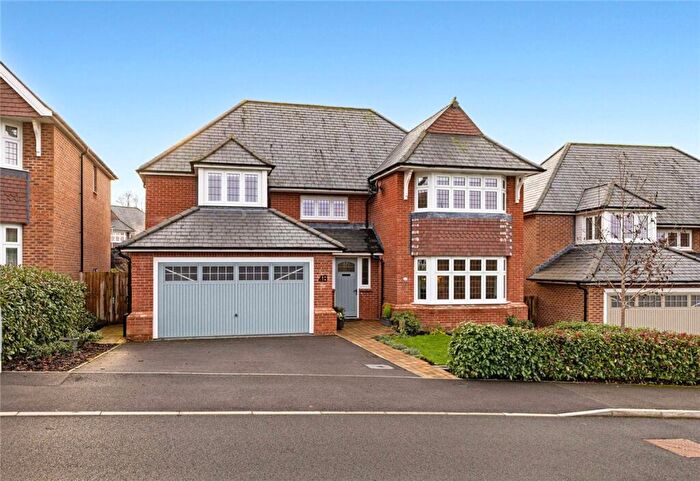
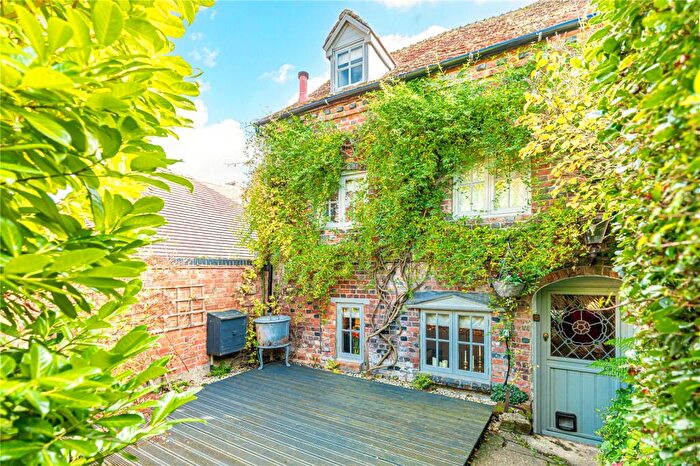
Properties for sale in Marlborough East
Roads and Postcodes in Marlborough East
Navigate through our locations to find the location of your next house in Marlborough East, Marlborough for sale or to rent.
| Streets | Postcodes |
|---|---|
| Alexandra Terrace | SN8 1DA |
| Barn Street | SN8 1AJ |
| Barnfield | SN8 2AX |
| Barrow Close | SN8 2BD SN8 2BE |
| Baylie Acre | SN8 1BG |
| Baywater | SN8 1DX |
| Blenheim Road | SN8 4AP SN8 4FA |
| Blowhorn Street | SN8 1BT SN8 1BU |
| Chapter Close | SN8 2BF |
| Chiminage Close | SN8 1BW |
| Chopping Knife Lane | SN8 2FA |
| Coldharbour Lane | SN8 1BJ SN8 1BN |
| Cornerfields | SN8 2BN |
| Cunetio Gardens | SN8 2FD |
| Elcot Close | SN8 2BB |
| Elcot Lane | SN8 2AZ SN8 2BA SN8 2BG SN8 2AY |
| Elcot Orchard | SN8 2BJ |
| Elizabeth Close | SN8 4BP |
| Elsie Knocker Grove | SN8 4YN |
| Five Stiles Road | SN8 4BB SN8 4BD SN8 4BE SN8 4BG |
| Forest Dale Road | SN8 2AS |
| Francklyn Acre | SN8 1DP |
| Gales Ground | SN8 2RS |
| Glympton Court | SN8 4AL |
| Hazel Close | SN8 2AD |
| Herd Street | SN8 1DG SN8 1UN |
| Hertford Court | SN8 4AW |
| Hertford Road | SN8 4FD |
| Homefields | SN8 4BQ |
| Homefields Close | SN8 4FQ |
| Kelham Gardens | SN8 1LD SN8 1PW |
| Laineys Close | SN8 1BP SN8 1BS |
| Lansdown Place | SN8 1DE |
| Laurel Drive | SN8 2SH |
| Lawrence Acre | SN8 1DT |
| Leaf Close | SN8 1DB |
| London Road | SN8 1BA SN8 1PH SN8 2AA SN8 2AJ SN8 2AN SN8 2AP SN8 2AR SN8 2AF SN8 2FN SN8 2RN |
| Lower Prospect Place | SN8 1BZ |
| Manor Lane | SN8 2BQ |
| Minal View | SN8 2AT |
| Mount Pleasant | SN8 1BX |
| Newby Acre | SN8 1DW |
| North View Place | SN8 1BL |
| Pelhams Court | SN8 2AG |
| Pipers Piece | SN8 1DJ |
| Police Houses | SN8 4BL |
| Portfields Road | SN8 1EY |
| Poulton Crescent | SN8 1BH |
| Poulton Hill | SN8 1AZ |
| Priorsfield | SN8 4AQ |
| Priory Court | SN8 4FE |
| Prospect Place | SN8 1BY |
| Purlyn Acre | SN8 1DR |
| Queens Way | SN8 4BH |
| Rabley Wood View | SN8 1EP SN8 1ER |
| Rawlingswell Lane | SN8 1AU |
| Reeds Corner | SN8 2RR |
| Reeds Ground | SN8 2AW |
| Roebuck Meadow | SN8 2AL |
| Rogers Meadow | SN8 1DZ |
| Salisbury Road | SN8 4AE |
| Savernake Court | SN8 4AG |
| Savernake Crescent | SN8 4BJ |
| South View Place | SN8 1DD |
| St Margarets Mead | SN8 4AZ SN8 4BA SN8 4BF |
| St Martins | SN8 1AR SN8 1AS |
| Stonebridge Close | SN8 2AE |
| Stonebridge Lane | SN8 1AX |
| The Green | SN8 1AL |
| The Thorns | SN8 1DY |
| Tin Pit | SN8 1BD SN8 1BQ |
| Vespasian Road | SN8 2FB |
| Vicarage Close | SN8 1AY |
| White Horse Road | SN8 2FE |
| Willow Close | SN8 2BH |
| Wolsey Close | SN8 1EZ |
| Woodstock Court | SN8 4AN |
| Wye House Gardens | SN8 1AB |
| Wye Lane | SN8 1PJ |
| York Place | SN8 1AT |
| SN8 2FP SN8 4FL |
Transport near Marlborough East
- FAQ
- Price Paid By Year
- Property Type Price
Frequently asked questions about Marlborough East
What is the average price for a property for sale in Marlborough East?
The average price for a property for sale in Marlborough East is £370,981. This amount is 31% lower than the average price in Marlborough. There are 537 property listings for sale in Marlborough East.
What streets have the most expensive properties for sale in Marlborough East?
The streets with the most expensive properties for sale in Marlborough East are Poulton Crescent at an average of £740,000, Poulton Hill at an average of £620,000 and Elcot Close at an average of £580,000.
What streets have the most affordable properties for sale in Marlborough East?
The streets with the most affordable properties for sale in Marlborough East are Kelham Gardens at an average of £114,772, Rabley Wood View at an average of £190,000 and Lower Prospect Place at an average of £241,500.
Which train stations are available in or near Marlborough East?
Some of the train stations available in or near Marlborough East are Pewsey, Bedwyn and Hungerford.
Property Price Paid in Marlborough East by Year
The average sold property price by year was:
| Year | Average Sold Price | Price Change |
Sold Properties
|
|---|---|---|---|
| 2025 | £393,271 | 14% |
55 Properties |
| 2024 | £338,687 | -11% |
48 Properties |
| 2023 | £376,768 | -12% |
56 Properties |
| 2022 | £422,740 | 14% |
68 Properties |
| 2021 | £361,919 | -10% |
71 Properties |
| 2020 | £397,530 | 11% |
57 Properties |
| 2019 | £352,860 | 9% |
67 Properties |
| 2018 | £321,049 | -9% |
74 Properties |
| 2017 | £350,777 | 1% |
90 Properties |
| 2016 | £346,454 | 8% |
81 Properties |
| 2015 | £319,354 | 5% |
81 Properties |
| 2014 | £303,656 | 13% |
66 Properties |
| 2013 | £264,952 | -5% |
74 Properties |
| 2012 | £277,896 | 5% |
83 Properties |
| 2011 | £263,591 | -7% |
74 Properties |
| 2010 | £281,821 | 15% |
79 Properties |
| 2009 | £240,083 | -6% |
48 Properties |
| 2008 | £253,845 | -9% |
50 Properties |
| 2007 | £275,557 | 12% |
67 Properties |
| 2006 | £242,856 | 7% |
104 Properties |
| 2005 | £226,176 | 11% |
66 Properties |
| 2004 | £200,530 | -7% |
80 Properties |
| 2003 | £214,697 | 5% |
78 Properties |
| 2002 | £203,195 | 7% |
94 Properties |
| 2001 | £188,306 | 20% |
103 Properties |
| 2000 | £150,510 | 15% |
72 Properties |
| 1999 | £127,898 | 30% |
106 Properties |
| 1998 | £89,532 | 6% |
54 Properties |
| 1997 | £84,340 | 3% |
85 Properties |
| 1996 | £81,988 | 8% |
65 Properties |
| 1995 | £75,120 | - |
55 Properties |
Property Price per Property Type in Marlborough East
Here you can find historic sold price data in order to help with your property search.
The average Property Paid Price for specific property types in the last three years are:
| Property Type | Average Sold Price | Sold Properties |
|---|---|---|
| Semi Detached House | £400,419.00 | 43 Semi Detached Houses |
| Detached House | £565,905.00 | 28 Detached Houses |
| Terraced House | £316,051.00 | 63 Terraced Houses |
| Flat | £240,453.00 | 25 Flats |

