
Houses for sale in Marlborough, Wiltshire
House Prices in Marlborough
Properties in Marlborough have an average house price of £536k and had 846 Property Transactions within the last 3 years.¹
Marlborough is an area in Wiltshire with 10,387 households², where the most expensive property was sold for £11M.
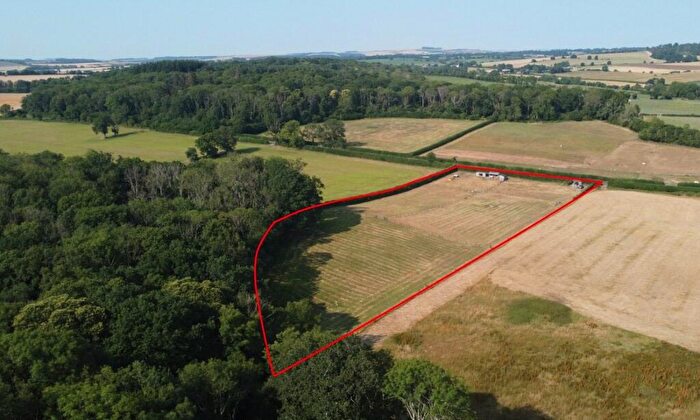
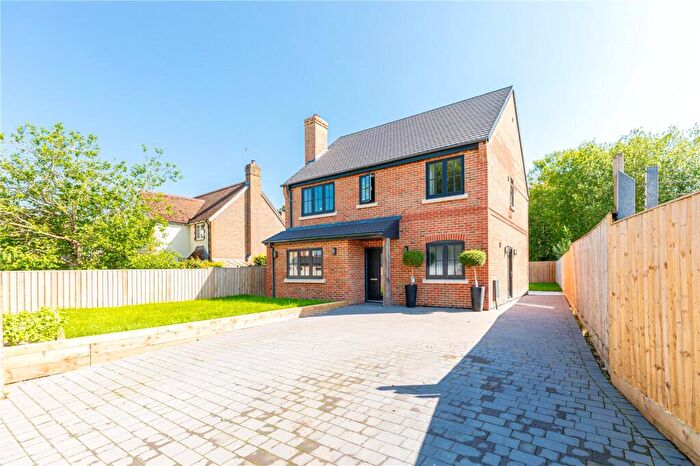
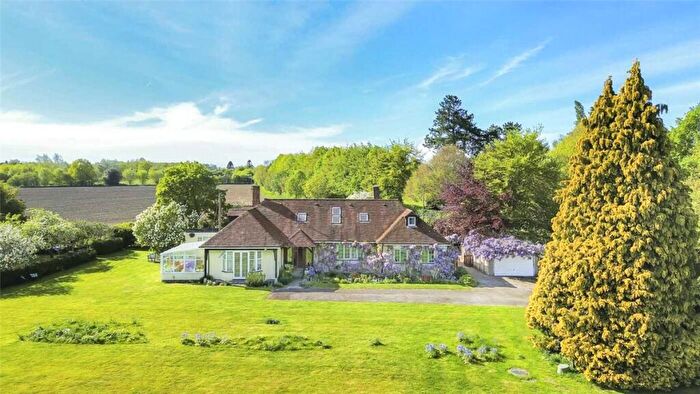
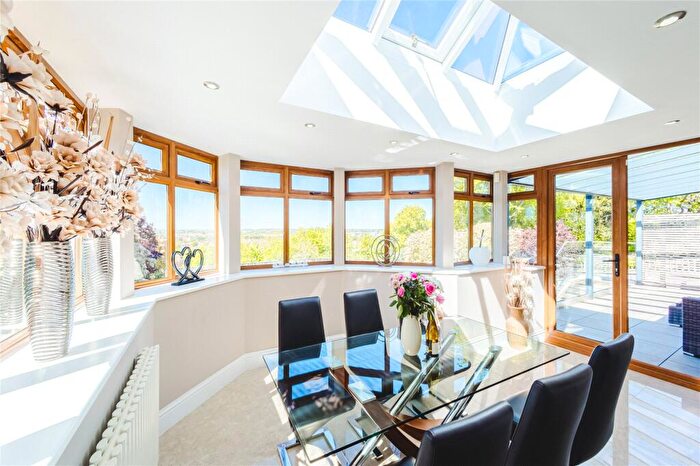
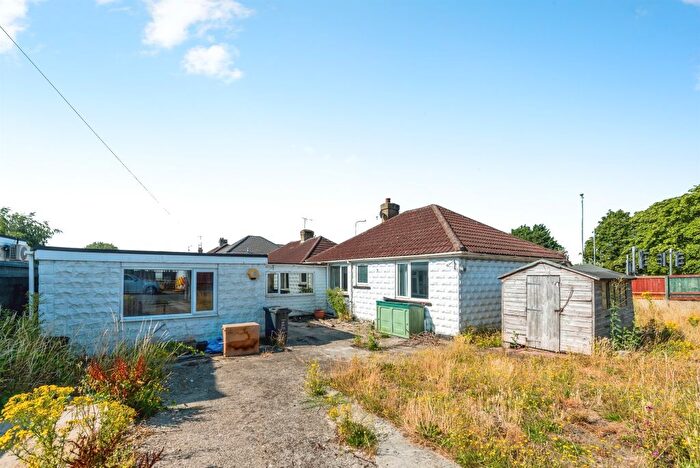
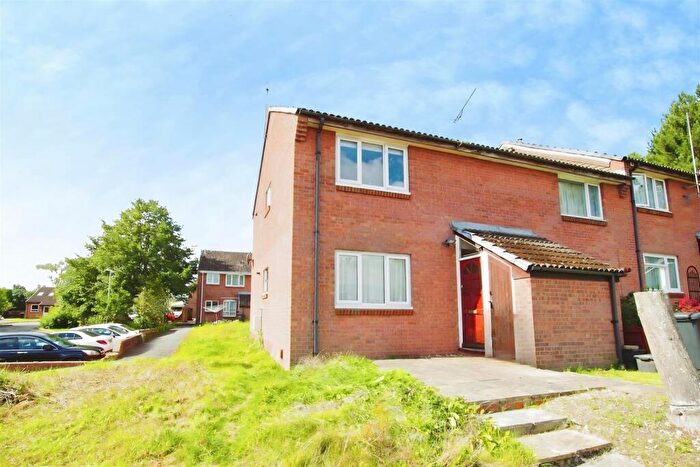
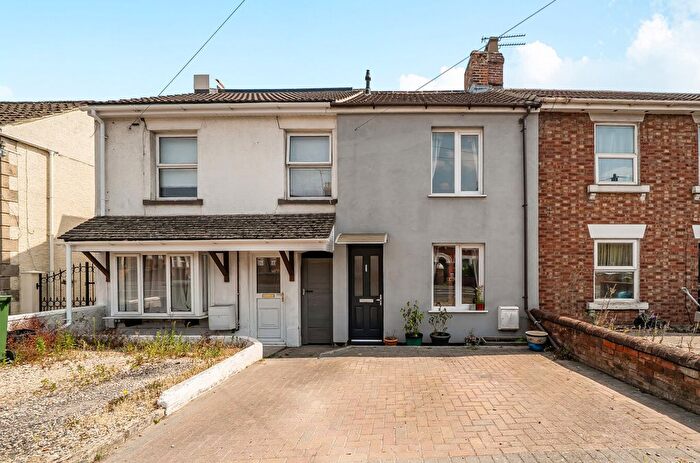
Properties for sale in Marlborough
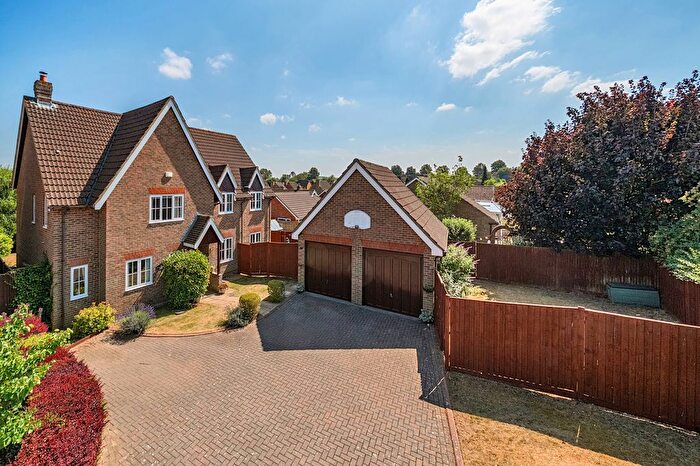
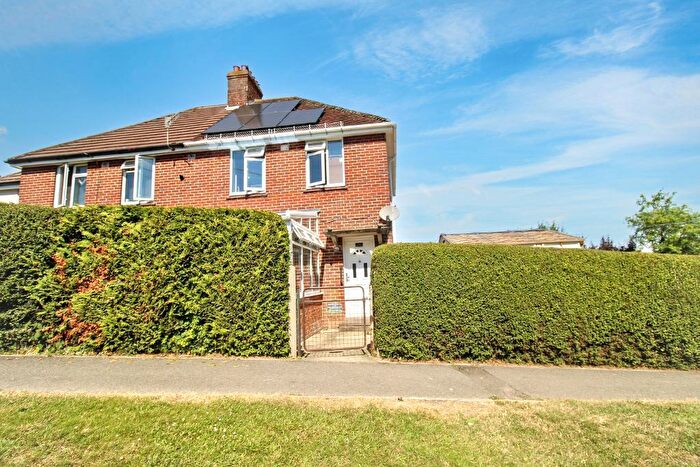
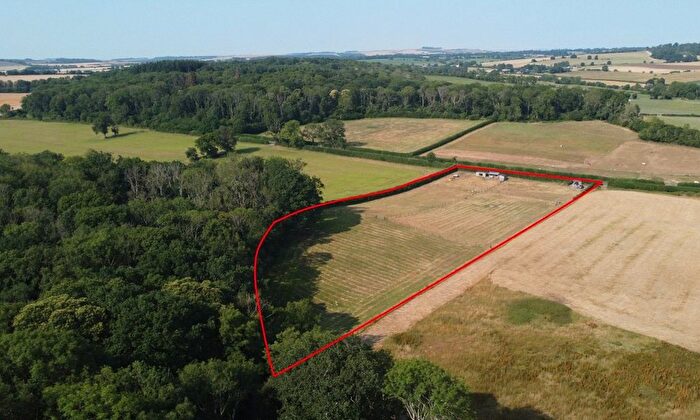
![]()
If you are looking to sell your house, let it out, or receive a property valuation, an expert can help you.
Click the button below to get started.


Neighbourhoods in Marlborough
Navigate through our locations to find the location of your next house in Marlborough, Wiltshire for sale or to rent.
Property price trends in Marlborough
According to the latest Land Registry data, the average home in Marlborough sold for £455,500 in 2026. That figure comes from a substantial record of 12,072 sales logged over the past 31 years.
Prices have fallen back over the last three years. Compared with 2023, when the typical sale came in around £568,616, that's a fall of roughly 19.9%.
Looking back five years, average prices are down about 14% since 2021, a drop of around £74,424 in cash terms.
Zoom out to the past decade for the fuller picture. Back in 2016, homes here averaged £435,045, so the typical sold price has climbed about 4.7% since then, roughly 0.5% a year. Stretch the view to fifteen years and that annual pace edges up closer to 1.3%.
Frequently asked questions about Marlborough
What is the average price for a property for sale in Marlborough?
The average price for a property for sale in Marlborough is £536,250. This amount is 47% higher than the average price in Wiltshire. There are more than 10,000 property listings for sale in Marlborough.
What locations have the most expensive properties for sale in Marlborough?
The locations with the most expensive properties for sale in Marlborough are West Selkley at an average of £654,925, Burbage And The Bedwyns at an average of £651,659 and Pewsey Vale at an average of £651,055.
What locations have the most affordable properties for sale in Marlborough?
The locations with the most affordable properties for sale in Marlborough are Marlborough East at an average of £372,376, The Collingbournes And Netheravon at an average of £465,523 and Marlborough West at an average of £476,257.
Which train stations are available in or near Marlborough?
Some of the train stations available in or near Marlborough are Bedwyn, Pewsey and Hungerford.
Property Price Paid in Marlborough by Year
The average sold property price by year was:
| Year | Average Sold Price | Price Change |
Sold Properties
|
|---|---|---|---|
| 2026 | £455,500 | -9% |
22 Properties |
| 2025 | £496,383 | -11% |
278 Properties |
| 2024 | £550,858 | -3% |
271 Properties |
| 2023 | £568,616 | 4% |
275 Properties |
| 2022 | £544,153 | 3% |
383 Properties |
| 2021 | £529,924 | 6% |
544 Properties |
| 2020 | £497,315 | 11% |
294 Properties |
| 2019 | £441,510 | 0,3% |
341 Properties |
| 2018 | £440,067 | -1% |
324 Properties |
| 2017 | £444,238 | 2% |
397 Properties |
Property Price per Property Type in Marlborough
Here you can find historic sold price data in order to help with your property search.
The average Property Paid Price for specific property types in the last three years are:
| Property Type | Average Sold Price | Sold Properties |
|---|---|---|
| Semi Detached House | £423,929.00 | 205 Semi Detached Houses |
| Detached House | £781,301.00 | 344 Detached Houses |
| Terraced House | £376,603.00 | 203 Terraced Houses |
| Flat | £229,194.00 | 94 Flats |
Transport in Marlborough
Please see below transportation links in this area:
