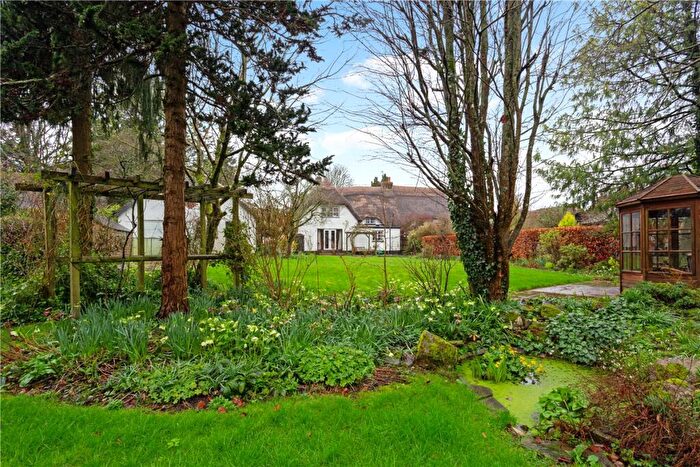
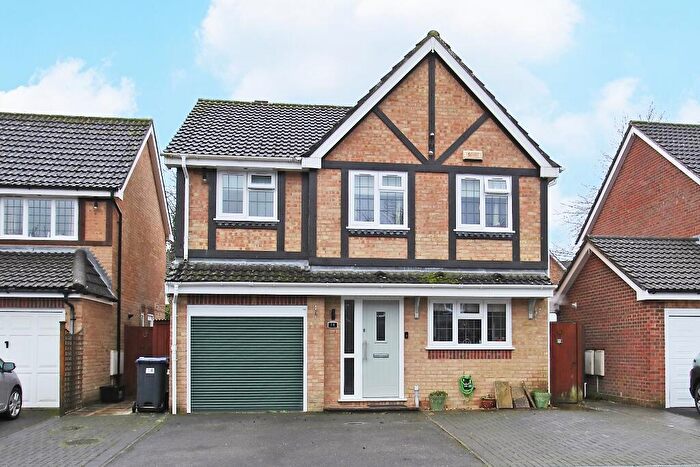
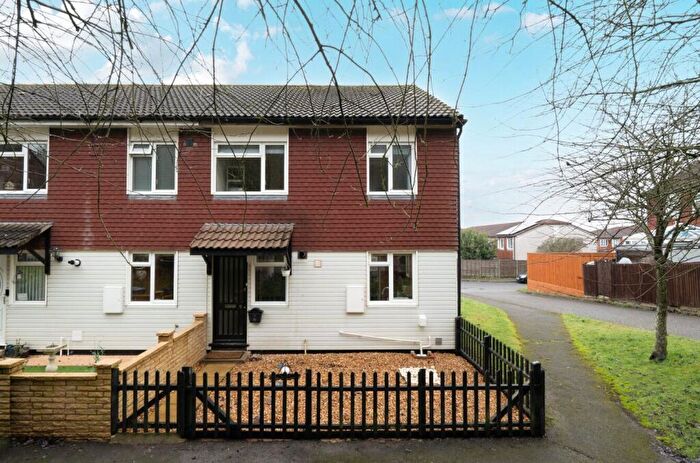
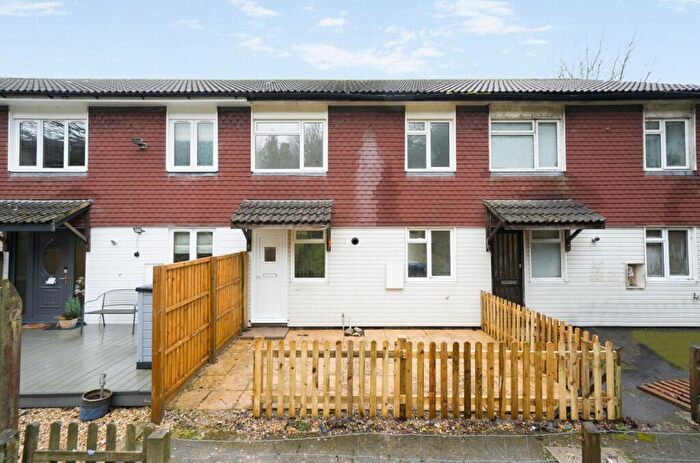
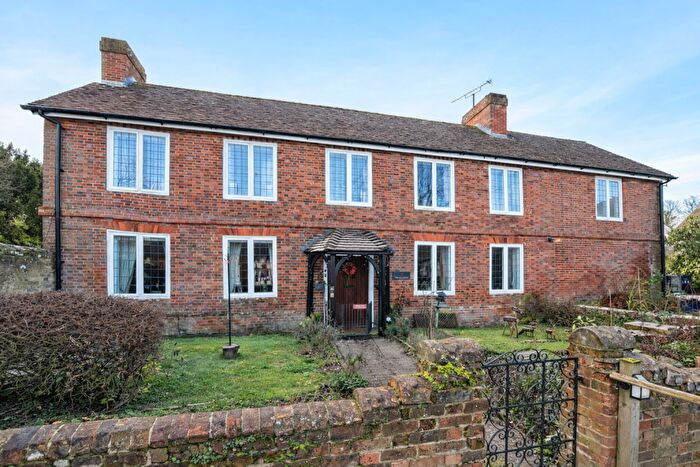
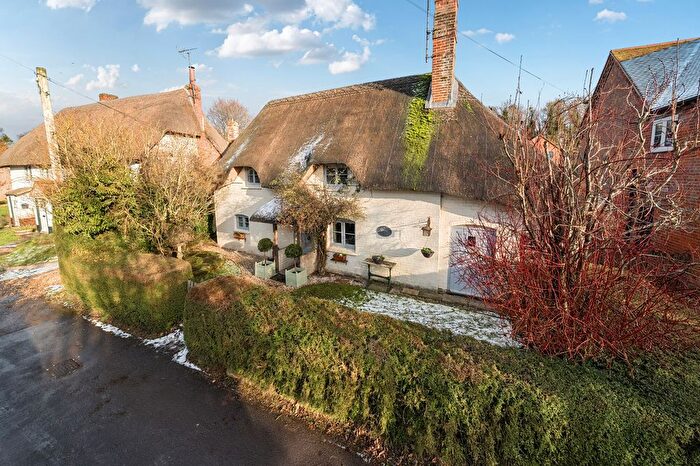
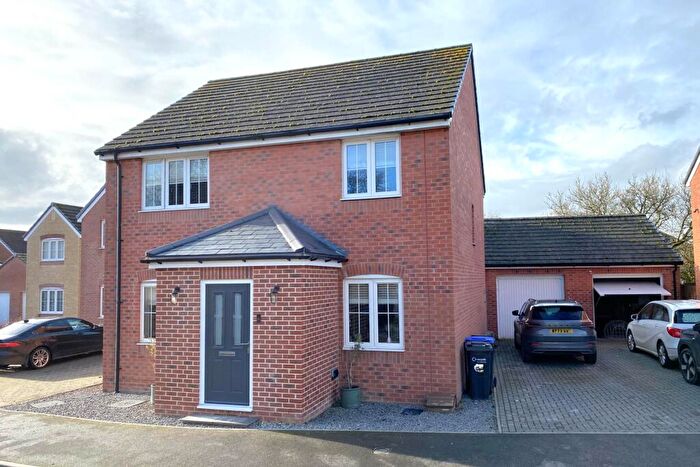
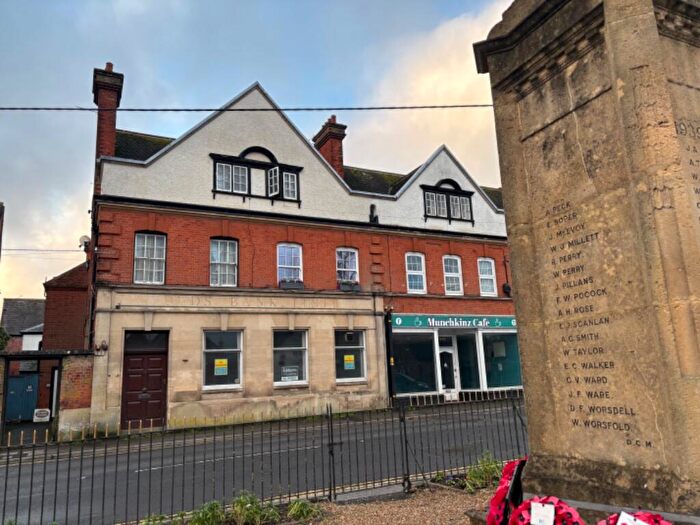
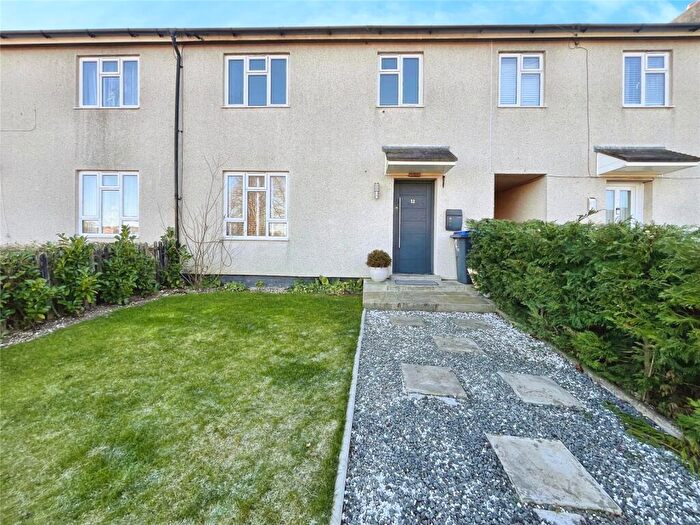
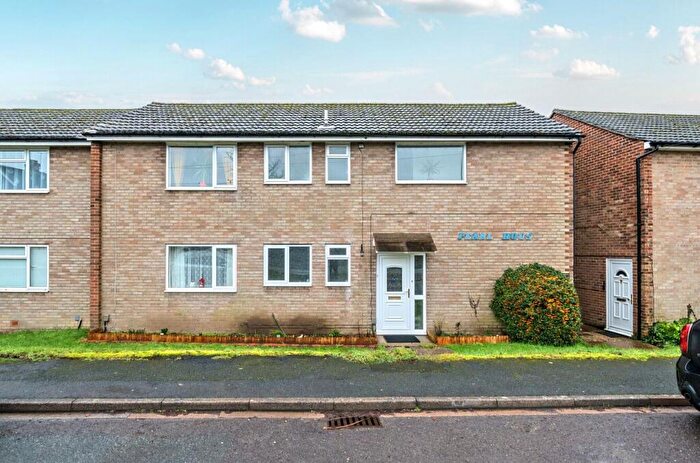
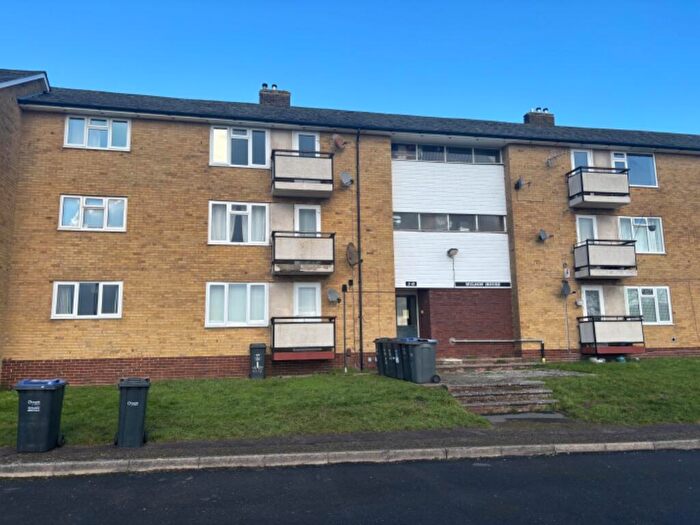
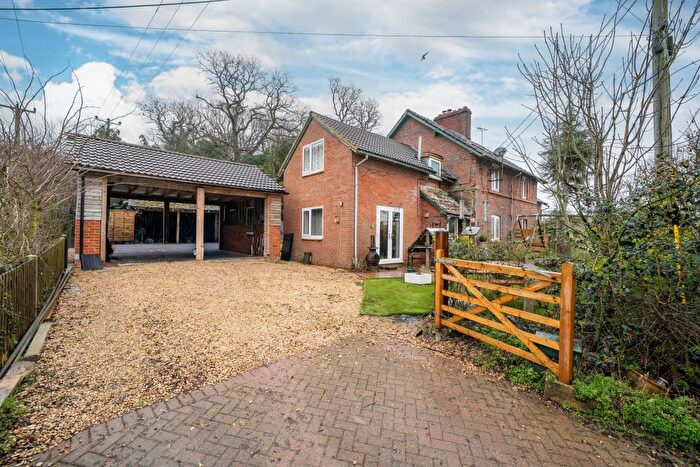
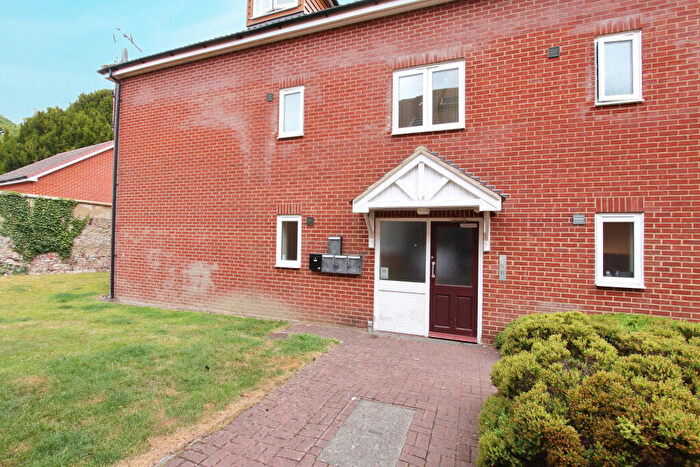
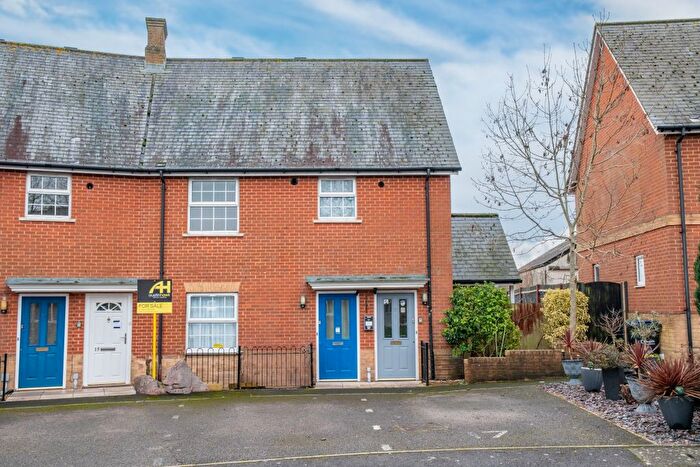
Houses for sale & to rent in The Collingbournes And Netheravon, Marlborough
House Prices in The Collingbournes And Netheravon
Properties in The Collingbournes And Netheravon have an average house price of £468,180.00 and had 55 Property Transactions within the last 3 years¹.
The Collingbournes And Netheravon is an area in Marlborough, Wiltshire with 688 households², where the most expensive property was sold for £1,600,000.00.
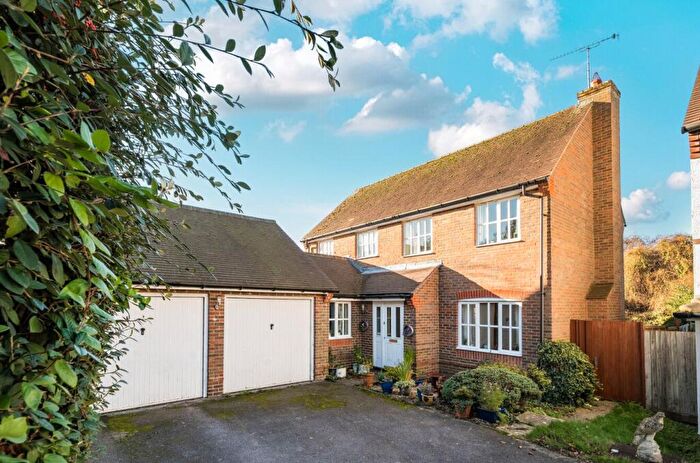
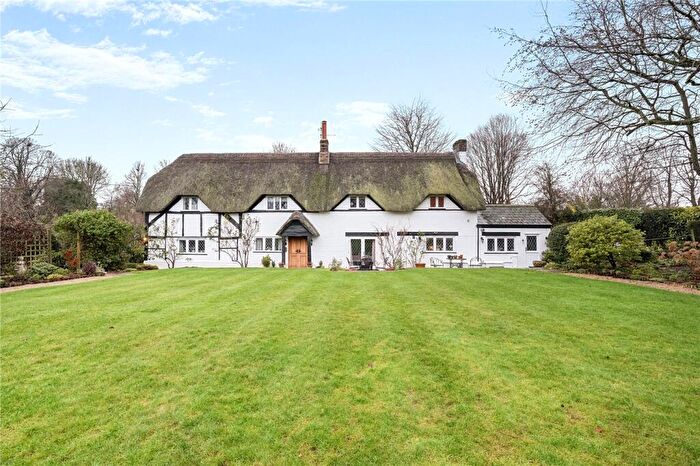
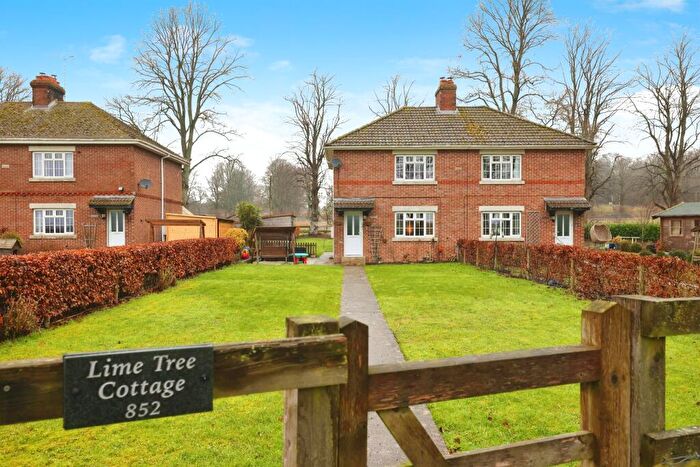
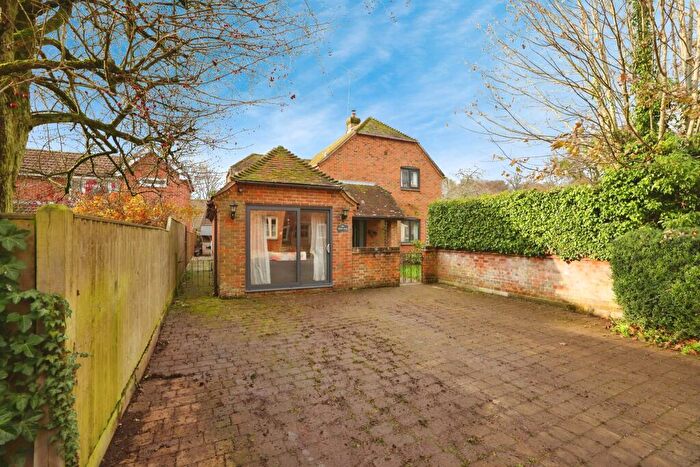
Properties for sale in The Collingbournes And Netheravon
Roads and Postcodes in The Collingbournes And Netheravon
Navigate through our locations to find the location of your next house in The Collingbournes And Netheravon, Marlborough for sale or to rent.
| Streets | Postcodes |
|---|---|
| Aughton | SN8 3RY SN8 3RZ SN8 3SA |
| Bourne Rise | SN8 3HG |
| Brunton | SN8 3SE |
| Cadley Road | SN8 3EA SN8 3EB |
| Chicks Lane | SN8 3UH |
| Church Street | SN8 3EL SN8 3FJ SN8 3FN |
| Cuckoo Pen Close | SN8 3SX |
| Everleigh Road | SN8 3EW SN8 3FE |
| Gilberts Piece | SN8 3HH |
| Ham Close | SN8 3SB |
| Herridge | SN8 3EG SN8 3FL |
| High Street | SN8 3EQ |
| Hightrees | SN8 3EZ |
| Ludgershall Road | SN8 3EJ |
| Mill Drove | SN8 3SY |
| Parsonage Vale | SN8 3SZ |
| Penny Hill | SN8 3HJ |
| Pigleaze Cottages | SN8 3HB |
| Riverbourne Road | SN8 3FH |
| Saunders Meadow | SN8 3FA |
| Saxon Rise | SN8 3HQ |
| South View | SN8 3SF |
| Sunnyhill | SN8 3EP |
| Sunton | SN8 3DY SN8 3DZ |
| Sydney Gardens | SN8 3HA |
| The Knapp Close | SN8 3ES |
| Tidworth Road | SN8 3ER |
| Tinkerbarn | SN8 3SG |
| West Farm Close | SN8 3DU |
| SN8 3EU SN8 3EX SN8 3EY SN8 3HD SN8 3HE SN8 3NJ SN8 3NL SN8 3NN SN8 3SD SN8 3ED SN8 3EE SN8 3EF SN8 3EN SN8 3ET SN8 3FQ SN8 3FU SN8 3FW SN8 3NW SN8 3SL |
Transport near The Collingbournes And Netheravon
- FAQ
- Price Paid By Year
- Property Type Price
Frequently asked questions about The Collingbournes And Netheravon
What is the average price for a property for sale in The Collingbournes And Netheravon?
The average price for a property for sale in The Collingbournes And Netheravon is £468,180. This amount is 14% lower than the average price in Marlborough. There are 1,318 property listings for sale in The Collingbournes And Netheravon.
What streets have the most expensive properties for sale in The Collingbournes And Netheravon?
The streets with the most expensive properties for sale in The Collingbournes And Netheravon are Church Street at an average of £576,666, Aughton at an average of £533,000 and Brunton at an average of £435,000.
What streets have the most affordable properties for sale in The Collingbournes And Netheravon?
The streets with the most affordable properties for sale in The Collingbournes And Netheravon are Penny Hill at an average of £127,500, Ham Close at an average of £213,333 and Saxon Rise at an average of £235,525.
Which train stations are available in or near The Collingbournes And Netheravon?
Some of the train stations available in or near The Collingbournes And Netheravon are Pewsey, Bedwyn and Grateley.
Property Price Paid in The Collingbournes And Netheravon by Year
The average sold property price by year was:
| Year | Average Sold Price | Price Change |
Sold Properties
|
|---|---|---|---|
| 2025 | £470,000 | -2% |
14 Properties |
| 2024 | £477,159 | 4% |
22 Properties |
| 2023 | £456,444 | 9% |
19 Properties |
| 2022 | £416,745 | -6% |
29 Properties |
| 2021 | £439,883 | 10% |
43 Properties |
| 2020 | £396,522 | 11% |
27 Properties |
| 2019 | £350,964 | -11% |
28 Properties |
| 2018 | £389,382 | -9% |
20 Properties |
| 2017 | £424,641 | 22% |
32 Properties |
| 2016 | £331,068 | -12% |
32 Properties |
| 2015 | £371,669 | 15% |
35 Properties |
| 2014 | £316,006 | -12% |
31 Properties |
| 2013 | £353,028 | 6% |
25 Properties |
| 2012 | £332,236 | -8% |
23 Properties |
| 2011 | £357,611 | 6% |
18 Properties |
| 2010 | £336,329 | -3% |
22 Properties |
| 2009 | £346,681 | 27% |
22 Properties |
| 2008 | £253,918 | -13% |
23 Properties |
| 2007 | £286,000 | 1% |
36 Properties |
| 2006 | £282,221 | -1% |
37 Properties |
| 2005 | £284,337 | 9% |
31 Properties |
| 2004 | £258,430 | 14% |
30 Properties |
| 2003 | £222,344 | -17% |
26 Properties |
| 2002 | £259,092 | 24% |
42 Properties |
| 2001 | £197,292 | 4% |
41 Properties |
| 2000 | £189,357 | 14% |
46 Properties |
| 1999 | £163,356 | -10% |
38 Properties |
| 1998 | £180,492 | 21% |
34 Properties |
| 1997 | £143,289 | 36% |
26 Properties |
| 1996 | £92,400 | -8% |
20 Properties |
| 1995 | £99,783 | - |
23 Properties |
Property Price per Property Type in The Collingbournes And Netheravon
Here you can find historic sold price data in order to help with your property search.
The average Property Paid Price for specific property types in the last three years are:
| Property Type | Average Sold Price | Sold Properties |
|---|---|---|
| Semi Detached House | £406,690.00 | 20 Semi Detached Houses |
| Detached House | £626,919.00 | 23 Detached Houses |
| Terraced House | £309,375.00 | 8 Terraced Houses |
| Flat | £180,500.00 | 4 Flats |

