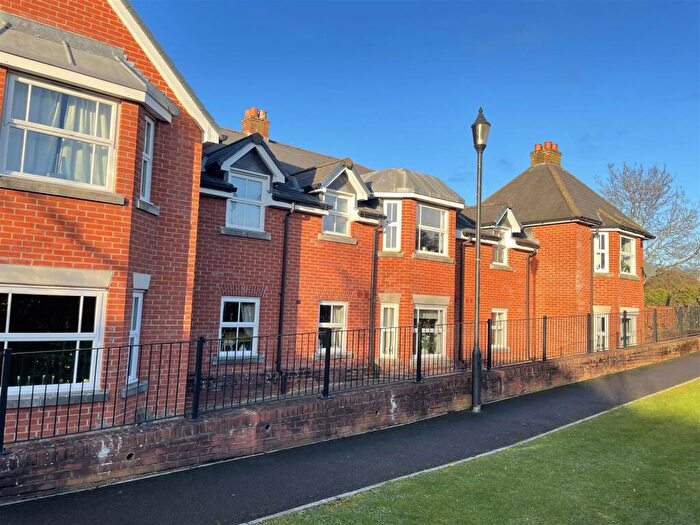
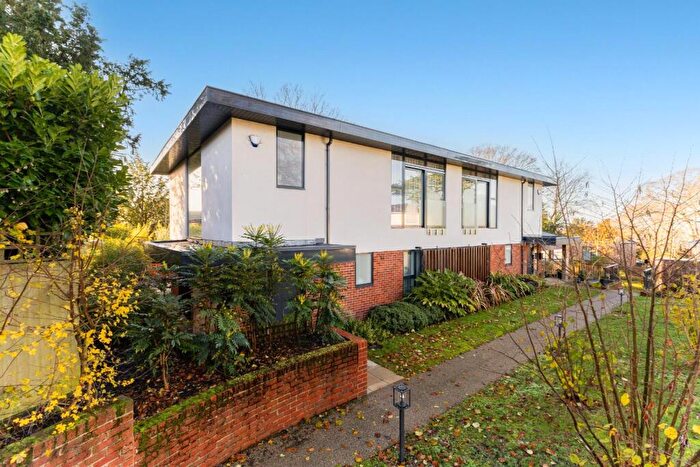
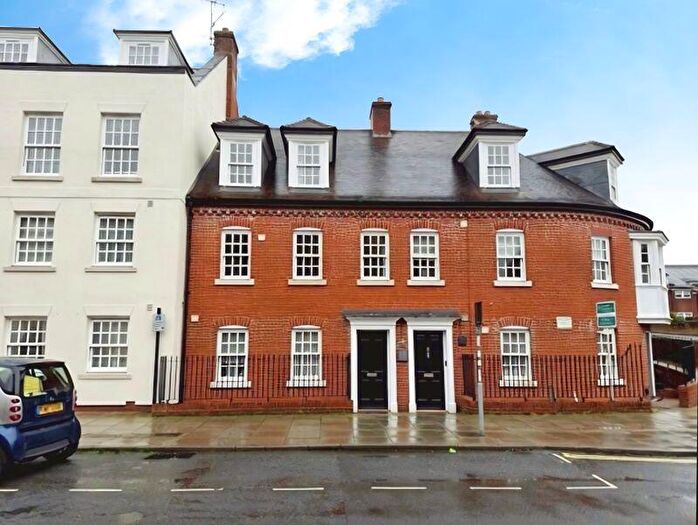
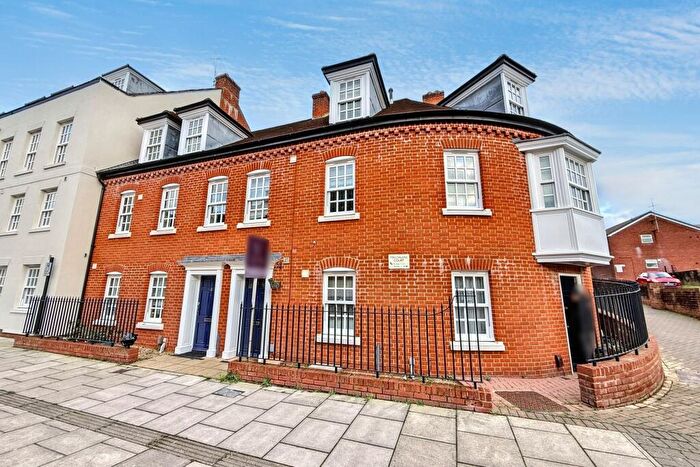
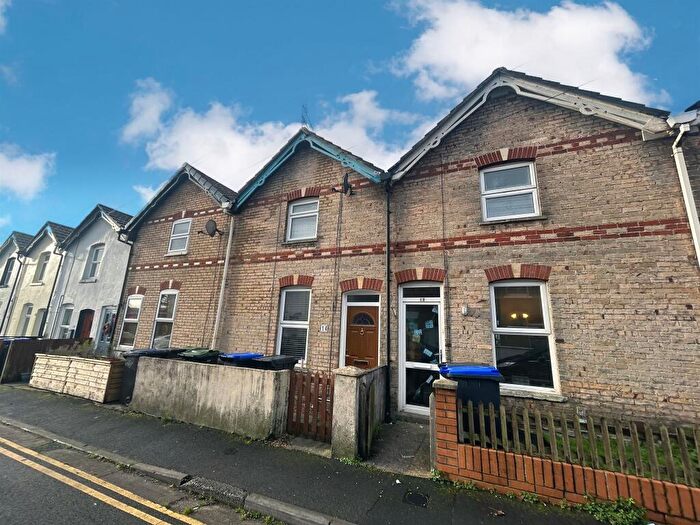
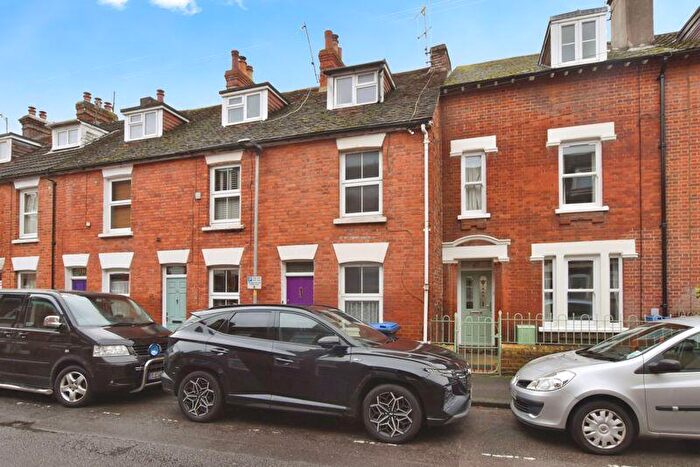
Houses for sale & to rent in Salisbury St Edmund And Milford, Salisbury
House Prices in Salisbury St Edmund And Milford
Properties in Salisbury St Edmund And Milford have an average house price of £311,588.00 and had 495 Property Transactions within the last 3 years¹.
Salisbury St Edmund And Milford is an area in Salisbury, Wiltshire with 2,437 households², where the most expensive property was sold for £955,000.00.
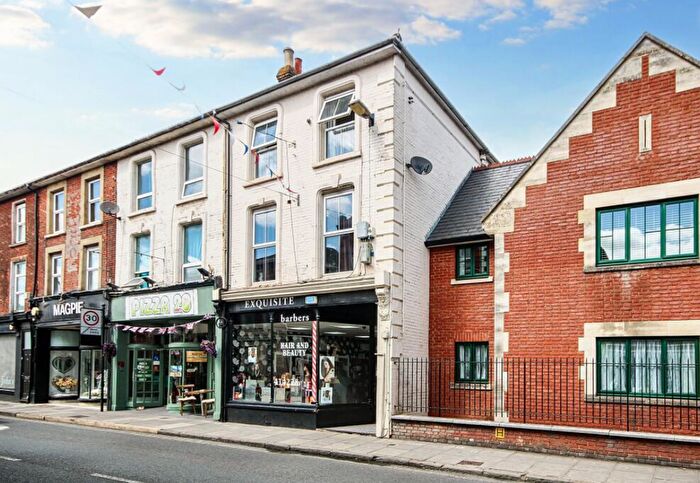
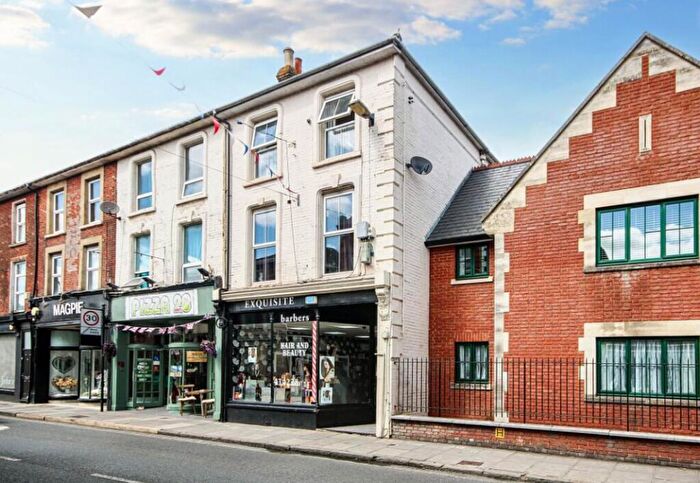
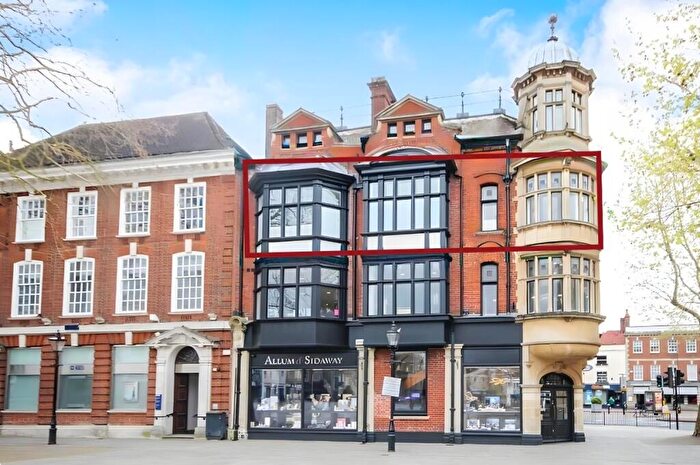
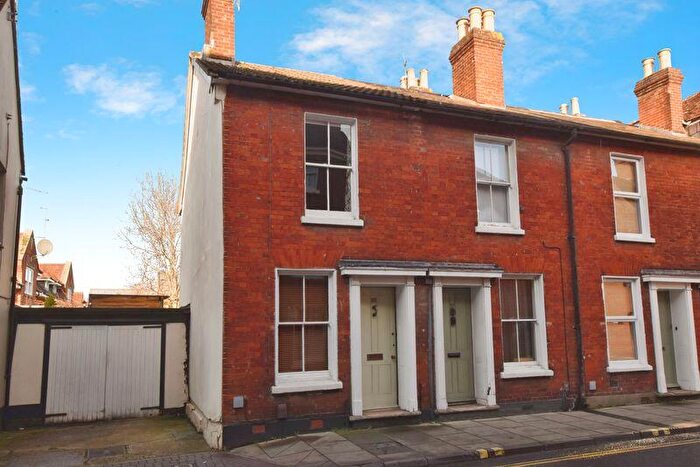
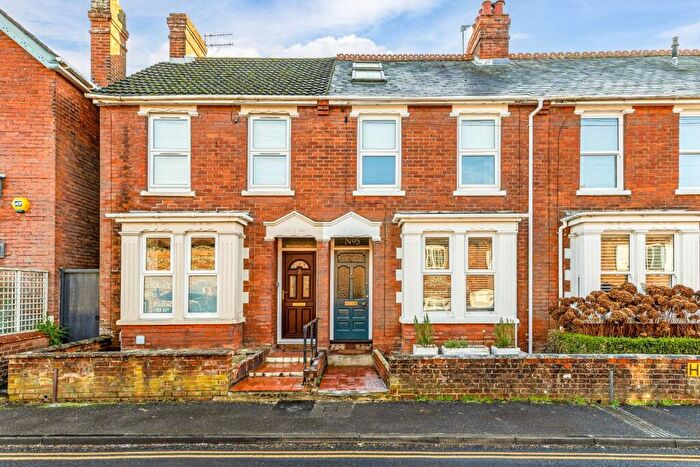
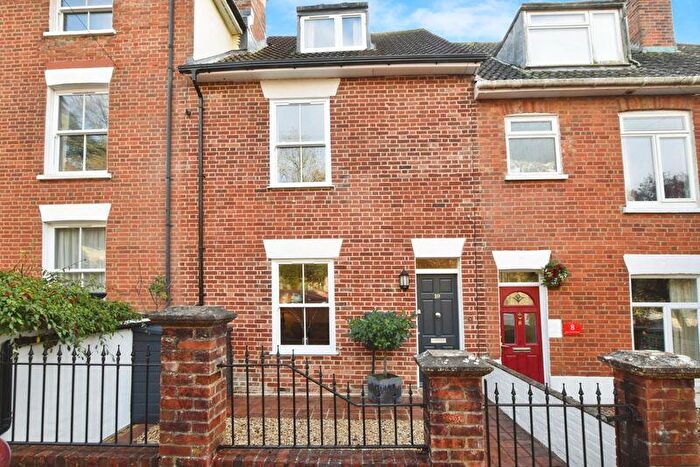
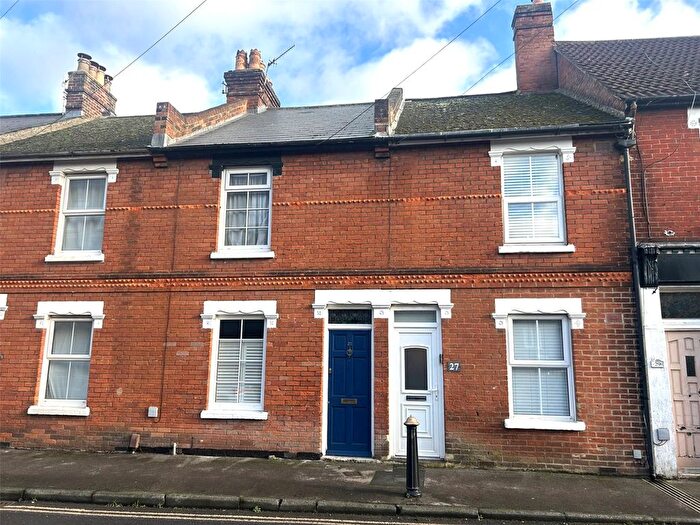
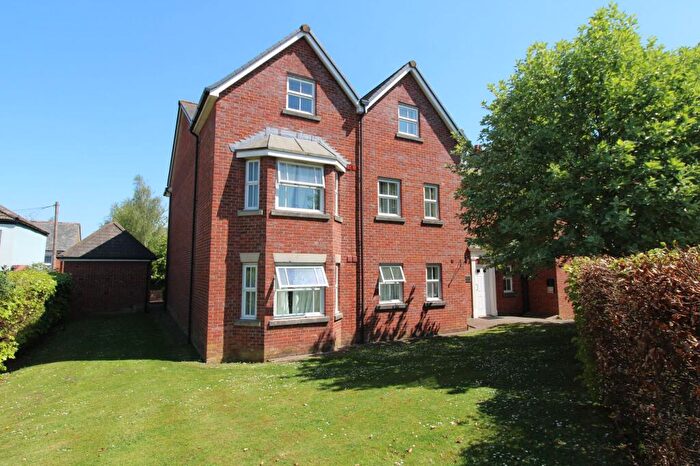
Properties for sale in Salisbury St Edmund And Milford
Roads and Postcodes in Salisbury St Edmund And Milford
Navigate through our locations to find the location of your next house in Salisbury St Edmund And Milford, Salisbury for sale or to rent.
| Streets | Postcodes |
|---|---|
| Albany Road | SP1 3YH SP1 3YQ |
| Avon Approach | SP1 3SL |
| Barnard Street | SP1 2BJ |
| Bedwin Street | SP1 3UT SP1 3UW SP1 3UP SP1 3UR |
| Bellamy Lane | SP1 2SP |
| Belle Vue Road | SP1 3YD SP1 3YE SP1 3YF SP1 3YG SP1 3AR |
| Blue Boar Row | SP1 1DA SP1 1DE SP1 1DF |
| Bourne Avenue | SP1 1LP SP1 1LS SP1 1LR SP1 1LT |
| Bourne Hill | SP1 3SN SP1 3UZ |
| Bourne Villas | SP1 3AW |
| Brewery Lane | SP1 2LJ |
| Bridge Street | SP1 2LX SP1 2LZ SP1 2ND |
| Brown Street | SP1 1HE SP1 2AS SP1 1AG SP1 2AR SP1 2AU |
| Butcher Row | SP1 1EP |
| Carting House Close | SP1 3RG |
| Castle Street | SP1 1BB SP1 1TT SP1 3SP SP1 3SY SP1 3TB SP1 3TE SP1 3TS SP1 3UA SP1 3WE SP1 3WF SP1 1BN SP1 3SS SP1 3ST SP1 3SU SP1 3SZ SP1 3TA SP1 3TT SP1 3TX SP1 3UD |
| Catherine Court | SP1 2DJ |
| Catherine Street | SP1 2DA SP1 2DH SP1 2DD SP1 2DE SP1 2DF SP1 2DQ |
| Chapel Place | SP2 7TY |
| Charter Court | SP1 2LH |
| Chipper Lane | SP1 1BG |
| Clarence Court | SP1 1JL |
| Clarendon Road | SP1 1LG |
| College Street | SP1 3AL |
| Crane Street | SP1 2QD |
| Cross Keys Chequer | SP1 1EL |
| Culver Street | SP1 2BY SP1 2BW |
| Elm Grove | SP1 1NE SP1 1NQ |
| Elm Grove Place | SP1 1NA SP1 1NB |
| Elm Grove Road | SP1 1JN SP1 1JW |
| Endless Street | SP1 1DL SP1 1DP SP1 3UH SP1 1DZ SP1 3GE SP1 3GF SP1 3RE SP1 3RF |
| Estcourt Road | SP1 3AP SP1 3AS SP1 3AX |
| Fairview Road | SP1 1JX SP1 1JY |
| Fish Row | SP1 1AH SP1 1EJ SP1 1EX |
| Fisherton Street | SP2 7FJ SP2 7QT SP2 7QY SP2 7RB SP2 7QX SP2 7RG |
| Fulford Place | SP1 3BB |
| Gigant Street | SP1 2BQ SP1 2DL SP1 2BU |
| Greencroft Street | SP1 1JE SP1 1JF SP1 1JJ |
| Guilder Lane | SP1 1HW |
| Guildhall Square | SP1 1JH |
| Hamilton Road | SP1 3TF SP1 3TG SP1 3TQ |
| Helena Terrace | SP1 3AN |
| High Street | SP1 2NH SP1 2NJ SP1 2NN SP1 2NP SP1 2NT SP1 2NW |
| Ivy Place | SP1 3SX |
| Ivy Street | SP1 2AZ |
| Kelsey Road | SP1 1JP SP1 1JZ SP1 1LA SP1 1JR |
| Kings Road | SP1 3AD |
| Laverstock Road | SP1 1LE |
| London Road | SP1 3EX SP1 3HA |
| Malthouse Lane | SP2 7RF SP2 7QQ SP2 7RA SP2 7TU |
| Manor Court | SP1 1LN |
| Manor Road | SP1 1JS SP1 1JT |
| Market Place | SP1 1BL SP1 1TL |
| Market Walk | SP1 1BT |
| Marlborough Road | SP1 3TH |
| Milford Hill | SP1 2QZ |
| Milford Hollow | SP1 2RD |
| Milford Street | SP1 2AJ SP1 2AP SP1 2BP SP1 2AL SP1 2AN SP1 2BS SP1 2DZ |
| Mill Stream Approach | SP1 3UE |
| Millbrook | SP1 1NH |
| Minster Street | SP1 1TB SP1 1AJ SP1 1TD SP1 1TE SP1 1TF |
| Mulberry Walk | SP1 1ND |
| New Canal | SP1 2AA SP1 2AQ |
| New Street | SP1 2FG |
| Oatmeal Row | SP1 1TH |
| Old George Mall | SP1 2AF SP1 2AG |
| Ox Row | SP1 1EU |
| Park Street | SP1 3AT SP1 3AU |
| Paynes Hill | SP1 2BN |
| Pennyfarthing Street | SP1 1HJ |
| Priory Square | SP2 7TL |
| Queen Street | SP1 1EY |
| Queens Road | SP1 3AG SP1 3AJ |
| Rollestone Street | SP1 1ED SP1 1DX SP1 1DY |
| Rougemont Close | SP1 1LY |
| Salt Lane | SP1 1DT SP1 1EE SP1 1EG SP1 1DU |
| School Lane | SP1 3YA |
| Scots Lane | SP1 3FT SP1 3TR SP1 3TU |
| Silver Street | SP1 2NE SP1 2NG |
| St Edmunds Church Street | SP1 1EF SP1 1EQ SP1 1FD |
| St Marks Road | SP1 3AY SP1 3AZ |
| St Thomass Square | SP1 1BA |
| Stroud Place | SP1 1JQ |
| Summerlock Approach | SP2 7RW SP2 7UT |
| Swaynes Close | SP1 3AE |
| The Avenue | SP1 1NF SP1 1NG |
| The Brambles | SP1 3EY SP1 3EZ |
| The Greencroft | SP1 1JD |
| The Maltings | SP1 1BD |
| The Orchard | SP1 3HD |
| Three Cuppes Lane | SP1 1ER |
| Three Swans Chequer | SP1 1AL |
| Wain A Long Road | SP1 1LJ SP1 1LW |
| Waverley Place | SP1 2BH |
| Wessex Road | SP1 1LB SP1 1LD SP1 1LH SP1 1LQ |
| Winchester Street | SP1 1HB SP1 1HG SP1 1HL SP1 1HS |
| Woodstock Road | SP1 3TJ |
| Wyndham Park | SP1 3BA |
| Wyndham Road | SP1 3AA SP1 3AB SP1 3AH SP1 3AQ |
| Wyndham Terrace | SP1 3AF |
| SP1 1HR |
Transport near Salisbury St Edmund And Milford
-
Salisbury Station
-
Dean Station
-
Grateley Station
-
Mottisfont and Dunbridge Station
-
Tisbury Station
-
Romsey Station
- FAQ
- Price Paid By Year
- Property Type Price
Frequently asked questions about Salisbury St Edmund And Milford
What is the average price for a property for sale in Salisbury St Edmund And Milford?
The average price for a property for sale in Salisbury St Edmund And Milford is £311,588. This amount is 19% lower than the average price in Salisbury. There are 1,472 property listings for sale in Salisbury St Edmund And Milford.
What streets have the most expensive properties for sale in Salisbury St Edmund And Milford?
The streets with the most expensive properties for sale in Salisbury St Edmund And Milford are Blue Boar Row at an average of £672,000, Millbrook at an average of £619,875 and Bourne Avenue at an average of £569,500.
What streets have the most affordable properties for sale in Salisbury St Edmund And Milford?
The streets with the most affordable properties for sale in Salisbury St Edmund And Milford are Mill Stream Approach at an average of £85,000, The Brambles at an average of £134,190 and Manor Court at an average of £140,000.
Which train stations are available in or near Salisbury St Edmund And Milford?
Some of the train stations available in or near Salisbury St Edmund And Milford are Salisbury, Dean and Grateley.
Property Price Paid in Salisbury St Edmund And Milford by Year
The average sold property price by year was:
| Year | Average Sold Price | Price Change |
Sold Properties
|
|---|---|---|---|
| 2025 | £302,529 | -1% |
85 Properties |
| 2024 | £306,814 | -9% |
123 Properties |
| 2023 | £334,152 | 9% |
124 Properties |
| 2022 | £302,750 | -2% |
163 Properties |
| 2021 | £309,906 | -7% |
189 Properties |
| 2020 | £331,046 | 8% |
200 Properties |
| 2019 | £304,366 | 4% |
132 Properties |
| 2018 | £293,140 | 7% |
134 Properties |
| 2017 | £271,828 | 1% |
138 Properties |
| 2016 | £268,835 | 4% |
120 Properties |
| 2015 | £258,877 | 3% |
138 Properties |
| 2014 | £252,175 | 6% |
148 Properties |
| 2013 | £236,952 | 7% |
105 Properties |
| 2012 | £219,319 | -1% |
110 Properties |
| 2011 | £220,516 | -3% |
96 Properties |
| 2010 | £226,074 | 2% |
81 Properties |
| 2009 | £220,536 | -2% |
84 Properties |
| 2008 | £225,767 | -10% |
75 Properties |
| 2007 | £248,676 | 8% |
159 Properties |
| 2006 | £229,283 | 7% |
157 Properties |
| 2005 | £212,127 | 3% |
94 Properties |
| 2004 | £205,086 | 4% |
127 Properties |
| 2003 | £197,624 | 20% |
130 Properties |
| 2002 | £157,823 | 11% |
171 Properties |
| 2001 | £140,154 | 8% |
207 Properties |
| 2000 | £129,159 | -20% |
191 Properties |
| 1999 | £154,707 | 42% |
191 Properties |
| 1998 | £89,478 | 20% |
197 Properties |
| 1997 | £71,739 | 7% |
137 Properties |
| 1996 | £66,587 | 2% |
127 Properties |
| 1995 | £65,062 | - |
91 Properties |
Property Price per Property Type in Salisbury St Edmund And Milford
Here you can find historic sold price data in order to help with your property search.
The average Property Paid Price for specific property types in the last three years are:
| Property Type | Average Sold Price | Sold Properties |
|---|---|---|
| Flat | £235,062.00 | 235 Flats |
| Semi Detached House | £455,173.00 | 52 Semi Detached Houses |
| Detached House | £629,610.00 | 15 Detached Houses |
| Terraced House | £341,365.00 | 193 Terraced Houses |

