
Houses for sale & to rent in Salisbury St Francis And Stratford, Salisbury
House Prices in Salisbury St Francis And Stratford
Properties in Salisbury St Francis And Stratford have an average house price of £413,476.00 and had 237 Property Transactions within the last 3 years¹.
Salisbury St Francis And Stratford is an area in Salisbury, Wiltshire with 2,105 households², where the most expensive property was sold for £1,650,000.00.
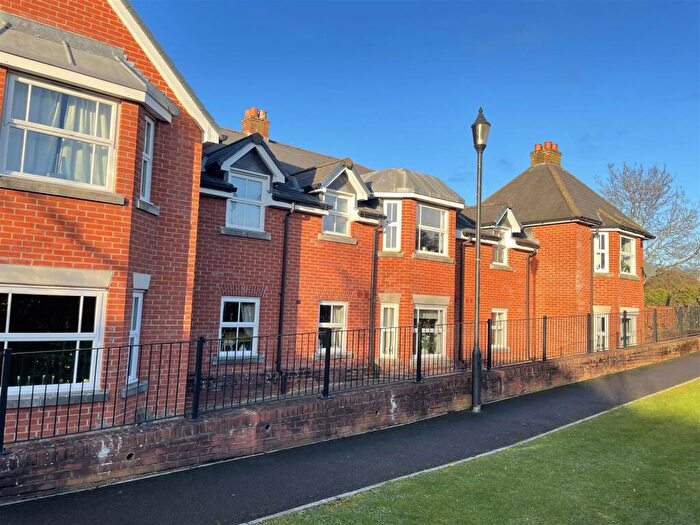
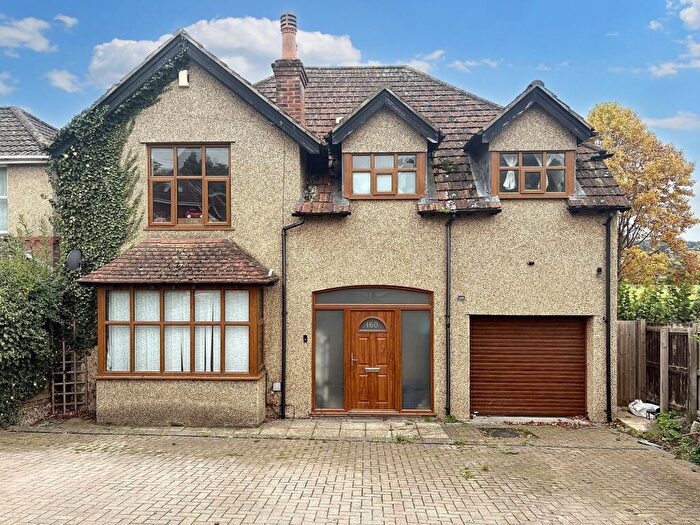
Properties for sale in Salisbury St Francis And Stratford

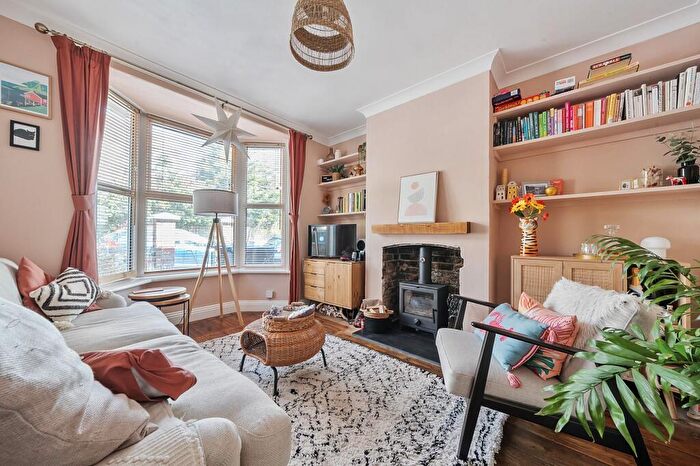
![]()
If you are looking to sell your house, let it out, or receive a property valuation, an expert can help you.
Click the button below to get started.

Roads and Postcodes in Salisbury St Francis And Stratford
Navigate through our locations to find the location of your next house in Salisbury St Francis And Stratford, Salisbury for sale or to rent.
| Streets | Postcodes |
|---|---|
| Assisi Road | SP1 3QZ |
| Attwood Road | SP1 3PR |
| Balmoral Road | SP1 3PU SP1 3PX SP1 3PZ |
| Bartlett Road | SP1 3PS SP1 3PT |
| Beatrice Road | SP1 3PN SP1 3PW |
| Braemar Rise | SP1 3QB SP1 3QD |
| Broadlands Close | SP1 3QA |
| Capulet Road | SP1 3JY |
| Castle Keep | SP1 3LF |
| Castle Road | SP1 3RH SP1 3RN SP1 3RP SP1 3RR SP1 3RW SP1 3RX SP1 3RY SP1 3SA SP1 3SB SP1 3SD SP1 3SG |
| Chatham Close | SP1 3JR |
| Cornwall Road | SP1 3NH SP1 3NJ SP1 3NL |
| Devonshire Road | SP1 3NN SP1 3NW |
| Donaldson Road | SP1 3DA SP1 3DB |
| Dorset Road | SP1 3BP SP1 3BS |
| Downsway | SP1 3QL SP1 3QW |
| Fairfield Road | SP1 3NY SP1 3PB SP1 3PA |
| Feversham Road | SP1 3PP |
| Hathaway Close | SP1 3JT SP1 3JX |
| Hilltop Way | SP1 3QQ SP1 3QY |
| Hudson Road | SP1 3JW SP1 3LR SP1 3ZT |
| Hulse Road | SP1 3NR |
| Juniper Drive | SP1 3RA |
| Mill Lane | SP1 3LJ |
| Moberly Road | SP1 3BX SP1 3BY SP1 3BZ |
| New Bottom Road | SP4 6AB |
| Oakway Road | SP1 3QN |
| Old Castle Road | SP1 3SF |
| Park Close | SP1 3EU |
| Park Lane | SP1 3NP SP1 3NS |
| Parsonage Close | SP1 3LP |
| Pauls Dene Crescent | SP1 3QU SP1 3QX |
| Pauls Dene Road | SP1 3SE |
| Phillips Lane | SP1 3YR |
| Police Houses | SP1 3LE |
| Queensberry Road | SP1 3PH SP1 3PJ |
| Radnor Road | SP1 3PL |
| Ridgeway Road | SP1 3BT SP1 3BU |
| Shakespeare Road | SP1 3LA |
| Shelley Drive | SP1 3JZ |
| St Francis Crescent | SP1 3QT |
| St Francis Road | SP1 3QP SP1 3QR SP1 3QS |
| St Lawrence Close | SP1 3LW |
| St Osmunds Close | SP1 3RB |
| Stratford Road | SP1 3JH SP1 3JL SP1 3JN SP1 3JP SP1 3JS SP1 3LB SP1 3LG SP1 3LH SP1 3LL SP1 3LQ SP1 3LX SP1 3JJ |
| Sunnyhill Road | SP1 3QH SP1 3QJ |
| The Portway | SP1 3LD |
| The Rings | SP1 3YS |
| Thistlebarrow Road | SP1 3RS SP1 3RT SP1 3RU |
| Verona Road | SP1 3JU |
| Victoria Road | SP1 3NE SP1 3NF SP1 3NG SP1 3NQ |
| Warwick Close | SP1 3LN SP1 3LS |
| Waters Road | SP1 3NT SP1 3NU SP1 3NX |
| Windlesham Road | SP1 3PY |
| Wordsworth Road | SP1 3BH |
| SP1 3YP |
Transport near Salisbury St Francis And Stratford

- FAQ
- Price Paid By Year
- Property Type Price
Frequently asked questions about Salisbury St Francis And Stratford
What is the average price for a property for sale in Salisbury St Francis And Stratford?
The average price for a property for sale in Salisbury St Francis And Stratford is £413,476. This amount is 8% higher than the average price in Salisbury. There are 944 property listings for sale in Salisbury St Francis And Stratford.
What streets have the most expensive properties for sale in Salisbury St Francis And Stratford?
The streets with the most expensive properties for sale in Salisbury St Francis And Stratford are St Lawrence Close at an average of £775,000, Moberly Road at an average of £713,431 and Victoria Road at an average of £666,250.
What streets have the most affordable properties for sale in Salisbury St Francis And Stratford?
The streets with the most affordable properties for sale in Salisbury St Francis And Stratford are Chatham Close at an average of £123,850, Park Close at an average of £245,000 and Braemar Rise at an average of £249,687.
Which train stations are available in or near Salisbury St Francis And Stratford?
Some of the train stations available in or near Salisbury St Francis And Stratford are Salisbury, Dean and Grateley.
Property Price Paid in Salisbury St Francis And Stratford by Year
The average sold property price by year was:
| Year | Average Sold Price | Price Change |
Sold Properties
|
|---|---|---|---|
| 2025 | £427,725 | 1% |
46 Properties |
| 2024 | £423,100 | 5% |
76 Properties |
| 2023 | £399,899 | -1% |
51 Properties |
| 2022 | £402,627 | -2% |
64 Properties |
| 2021 | £411,069 | 13% |
96 Properties |
| 2020 | £358,425 | 2% |
63 Properties |
| 2019 | £350,287 | -4% |
63 Properties |
| 2018 | £363,685 | -10% |
52 Properties |
| 2017 | £400,479 | 21% |
65 Properties |
| 2016 | £314,491 | -2% |
73 Properties |
| 2015 | £320,018 | 2% |
66 Properties |
| 2014 | £313,797 | 18% |
84 Properties |
| 2013 | £257,168 | -2% |
81 Properties |
| 2012 | £262,540 | -1% |
58 Properties |
| 2011 | £264,041 | 1% |
60 Properties |
| 2010 | £261,842 | 3% |
58 Properties |
| 2009 | £254,685 | -10% |
60 Properties |
| 2008 | £281,413 | 7% |
47 Properties |
| 2007 | £260,874 | 3% |
92 Properties |
| 2006 | £253,793 | 14% |
100 Properties |
| 2005 | £218,646 | -12% |
74 Properties |
| 2004 | £244,623 | 11% |
71 Properties |
| 2003 | £218,616 | 7% |
99 Properties |
| 2002 | £204,135 | 18% |
80 Properties |
| 2001 | £167,412 | 14% |
93 Properties |
| 2000 | £143,978 | 21% |
82 Properties |
| 1999 | £113,992 | 8% |
80 Properties |
| 1998 | £104,863 | 13% |
87 Properties |
| 1997 | £90,933 | -0,2% |
76 Properties |
| 1996 | £91,102 | 10% |
78 Properties |
| 1995 | £81,683 | - |
77 Properties |
Property Price per Property Type in Salisbury St Francis And Stratford
Here you can find historic sold price data in order to help with your property search.
The average Property Paid Price for specific property types in the last three years are:
| Property Type | Average Sold Price | Sold Properties |
|---|---|---|
| Semi Detached House | £381,404.00 | 97 Semi Detached Houses |
| Detached House | £550,666.00 | 90 Detached Houses |
| Terraced House | £364,460.00 | 14 Terraced Houses |
| Flat | £175,981.00 | 36 Flats |