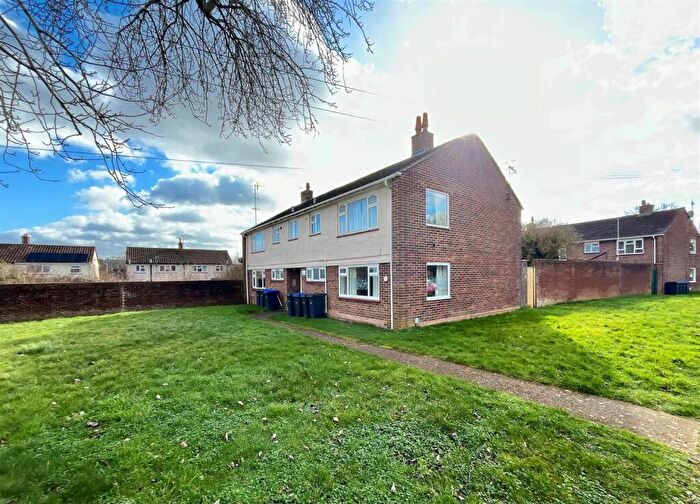
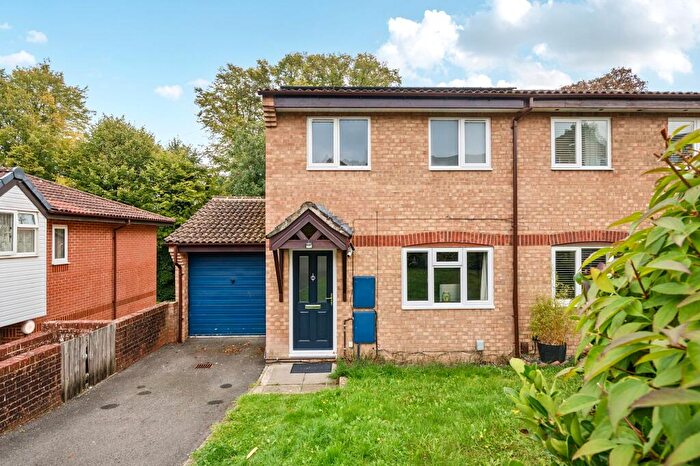
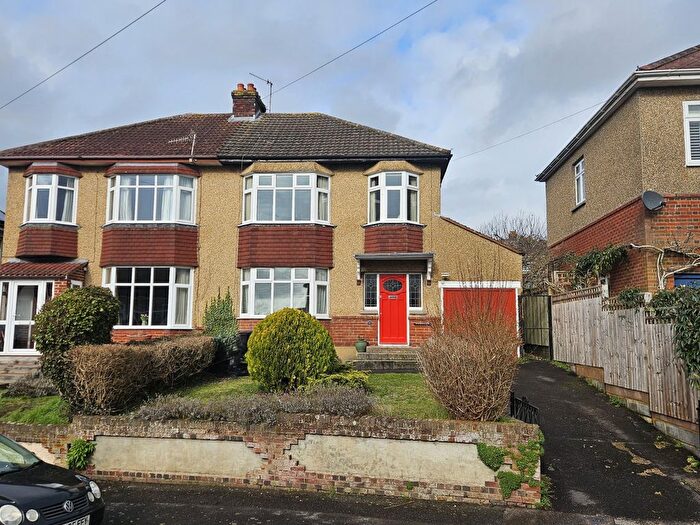
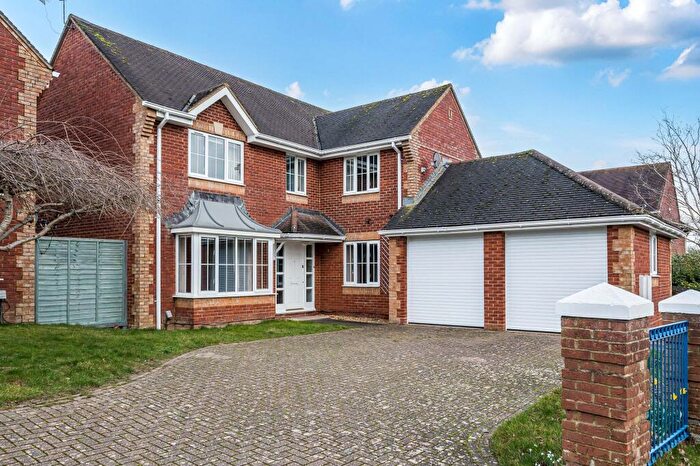
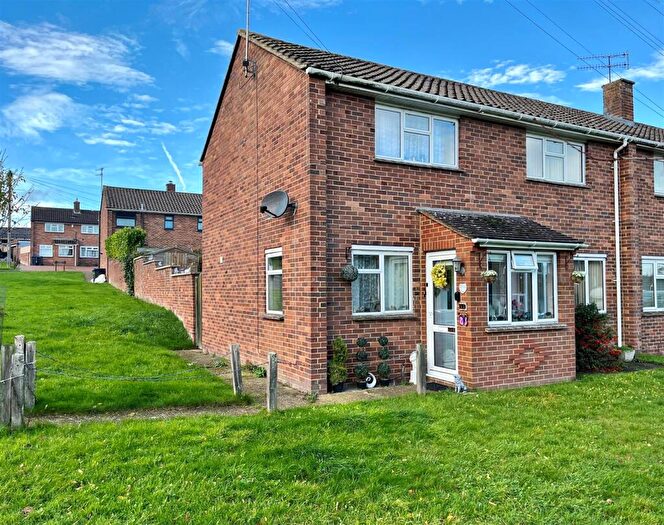
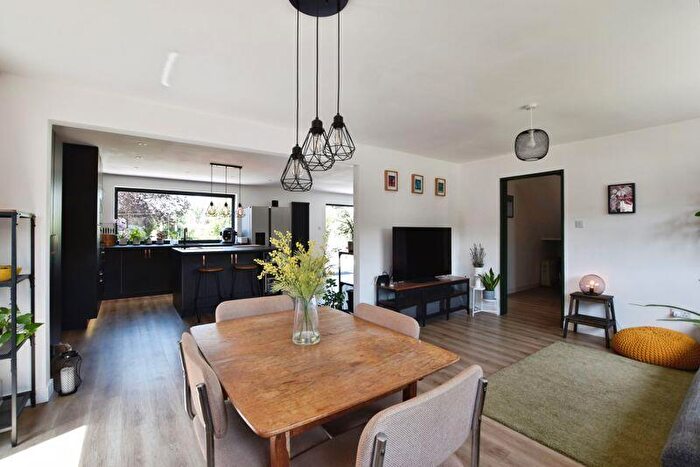
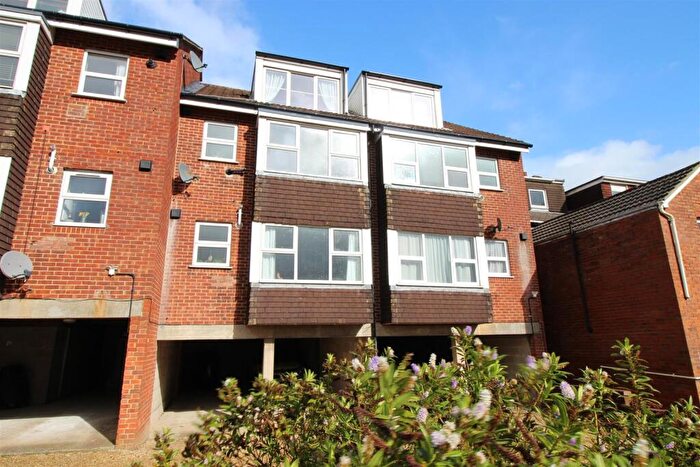
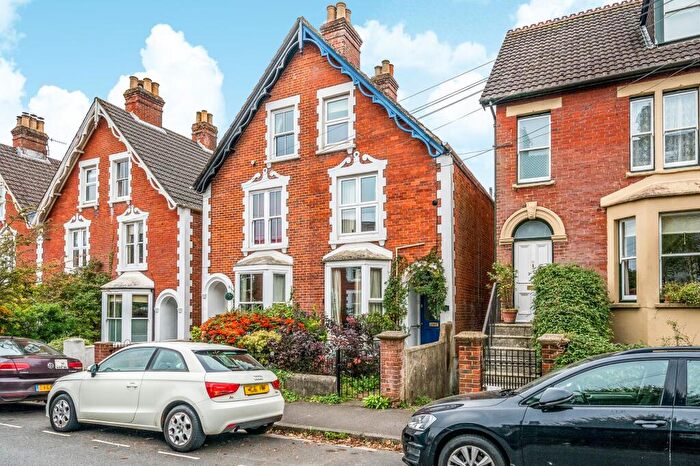
Houses for sale & to rent in Salisbury St Marks And Bishopdown, Salisbury
House Prices in Salisbury St Marks And Bishopdown
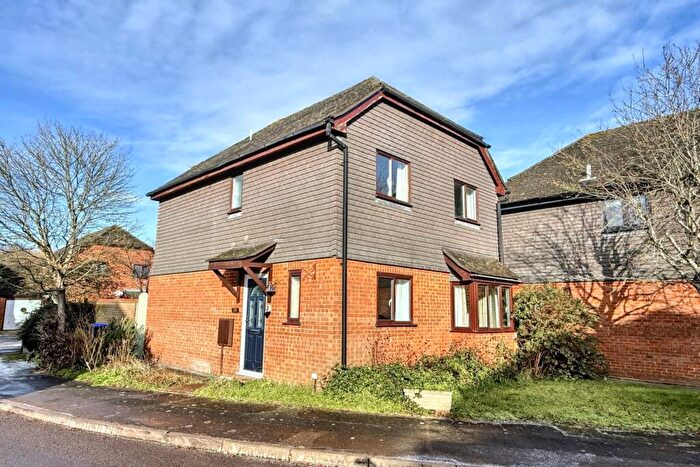
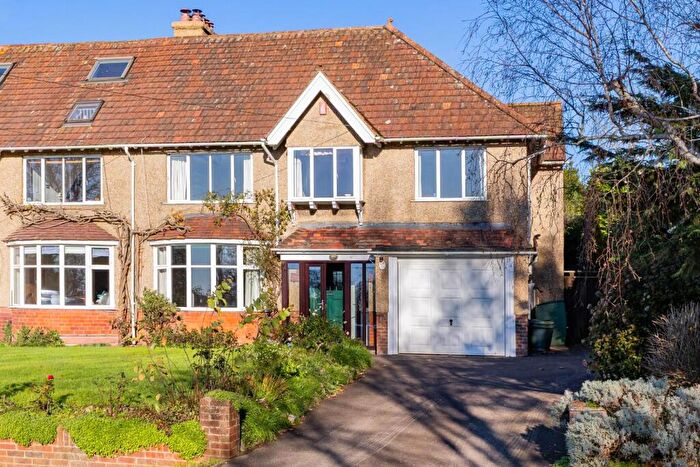
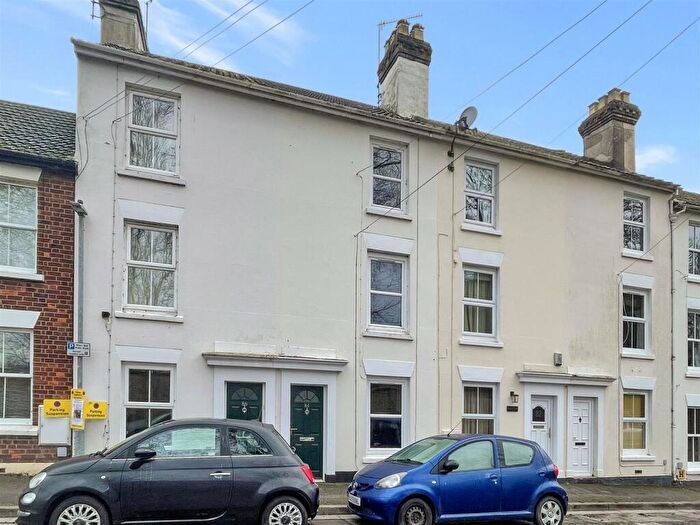
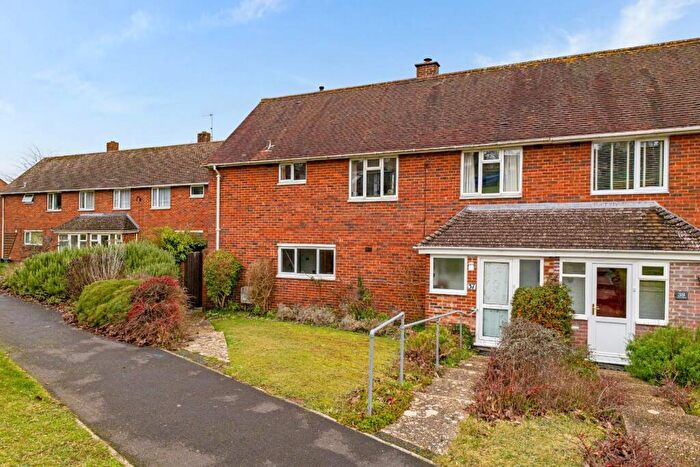
Properties in Salisbury St Marks And Bishopdown have an average house price of £350,797.63 and had 221 Property Transactions within the last 3 years¹.
Salisbury St Marks And Bishopdown is an area in Salisbury, Wiltshire with 1,959 households², where the most expensive property was sold for £1,180,000.00.
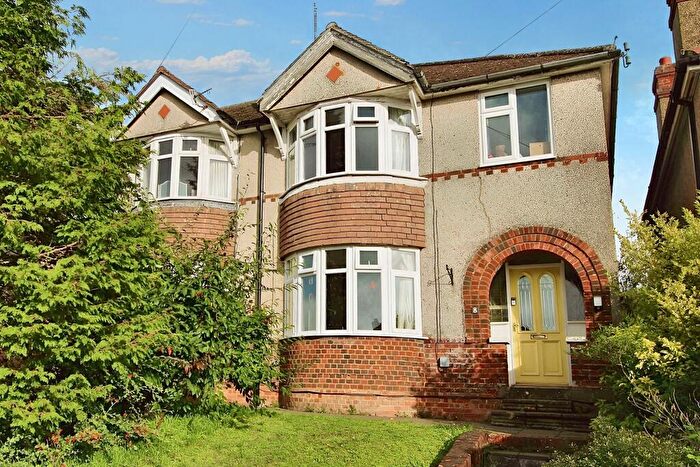
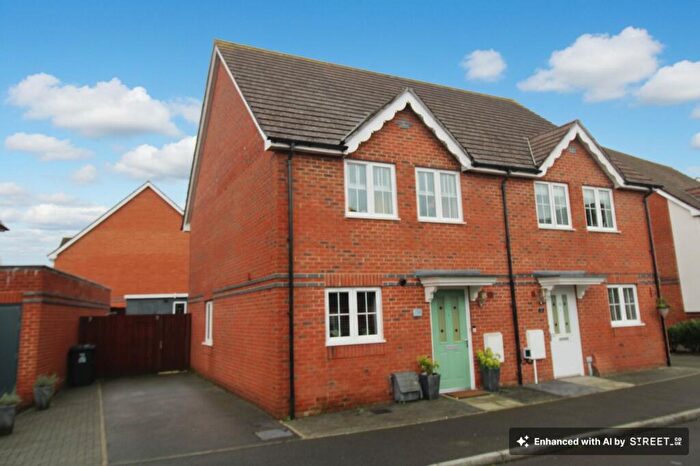
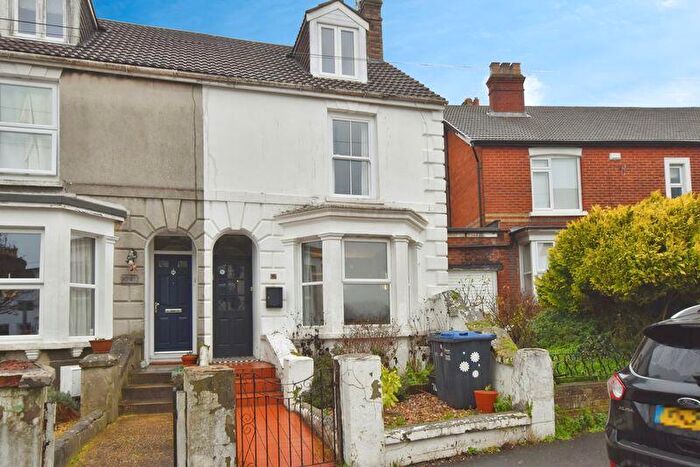
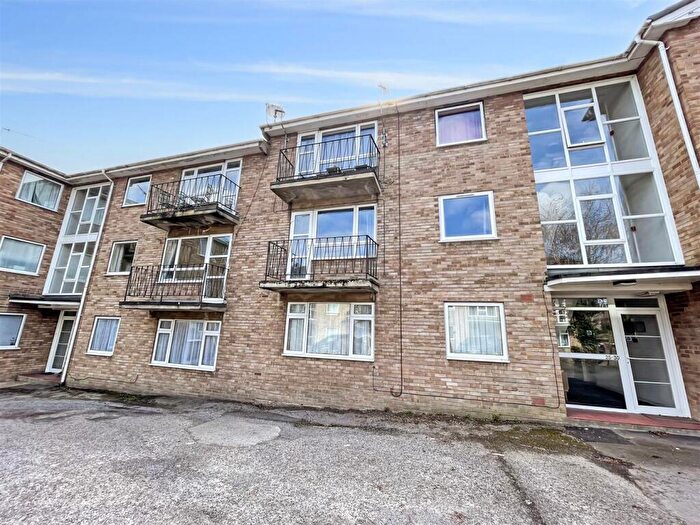
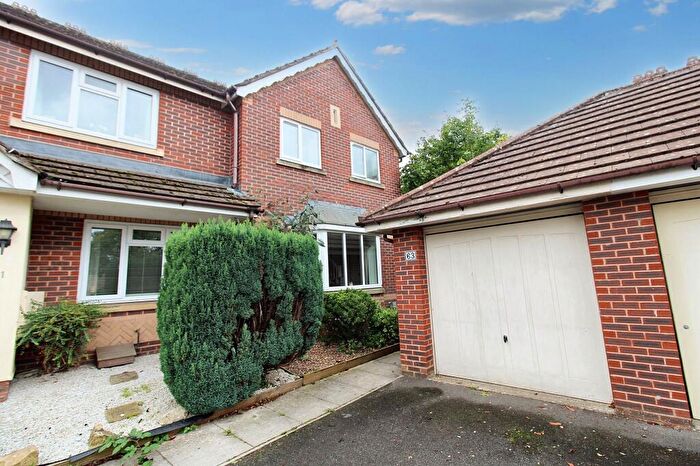
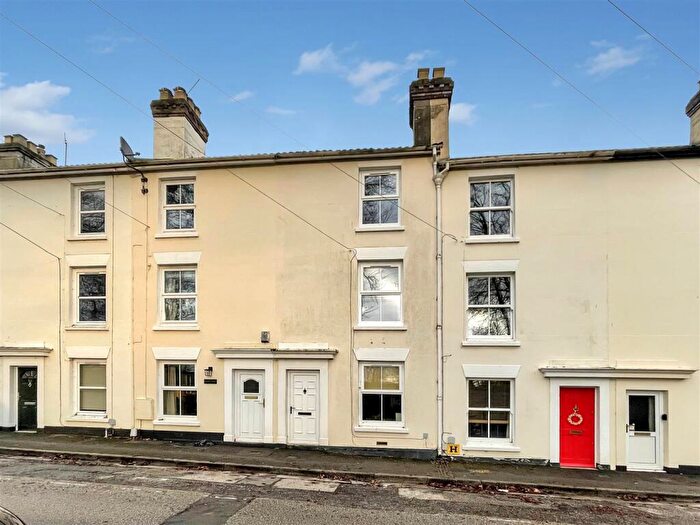
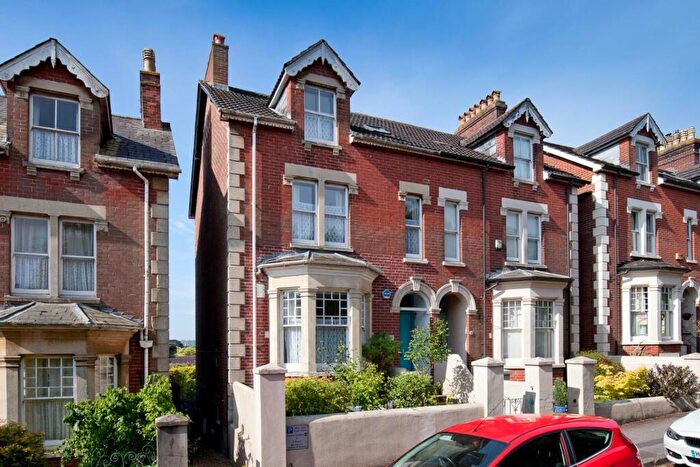
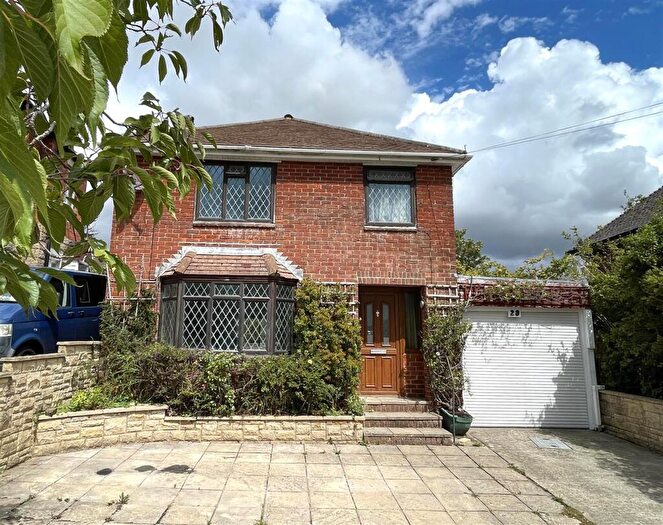
Properties for sale in Salisbury St Marks And Bishopdown
Previously listed properties in Salisbury St Marks And Bishopdown
Roads and Postcodes in Salisbury St Marks And Bishopdown
Navigate through our locations to find the location of your next house in Salisbury St Marks And Bishopdown, Salisbury for sale or to rent.
| Streets | Postcodes |
|---|---|
| Abbot Road | SP1 3EA |
| Aldworth Drive | SP1 3GH |
| Anderson Road | SP1 3DX |
| Apostle Way | SP1 3GD SP1 3GS |
| Appleshaw Way | SP1 3ZA |
| Applin Road | SP1 3PD |
| Ash Crescent | SP1 3GY |
| Aston Mead | SP1 3HJ |
| Barrington Road | SP1 3JB SP1 3JD |
| Bingham Road | SP1 3DY SP1 3DZ SP1 3EB |
| Bishopdown Cottages | SP1 3YX |
| Bishopdown Road | SP1 3DP SP1 3DR SP1 3DS SP1 3DT SP1 3DU SP1 3ED SP1 3EE |
| Blyth Way | SP1 3HU |
| Bowerhill Road | SP1 3DN |
| Bundy Lane | SP1 3PE |
| Burden Drive | SP1 3QG SP1 3RD |
| Burgess Green | SP1 3EL |
| Burnet Way | SP1 3HX |
| Cambridge Road | SP1 3BW |
| Campbell Road | SP1 3BG SP1 3BQ |
| Cheverell Avenue | SP1 3HH SP1 3HQ |
| Cook Court | SP1 3PF |
| Denison Rise | SP1 3EJ SP1 3EW |
| Drake Close | SP1 3GJ |
| Dunley Way | SP1 3GN SP1 3GW |
| Fiander Lane | SP1 3BD |
| Fison Walk | SP1 3JF |
| Fotherby Crescent | SP1 3EQ SP1 3EG |
| Fulton Road | SP1 3BF |
| Fyfield Close | SP1 3WU |
| Gibbs Close | SP1 3WB |
| Gilbert Way | SP1 3EF |
| Glenmore Road | SP1 3HF SP1 3HG |
| Glover Close | SP1 3DE |
| Grange Gardens | SP1 3DG |
| Hallum Close | SP1 3JG |
| Hartley Way | SP1 3WS |
| Hensler Drive | SP1 3DQ |
| Hoadley Green | SP1 3HS |
| Holmes Road | SP1 3DF SP1 3ER |
| Howes Crescent | SP1 3FU |
| Jewell Close | SP1 3HR |
| Kimpton Avenue | SP1 3WZ |
| Lindford Road | SP1 3WX |
| Linkway | SP1 3EP |
| London Road | SP1 3HB SP1 3HN SP1 3HP SP1 3YU |
| Lovett Green | SP1 3HZ |
| Manning Close | SP1 3GL |
| Monxton Close | SP1 3WY |
| Myrrfield Road | SP1 3FQ |
| Neal Close | SP1 3WD |
| Netheravon Close | SP1 3BE |
| Netheravon Road | SP1 3BJ |
| Neville Close | SP1 3EH |
| Oldfield Road | SP1 3GQ |
| Pearce Way | SP1 3GU |
| Pilgrims Mead | SP1 3GX |
| Poplar Way | SP1 3GR |
| Redford Close | SP1 3HL |
| Saintes Close | SP1 3WT |
| Saunders Avenue | SP1 3PG SP1 3PQ |
| Seth Ward Drive | SP1 3HT SP1 3HY SP1 3JA |
| Sharratt Avenue | SP1 3GT |
| Somerset Road | SP1 3BN SP1 3BL |
| St Albans Close | SP1 3FN |
| St Bedes Close | SP1 3FW |
| St Brendans Close | SP1 3FR |
| St Christophers Close | SP1 3FL |
| St Clements Way | SP1 3FE SP1 3FF SP1 3GA |
| St Davids Close | SP1 3FH |
| St James Close | SP1 3FB |
| St Josephs Close | SP1 3FX |
| St Judes Close | SP1 3FA |
| St Lukes Close | SP1 3FD |
| St Marks Avenue | SP1 3DD SP1 3DH SP1 3DL SP1 3DW SP1 3UF |
| St Matthews Close | SP1 3FJ |
| St Peters Road | SP1 3FS |
| St Teresas Close | SP1 3FP |
| St Thomass Way | SP1 3FG |
| St Ursulas Close | SP1 3FY |
| Stockwood Close | SP1 3HE |
| Stout Grove | SP1 3QF |
| Sycamore Drive | SP1 3GZ |
| Talbot Close | SP1 3EN |
| The Crusades | SP1 3GB |
| The Oakbournes | SP1 3FZ |
| Tower Mews | SP1 3DJ |
| Tryhorn Drive | SP1 3WA |
| Ventry Close | SP1 3ES |
| Wolferstan Drive | SP1 3XZ |
| Woodvill Road | SP1 3JQ |
Transport near Salisbury St Marks And Bishopdown
- FAQ
- Price Paid By Year
- Property Type Price
Frequently asked questions about Salisbury St Marks And Bishopdown
What is the average price for a property for sale in Salisbury St Marks And Bishopdown?
The average price for a property for sale in Salisbury St Marks And Bishopdown is £350,798. This amount is 9% lower than the average price in Salisbury. There are 494 property listings for sale in Salisbury St Marks And Bishopdown.
What streets have the most expensive properties for sale in Salisbury St Marks And Bishopdown?
The streets with the most expensive properties for sale in Salisbury St Marks And Bishopdown are Netheravon Road at an average of £870,000, St Bedes Close at an average of £750,000 and St Marks Avenue at an average of £723,750.
What streets have the most affordable properties for sale in Salisbury St Marks And Bishopdown?
The streets with the most affordable properties for sale in Salisbury St Marks And Bishopdown are Gilbert Way at an average of £140,000, Talbot Close at an average of £205,000 and Neville Close at an average of £206,333.
Which train stations are available in or near Salisbury St Marks And Bishopdown?
Some of the train stations available in or near Salisbury St Marks And Bishopdown are Salisbury, Dean and Grateley.
Property Price Paid in Salisbury St Marks And Bishopdown by Year
The average sold property price by year was:
| Year | Average Sold Price | Price Change |
Sold Properties
|
|---|---|---|---|
| 2025 | £368,624.25 | 8% |
65 Properties |
| 2024 | £337,513.48 | -4% |
89 Properties |
| 2023 | £351,149.25 | 4% |
67 Properties |
| 2022 | £336,437.7 | 5% |
61 Properties |
| 2021 | £320,070.85 | 3% |
107 Properties |
| 2020 | £311,587.51 | 11% |
69 Properties |
| 2019 | £276,373.25 | -15% |
84 Properties |
| 2018 | £318,925.66 | 11% |
76 Properties |
| 2017 | £283,403.58 | -8% |
130 Properties |
| 2016 | £305,221.77 | -4% |
169 Properties |
| 2015 | £318,052.79 | 16% |
163 Properties |
| 2014 | £266,142.33 | 9% |
148 Properties |
| 2013 | £242,221.05 | 1% |
76 Properties |
| 2012 | £239,892.65 | -2% |
68 Properties |
| 2011 | £244,889 | -3% |
44 Properties |
| 2010 | £251,616 | 9% |
56 Properties |
| 2009 | £229,277 | -10% |
62 Properties |
| 2008 | £253,042 | 4% |
57 Properties |
| 2007 | £244,185 | 1% |
108 Properties |
| 2006 | £241,064 | 5% |
104 Properties |
| 2005 | £228,561.7 | 4% |
94 Properties |
| 2004 | £219,463 | 10% |
98 Properties |
| 2003 | £197,325.6 | 11% |
115 Properties |
| 2002 | £174,992 | 12% |
156 Properties |
| 2001 | £154,022.31 | 0,4% |
171 Properties |
| 2000 | £153,335.34 | 24% |
132 Properties |
| 1999 | £116,809.09 | 4% |
121 Properties |
| 1998 | £112,703.18 | 9% |
159 Properties |
| 1997 | £102,470 | 13% |
207 Properties |
| 1996 | £89,156 | 5% |
181 Properties |
| 1995 | £84,497 | - |
139 Properties |
Property Price per Property Type in Salisbury St Marks And Bishopdown
Here you can find historic sold price data in order to help with your property search.
The average Property Paid Price for specific property types in the last three years are:
| Property Type | Average Sold Price | Sold Properties |
|---|---|---|
| Semi Detached House | £312,609.32 | 59 Semi Detached Houses |
| Detached House | £516,711.59 | 69 Detached Houses |
| Terraced House | £281,170.45 | 66 Terraced Houses |
| Flat | £180,443.56 | 27 Flats |

